Denmark Catalyst Carriers Market (2025-2031) | Growth, Forecast, Value, Industry, Size, Outlook, Trends, Share, Revenue, Analysis, Segmentation & Companies
Market Forecast By Product Type (Ceramics, Activated Carbon, Zeolites), By Shape/Composition (Sphere, Porous, Ring, Extrudate, Honeycomb), By End Use Industry (Oil & Gas, Chemical Manufacturing, Automotive, Petrochemicals, Pharmaceuticals, Agrochemicals, Others), By Material Type (Alumina, Titania, Zirconia, Silicone Carbide, Silica, Others), By Surface Area (Low, Intermediate, High) And Competitive Landscape
| Product Code: ETC5649979 | Publication Date: Nov 2023 | Updated Date: Dec 2025 | Product Type: Market Research Report | |
| Publisher: 6Wresearch | Author: Sumit Sagar | No. of Pages: 60 | No. of Figures: 30 | No. of Tables: 5 |
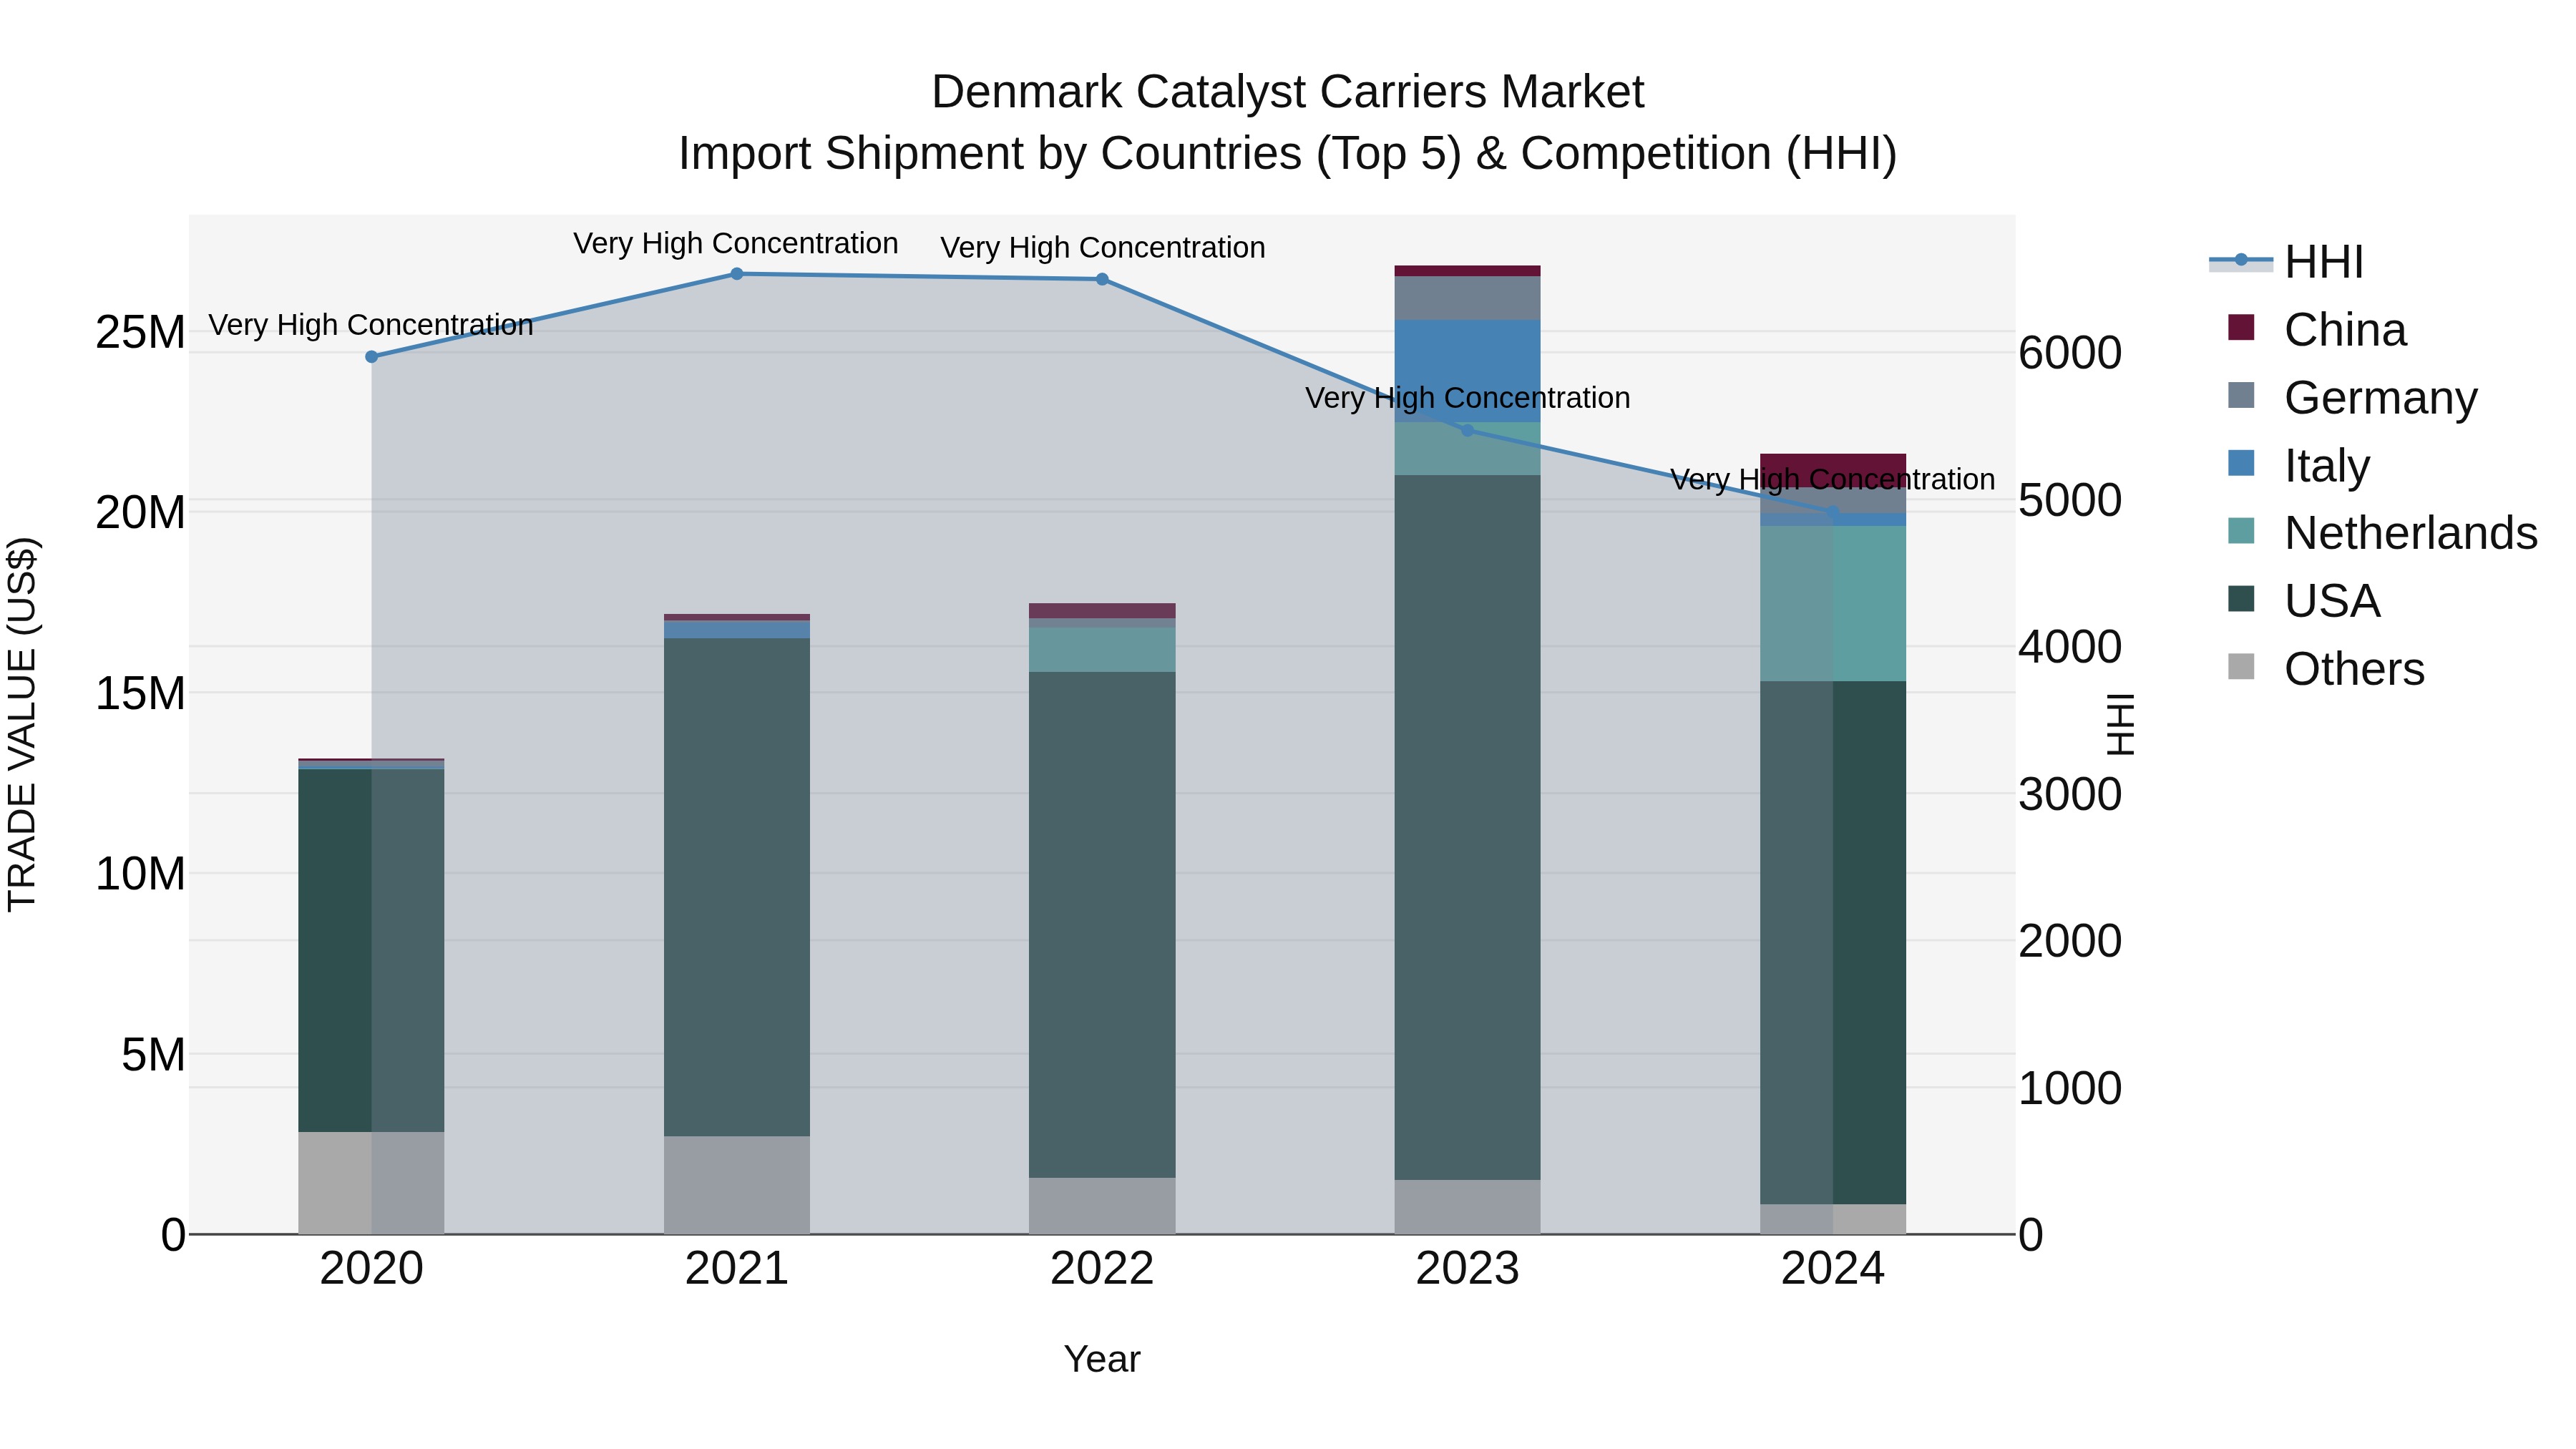
Denmark Catalyst Carriers Market Top 5 Importing Countries and Market Competition (HHI) Analysis
Denmark catalyst carriers import market in 2024 continued to be dominated by key players such as the USA, Netherlands, China, Germany, and Italy. The high Herfindahl-Hirschman Index (HHI) indicates a concentrated market landscape. Despite a strong compound annual growth rate (CAGR) of 13.16% from 2020 to 2024, there was a notable decline in the growth rate from 2023 to 2024, signaling potential shifts in market dynamics. Stakeholders should closely monitor these trends to adapt their strategies accordingly in the evolving catalyst carriers import market in Denmark.
Denmark Catalyst Carriers Market Overview
Denmarks catalyst carriers market is growing, supported by the countrys chemical, petrochemical, and energy sectors. Catalyst carriers are essential for enhancing the performance and lifespan of catalysts used in various industrial processes.
Drivers of the market
The catalyst carriers market in Denmark is driven by its application in chemical manufacturing, oil refining, and environmental protection. Catalyst carriers play a critical role in improving the efficiency and longevity of catalysts used in industrial processes. The growing focus on sustainable energy solutions and the need to reduce emissions are driving demand for advanced catalyst carriers in Denmarks energy and chemical sectors. Additionally, ongoing research and development in material science is leading to the development of more efficient and durable catalyst carriers.
Challenges of the market
The catalyst carriers market faces challenges related to fluctuating demand and pricing across various industries. Manufacturers must navigate evolving regulatory requirements while ensuring product quality and performance. Additionally, competition from alternative materials and technologies complicates market dynamics.
Government Policy of the market
Government policies promoting green chemistry and sustainable industrial processes drive the catalyst carriers market in Denmark. Regulatory frameworks focusing on reducing emissions and enhancing energy efficiency encourage industries to adopt advanced catalysts and carriers for cleaner production processes.
Key Highlights of the Report:
- Denmark Catalyst Carriers Market Outlook
- Market Size of Denmark Catalyst Carriers Market, 2024
- Forecast of Denmark Catalyst Carriers Market, 2031
- Historical Data and Forecast of Denmark Catalyst Carriers Revenues & Volume for the Period 2021-2031
- Denmark Catalyst Carriers Market Trend Evolution
- Denmark Catalyst Carriers Market Drivers and Challenges
- Denmark Catalyst Carriers Price Trends
- Denmark Catalyst Carriers Porter`s Five Forces
- Denmark Catalyst Carriers Industry Life Cycle
- Historical Data and Forecast of Denmark Catalyst Carriers Market Revenues & Volume By Product Type for the Period 2021-2031
- Historical Data and Forecast of Denmark Catalyst Carriers Market Revenues & Volume By Ceramics for the Period 2021-2031
- Historical Data and Forecast of Denmark Catalyst Carriers Market Revenues & Volume By Activated Carbon for the Period 2021-2031
- Historical Data and Forecast of Denmark Catalyst Carriers Market Revenues & Volume By Zeolites for the Period 2021-2031
- Historical Data and Forecast of Denmark Catalyst Carriers Market Revenues & Volume By Shape/Composition for the Period 2021-2031
- Historical Data and Forecast of Denmark Catalyst Carriers Market Revenues & Volume By Sphere for the Period 2021-2031
- Historical Data and Forecast of Denmark Catalyst Carriers Market Revenues & Volume By Porous for the Period 2021-2031
- Historical Data and Forecast of Denmark Catalyst Carriers Market Revenues & Volume By Ring for the Period 2021-2031
- Historical Data and Forecast of Denmark Catalyst Carriers Market Revenues & Volume By Extrudate for the Period 2021-2031
- Historical Data and Forecast of Denmark Catalyst Carriers Market Revenues & Volume By Honeycomb for the Period 2021-2031
- Historical Data and Forecast of Denmark Catalyst Carriers Market Revenues & Volume By End Use Industry for the Period 2021-2031
- Historical Data and Forecast of Denmark Catalyst Carriers Market Revenues & Volume By Oil & Gas for the Period 2021-2031
- Historical Data and Forecast of Denmark Catalyst Carriers Market Revenues & Volume By Chemical Manufacturing for the Period 2021-2031
- Historical Data and Forecast of Denmark Catalyst Carriers Market Revenues & Volume By Automotive for the Period 2021-2031
- Historical Data and Forecast of Denmark Catalyst Carriers Market Revenues & Volume By Petrochemicals for the Period 2021-2031
- Historical Data and Forecast of Denmark Catalyst Carriers Market Revenues & Volume By Pharmaceuticals for the Period 2021-2031
- Historical Data and Forecast of Denmark Catalyst Carriers Market Revenues & Volume By Agrochemicals for the Period 2021-2031
- Historical Data and Forecast of Denmark Catalyst Carriers Market Revenues & Volume By Others for the Period 2021-2031
- Historical Data and Forecast of Denmark Catalyst Carriers Market Revenues & Volume By Material Type for the Period 2021-2031
- Historical Data and Forecast of Denmark Catalyst Carriers Market Revenues & Volume By Alumina for the Period 2021-2031
- Historical Data and Forecast of Denmark Catalyst Carriers Market Revenues & Volume By Titania for the Period 2021-2031
- Historical Data and Forecast of Denmark Catalyst Carriers Market Revenues & Volume By Zirconia for the Period 2021-2031
- Historical Data and Forecast of Denmark Catalyst Carriers Market Revenues & Volume By Silicone Carbide for the Period 2021-2031
- Historical Data and Forecast of Denmark Catalyst Carriers Market Revenues & Volume By Silica for the Period 2021-2031
- Historical Data and Forecast of Denmark Catalyst Carriers Market Revenues & Volume By Others for the Period 2021-2031
- Historical Data and Forecast of Denmark Catalyst Carriers Market Revenues & Volume By Surface Area for the Period 2021-2031
- Historical Data and Forecast of Denmark Catalyst Carriers Market Revenues & Volume By Low for the Period 2021-2031
- Historical Data and Forecast of Denmark Catalyst Carriers Market Revenues & Volume By Intermediate for the Period 2021-2031
- Historical Data and Forecast of Denmark Catalyst Carriers Market Revenues & Volume By High for the Period 2021-2031
- Denmark Catalyst Carriers Import Export Trade Statistics
- Market Opportunity Assessment By Product Type
- Market Opportunity Assessment By Shape/Composition
- Market Opportunity Assessment By End Use Industry
- Market Opportunity Assessment By Material Type
- Market Opportunity Assessment By Surface Area
- Denmark Catalyst Carriers Top Companies Market Share
- Denmark Catalyst Carriers Competitive Benchmarking By Technical and Operational Parameters
- Denmark Catalyst Carriers Company Profiles
- Denmark Catalyst Carriers Key Strategic Recommendations
Frequently Asked Questions About the Market Study (FAQs):
6Wresearch actively monitors the Denmark Catalyst Carriers Market and publishes its comprehensive annual report, highlighting emerging trends, growth drivers, revenue analysis, and forecast outlook. Our insights help businesses to make data-backed strategic decisions with ongoing market dynamics. Our analysts track relevent industries related to the Denmark Catalyst Carriers Market, allowing our clients with actionable intelligence and reliable forecasts tailored to emerging regional needs.
Yes, we provide customisation as per your requirements. To learn more, feel free to contact us on sales@6wresearch.com
1 Executive Summary |
2 Introduction |
2.1 Key Highlights of the Report |
2.2 Report Description |
2.3 Market Scope & Segmentation |
2.4 Research Methodology |
2.5 Assumptions |
3 Denmark Catalyst Carriers Market Overview |
3.1 Denmark Country Macro Economic Indicators |
3.2 Denmark Catalyst Carriers Market Revenues & Volume, 2021 & 2031F |
3.3 Denmark Catalyst Carriers Market - Industry Life Cycle |
3.4 Denmark Catalyst Carriers Market - Porter's Five Forces |
3.5 Denmark Catalyst Carriers Market Revenues & Volume Share, By Product Type, 2021 & 2031F |
3.6 Denmark Catalyst Carriers Market Revenues & Volume Share, By Shape/Composition, 2021 & 2031F |
3.7 Denmark Catalyst Carriers Market Revenues & Volume Share, By End Use Industry, 2021 & 2031F |
3.8 Denmark Catalyst Carriers Market Revenues & Volume Share, By Material Type, 2021 & 2031F |
3.9 Denmark Catalyst Carriers Market Revenues & Volume Share, By Surface Area, 2021 & 2031F |
4 Denmark Catalyst Carriers Market Dynamics |
4.1 Impact Analysis |
4.2 Market Drivers |
4.2.1 Increasing focus on sustainability and environmental regulations driving the demand for catalyst carriers. |
4.2.2 Growth in the chemical industry in Denmark leading to higher demand for catalyst carriers. |
4.2.3 Technological advancements in catalyst carrier materials improving efficiency and performance. |
4.3 Market Restraints |
4.3.1 Fluctuating raw material prices impacting the cost of production of catalyst carriers. |
4.3.2 Intense competition among catalyst carrier manufacturers leading to pricing pressures. |
4.3.3 Regulatory challenges and compliance requirements affecting the market growth. |
5 Denmark Catalyst Carriers Market Trends |
6 Denmark Catalyst Carriers Market Segmentations |
6.1 Denmark Catalyst Carriers Market, By Product Type |
6.1.1 Overview and Analysis |
6.1.2 Denmark Catalyst Carriers Market Revenues & Volume, By Ceramics, 2021-2031F |
6.1.3 Denmark Catalyst Carriers Market Revenues & Volume, By Activated Carbon, 2021-2031F |
6.1.4 Denmark Catalyst Carriers Market Revenues & Volume, By Zeolites, 2021-2031F |
6.2 Denmark Catalyst Carriers Market, By Shape/Composition |
6.2.1 Overview and Analysis |
6.2.2 Denmark Catalyst Carriers Market Revenues & Volume, By Sphere, 2021-2031F |
6.2.3 Denmark Catalyst Carriers Market Revenues & Volume, By Porous, 2021-2031F |
6.2.4 Denmark Catalyst Carriers Market Revenues & Volume, By Ring, 2021-2031F |
6.2.5 Denmark Catalyst Carriers Market Revenues & Volume, By Extrudate, 2021-2031F |
6.2.6 Denmark Catalyst Carriers Market Revenues & Volume, By Honeycomb, 2021-2031F |
6.3 Denmark Catalyst Carriers Market, By End Use Industry |
6.3.1 Overview and Analysis |
6.3.2 Denmark Catalyst Carriers Market Revenues & Volume, By Oil & Gas, 2021-2031F |
6.3.3 Denmark Catalyst Carriers Market Revenues & Volume, By Chemical Manufacturing, 2021-2031F |
6.3.4 Denmark Catalyst Carriers Market Revenues & Volume, By Automotive, 2021-2031F |
6.3.5 Denmark Catalyst Carriers Market Revenues & Volume, By Petrochemicals, 2021-2031F |
6.3.6 Denmark Catalyst Carriers Market Revenues & Volume, By Pharmaceuticals, 2021-2031F |
6.3.7 Denmark Catalyst Carriers Market Revenues & Volume, By Agrochemicals, 2021-2031F |
6.4 Denmark Catalyst Carriers Market, By Material Type |
6.4.1 Overview and Analysis |
6.4.2 Denmark Catalyst Carriers Market Revenues & Volume, By Alumina, 2021-2031F |
6.4.3 Denmark Catalyst Carriers Market Revenues & Volume, By Titania, 2021-2031F |
6.4.4 Denmark Catalyst Carriers Market Revenues & Volume, By Zirconia, 2021-2031F |
6.4.5 Denmark Catalyst Carriers Market Revenues & Volume, By Silicone Carbide, 2021-2031F |
6.4.6 Denmark Catalyst Carriers Market Revenues & Volume, By Silica, 2021-2031F |
6.4.7 Denmark Catalyst Carriers Market Revenues & Volume, By Others, 2021-2031F |
6.5 Denmark Catalyst Carriers Market, By Surface Area |
6.5.1 Overview and Analysis |
6.5.2 Denmark Catalyst Carriers Market Revenues & Volume, By Low, 2021-2031F |
6.5.3 Denmark Catalyst Carriers Market Revenues & Volume, By Intermediate, 2021-2031F |
6.5.4 Denmark Catalyst Carriers Market Revenues & Volume, By High, 2021-2031F |
7 Denmark Catalyst Carriers Market Import-Export Trade Statistics |
7.1 Denmark Catalyst Carriers Market Export to Major Countries |
7.2 Denmark Catalyst Carriers Market Imports from Major Countries |
8 Denmark Catalyst Carriers Market Key Performance Indicators |
8.1 Research and development investment in new catalyst carrier materials. |
8.2 Adoption rate of advanced catalyst carrier technologies in the market. |
8.3 Number of patents filed for catalyst carrier innovations. |
8.4 Environmental impact assessment of catalyst carriers used in industrial processes. |
8.5 Customer satisfaction and retention rates in the catalyst carrier market. |
9 Denmark Catalyst Carriers Market - Opportunity Assessment |
9.1 Denmark Catalyst Carriers Market Opportunity Assessment, By Product Type, 2021 & 2031F |
9.2 Denmark Catalyst Carriers Market Opportunity Assessment, By Shape/Composition, 2021 & 2031F |
9.3 Denmark Catalyst Carriers Market Opportunity Assessment, By End Use Industry, 2021 & 2031F |
9.4 Denmark Catalyst Carriers Market Opportunity Assessment, By Material Type, 2021 & 2031F |
9.5 Denmark Catalyst Carriers Market Opportunity Assessment, By Surface Area, 2021 & 2031F |
10 Denmark Catalyst Carriers Market - Competitive Landscape |
10.1 Denmark Catalyst Carriers Market Revenue Share, By Companies, 2024 |
10.2 Denmark Catalyst Carriers Market Competitive Benchmarking, By Operating and Technical Parameters |
11 Company Profiles |
12 Recommendations | 13 Disclaimer |
Export potential assessment - trade Analytics for 2030
Export potential enables firms to identify high-growth global markets with greater confidence by combining advanced trade intelligence with a structured quantitative methodology. The framework analyzes emerging demand trends and country-level import patterns while integrating macroeconomic and trade datasets such as GDP and population forecasts, bilateral import–export flows, tariff structures, elasticity differentials between developed and developing economies, geographic distance, and import demand projections. Using weighted trade values from 2020–2024 as the base period to project country-to-country export potential for 2030, these inputs are operationalized through calculated drivers such as gravity model parameters, tariff impact factors, and projected GDP per-capita growth. Through an analysis of hidden potentials, demand hotspots, and market conditions that are most favorable to success, this method enables firms to focus on target countries, maximize returns, and global expansion with data, backed by accuracy.
By factoring in the projected importer demand gap that is currently unmet and could be potential opportunity, it identifies the potential for the Exporter (Country) among 190 countries, against the general trade analysis, which identifies the biggest importer or exporter.
To discover high-growth global markets and optimize your business strategy:
Click Here
Pricing
- Single User License$ 1,995
- Department License$ 2,400
- Site License$ 3,120
- Global License$ 3,795

Search
Thought Leadership and Analyst Meet


Our Clients
Latest Reports
- Philippines Polyhydroxybutyrate-co-Hydroxyvalerate Market (2026-2032) | Trends, Insights, Challenges, Restraints, Competition, Size, Value, Forecast, Pricing, Share, Outlook, Revenue, Investment Opportunities, Strategy, Drivers, Demand, Growth, segmentation, Analysis, Companies
- Peru Polyhydroxybutyrate-co-Hydroxyvalerate Market (2026-2032) | Growth, Demand, Challenges, Share, Trends, Analysis, Pricing, Investment Opportunities, Drivers, Value, Forecast, Competition, Size, Companies, Insights, Outlook, Restraints, segmentation, Revenue, Strategy
- Pakistan Polyhydroxybutyrate-co-Hydroxyvalerate Market (2026-2032) | Restraints, segmentation, Pricing, Forecast, Share, Strategy, Competition, Trends, Insights, Drivers, Challenges, Growth, Revenue, Outlook, Value, Investment Opportunities, Companies, Size, Analysis, Demand
- Oman Polyhydroxybutyrate-co-Hydroxyvalerate Market (2026-2032) | Drivers, segmentation, Insights, Competition, Pricing, Outlook, Size, Revenue, Challenges, Forecast, Analysis, Growth, Value, Share, Trends, Investment Opportunities, Strategy, Restraints, Companies, Demand
- Nigeria Polyhydroxybutyrate-co-Hydroxyvalerate Market (2026-2032) | Value, Investment Opportunities, Analysis, Revenue, Restraints, Pricing, Outlook, Competition, Demand, Growth, Forecast, Companies, Trends, Challenges, segmentation, Drivers, Insights, Share, Size, Strategy
- Nepal Polyhydroxybutyrate-co-Hydroxyvalerate Market (2026-2032) | Insights, Analysis, Drivers, Share, Revenue, Demand, segmentation, Investment Opportunities, Competition, Forecast, Growth, Pricing, Companies, Strategy, Trends, Restraints, Challenges, Outlook, Size, Value
- Myanmar Polyhydroxybutyrate-co-Hydroxyvalerate Market (2026-2032) | Outlook, Revenue, Strategy, Restraints, Drivers, segmentation, Share, Forecast, Competition, Insights, Growth, Pricing, Size, Demand, Value, Companies, Trends, Challenges, Investment Opportunities, Analysis
- Morocco Polyhydroxybutyrate-co-Hydroxyvalerate Market (2026-2032) | Outlook, Investment Opportunities, Restraints, Strategy, Forecast, Challenges, Drivers, Growth, Companies, segmentation, Trends, Size, Competition, Revenue, Demand, Insights, Share, Analysis, Value, Pricing
- Mexico Polyhydroxybutyrate-co-Hydroxyvalerate Market (2026-2032) | Size, Drivers, Outlook, Share, Strategy, Growth, Pricing, Challenges, Companies, Demand, Value, Investment Opportunities, Restraints, Trends, Forecast, segmentation, Analysis, Insights, Competition, Revenue
- Malaysia Polyhydroxybutyrate-co-Hydroxyvalerate Market (2026-2032) | Share, segmentation, Size, Companies, Analysis, Insights, Forecast, Value, Revenue, Drivers, Restraints, Challenges, Investment Opportunities, Trends, Competition, Strategy, Demand, Growth, Outlook, Pricing
Industry Events and Analyst Meet

HIMTEX 2026

India Refining Summit 2026

India EV Show 2026

EV tech India Expo 2026

Auto Tech Asia 2026
Whitepaper
- Middle East & Africa Commercial Security Market Click here to view more.
- Middle East & Africa Fire Safety Systems & Equipment Market Click here to view more.
- GCC Drone Market Click here to view more.
- Middle East Lighting Fixture Market Click here to view more.
- GCC Physical & Perimeter Security Market Click here to view more.
6WResearch In News
- Doha a strategic location for EV manufacturing hub: IPA Qatar
- Demand for luxury TVs surging in the GCC, says Samsung
- Empowering Growth: The Thriving Journey of Bangladesh’s Cable Industry
- Demand for luxury TVs surging in the GCC, says Samsung
- Video call with a traditional healer? Once unthinkable, it’s now common in South Africa
- Intelligent Buildings To Smooth GCC’s Path To Net Zero