Denmark Conductive Yarn Market (2026-2032) | Revenue, Companies, Outlook, Forecast, Size, Value, Analysis, Trends, Growth, Segmentation, Share & Industry
Market Forecast By ProductType (Metallic Type, Carbon-Based Type, Metal Compound Type), By Application (Anti-Static Fabric, Signal Transmission, Cellphone Protective Cover) And Competitive Landscape
| Product Code: ETC5384264 | Publication Date: Nov 2023 | Updated Date: Apr 2026 | Product Type: Market Research Report | |
| Publisher: 6Wresearch | Author: Ravi Bhandari | No. of Pages: 60 | No. of Figures: 30 | No. of Tables: 5 |
Denmark Conductive Yarn Market Size (2020-2030)
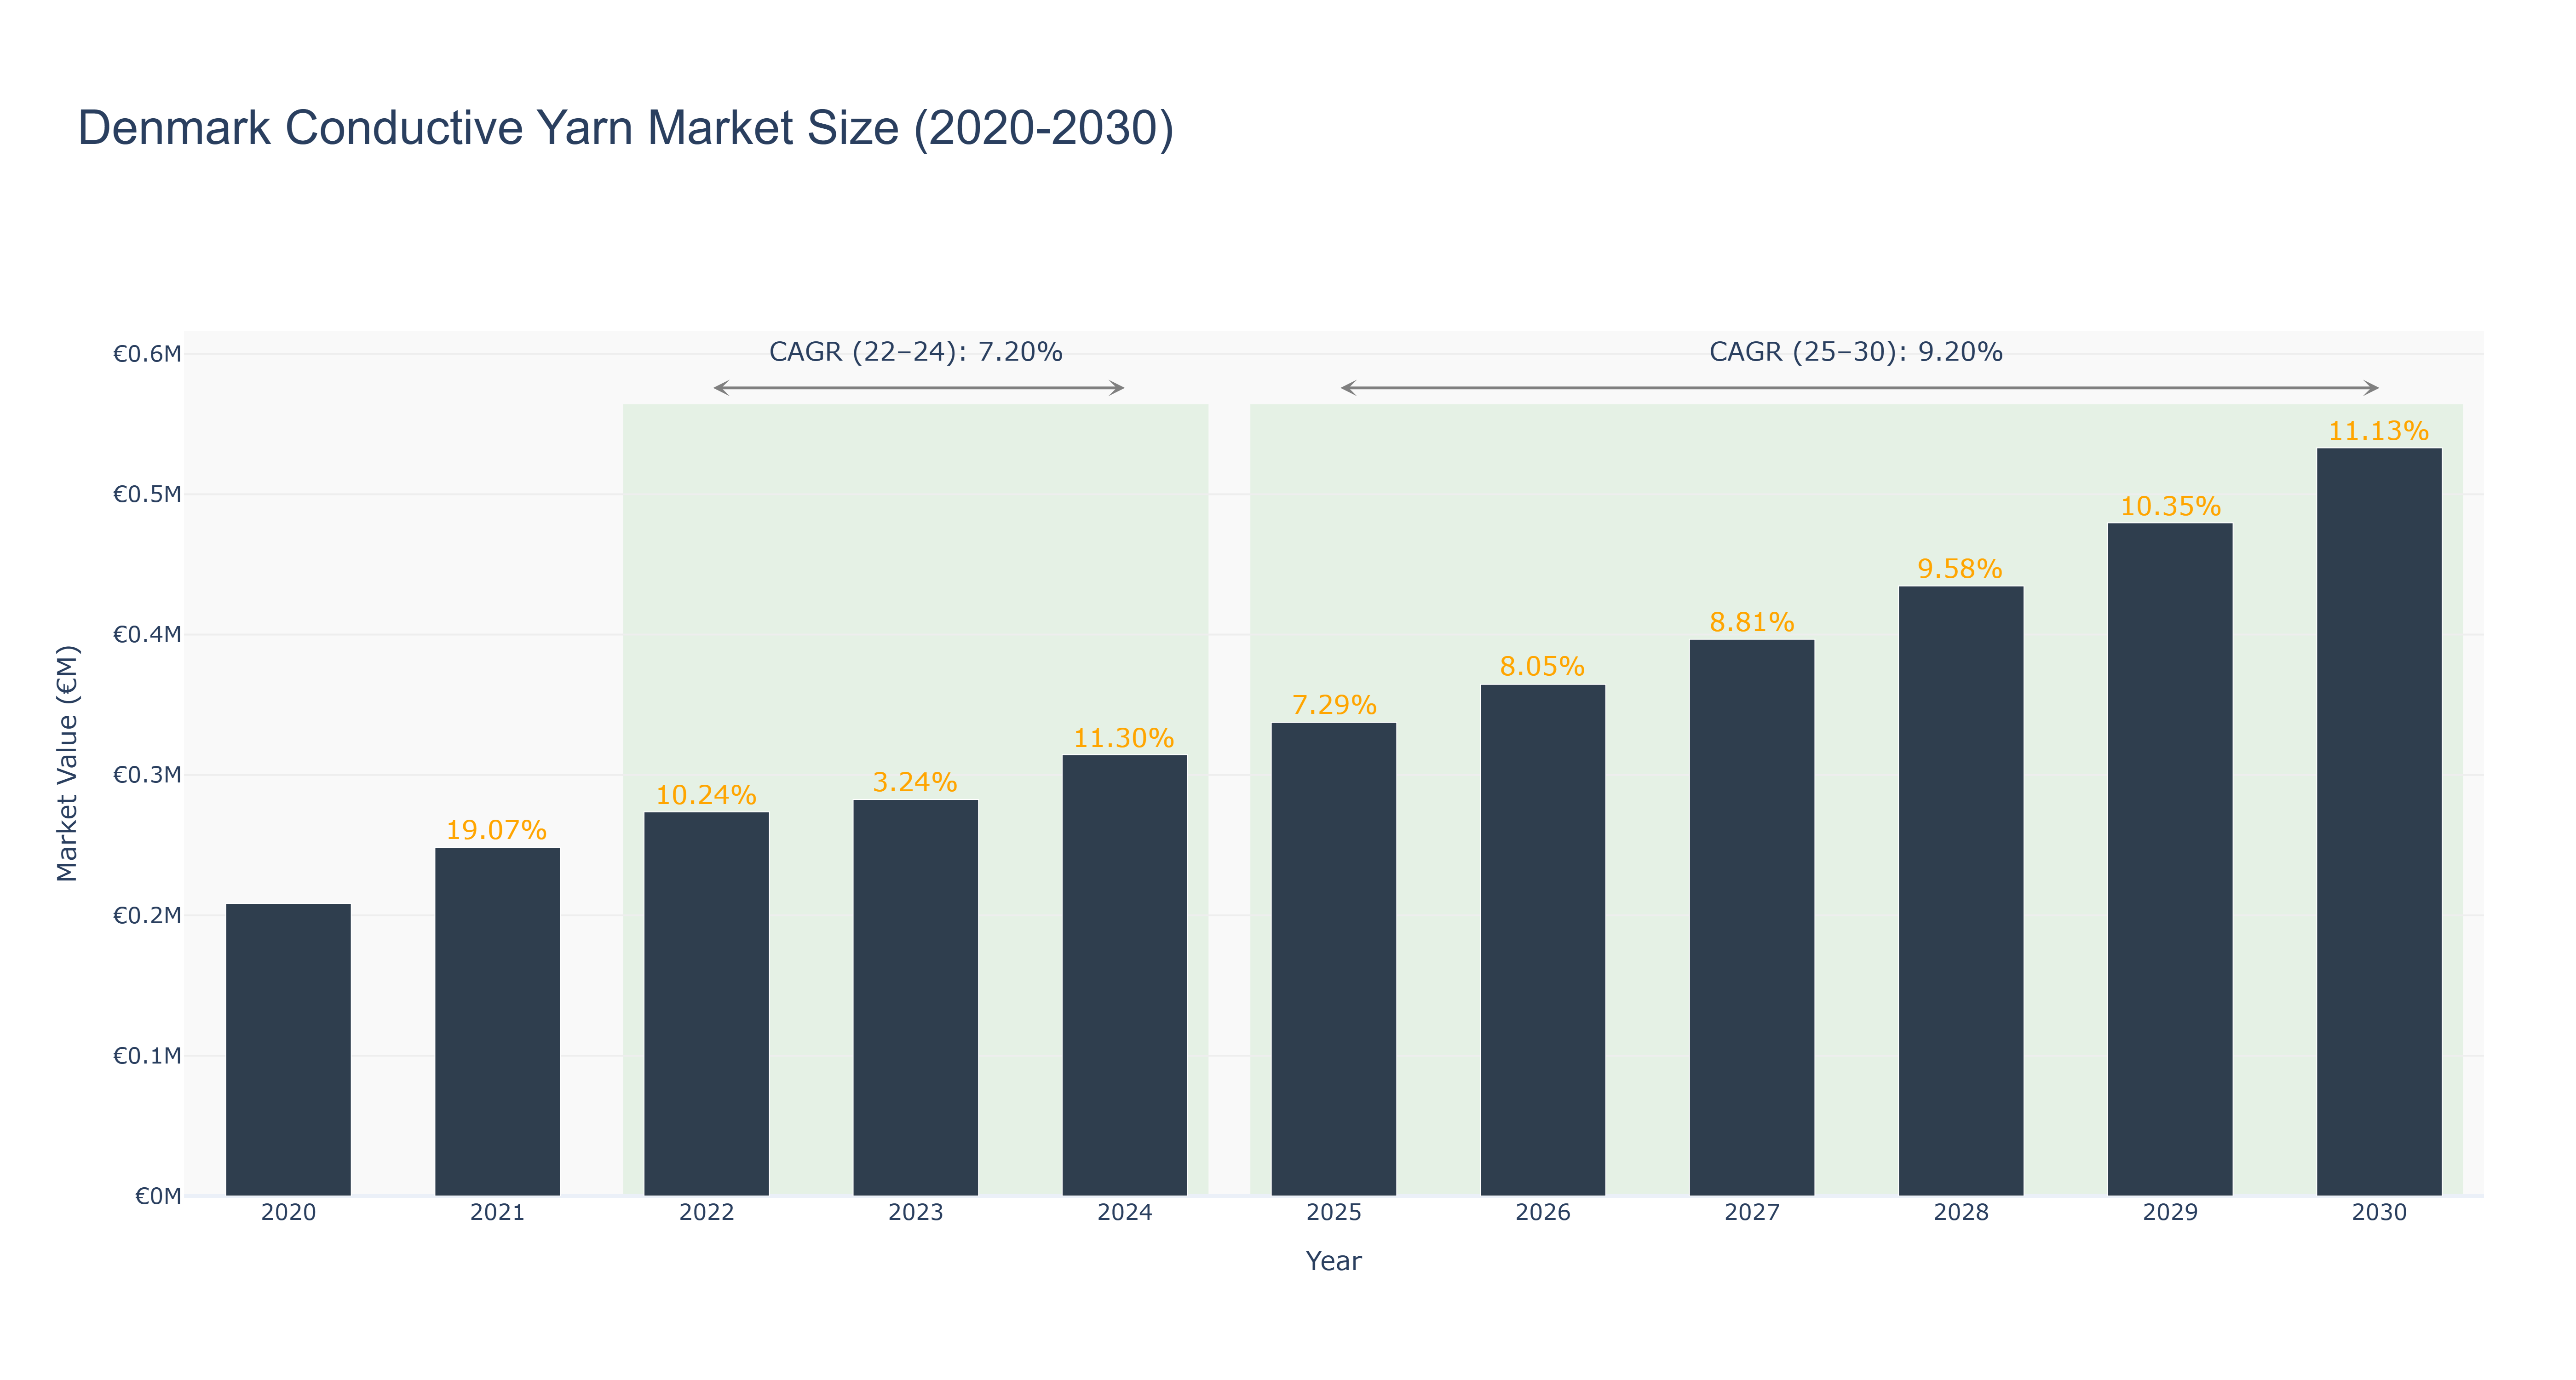
Denmark Conductive Yarn Market has shown a consistent growth trajectory over the years. The peak market size of €0.53 million in 2030 is forecasted, with a steady increase from €0.21 million in 2020. Notable growth spurts include a 11.30% increase in 2024 and a 11.13% growth in 2030. The CAGR for the periods 2022-24 and 2025-30 stand at 7.20% and 9.20% respectively. The market's growth can be attributed to increasing demand for smart textiles and wearable technology applications. In recent developments, Denmark has initiated collaborations with leading textile manufacturers to enhance the production of conductive yarn for innovative tech-driven textile products, promising a bright future for the market. Industry drivers include advancements in wearable technology, increasing adoption of smart textiles in various industries, and growing consumer awareness regarding the benefits of conductive yarn in enhancing textile functionality.
Denmark Conductive Yarn Market: Production & Trade Performance (2019-2025)
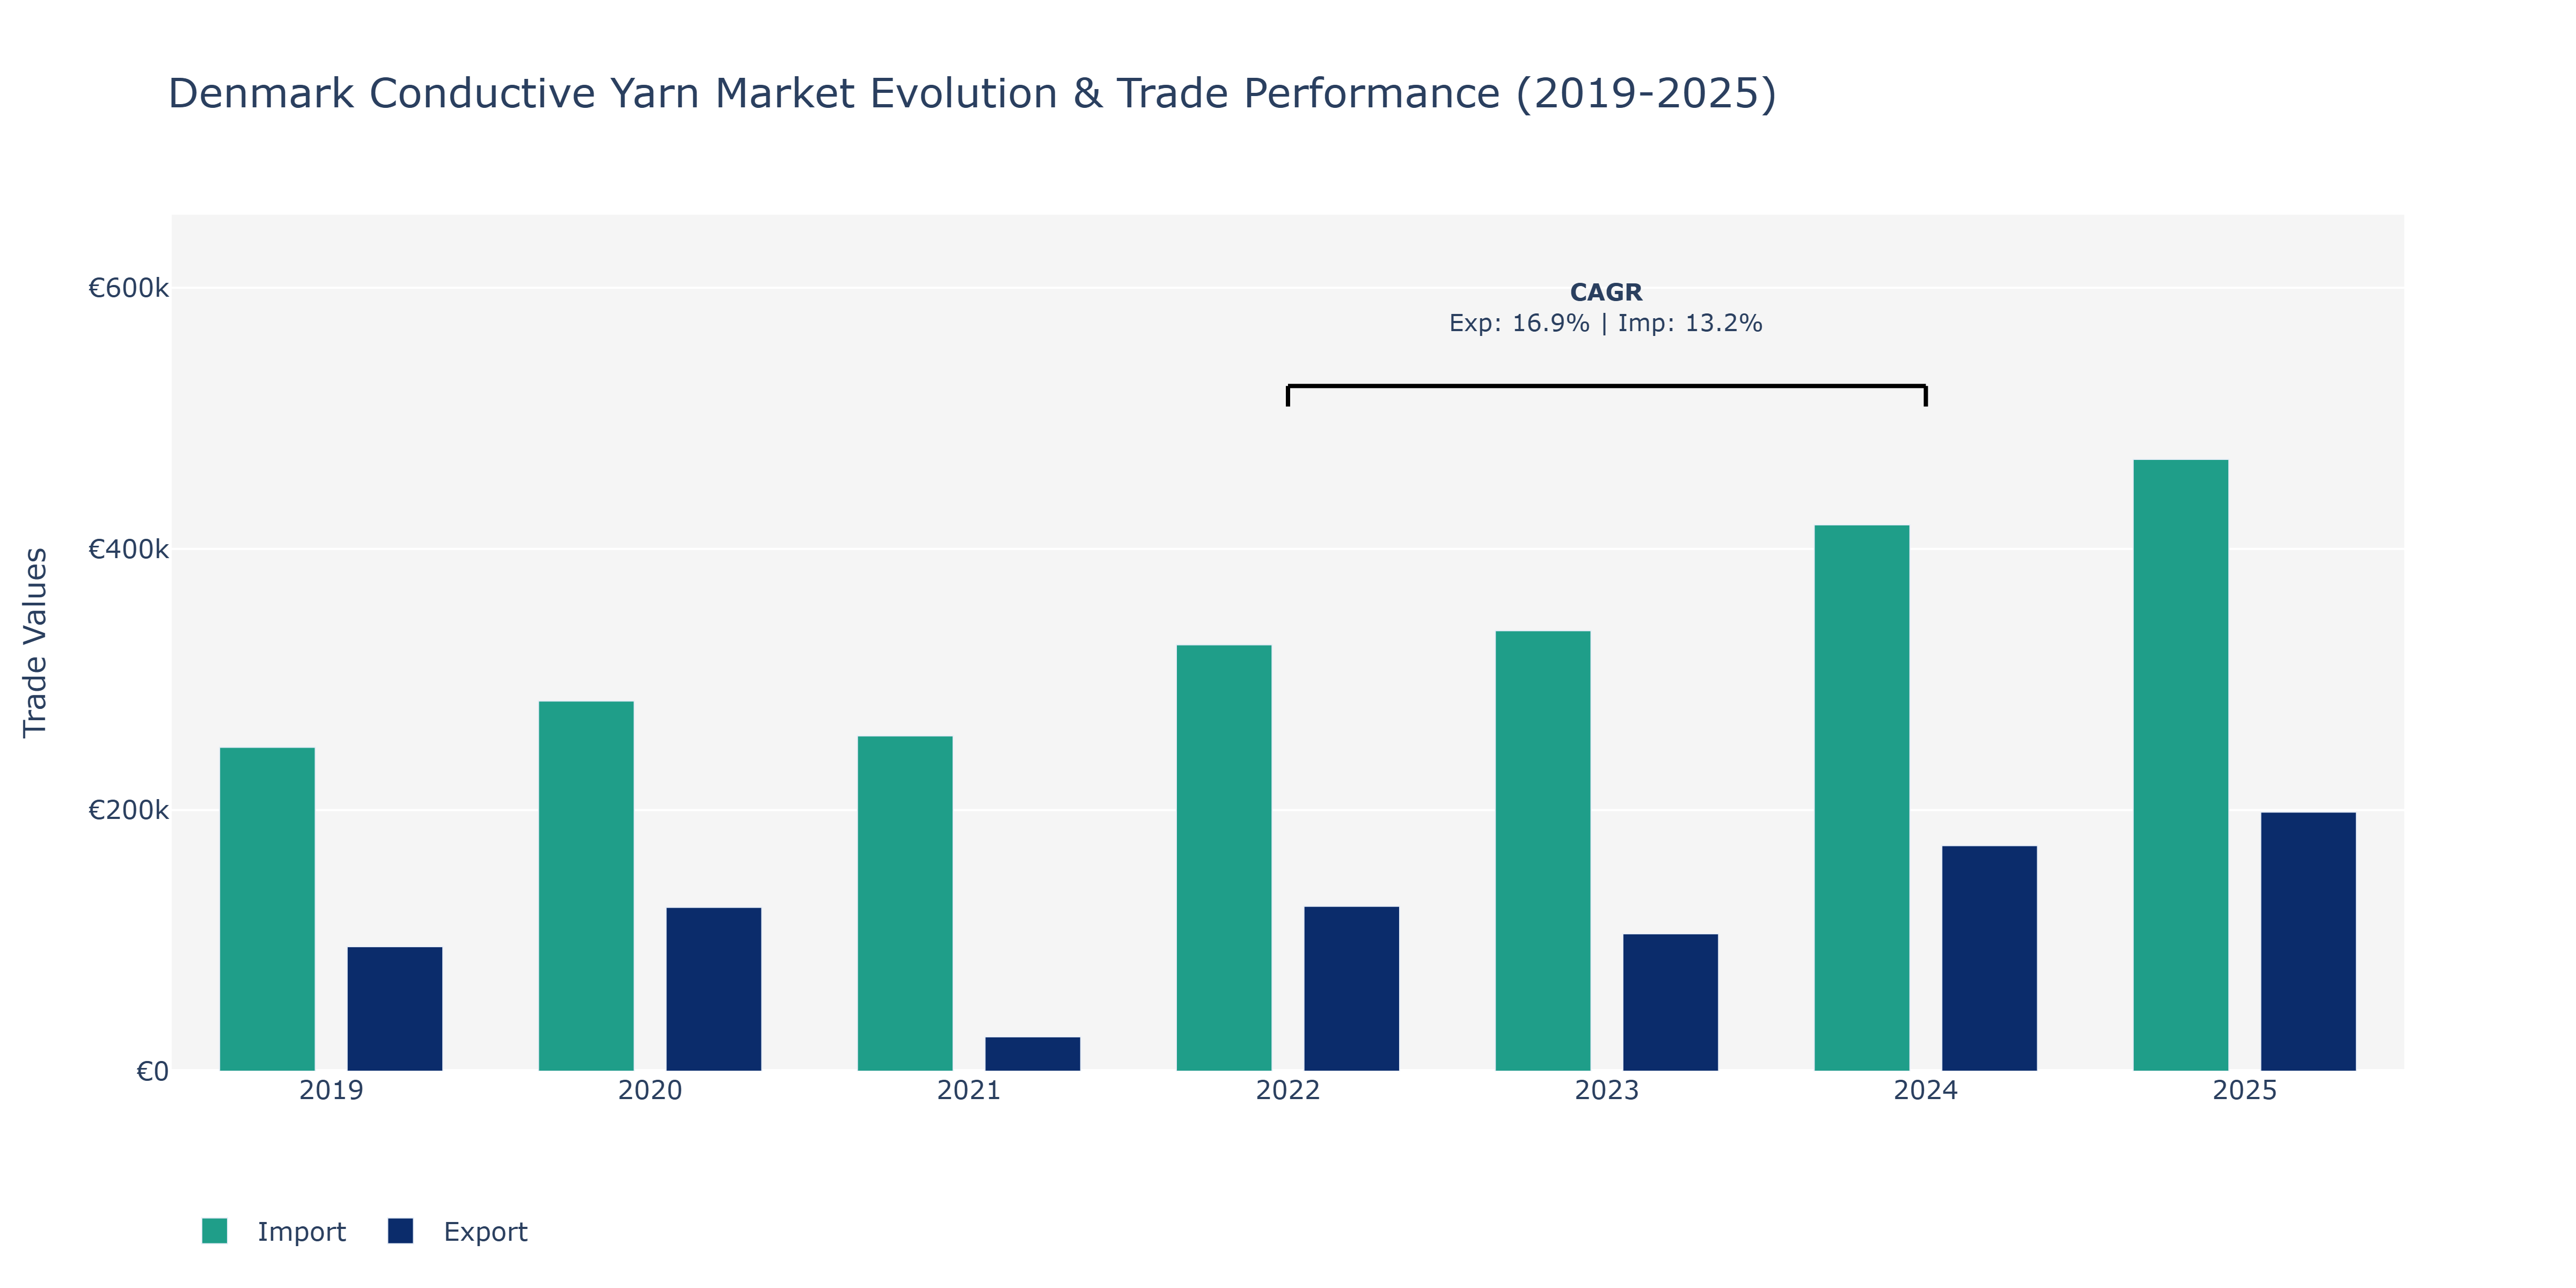
Between 2019 and 2025, Denmark's Conductive Yarn Market experienced notable fluctuations in both exports and imports. Exports saw a substantial rise from €95.39 thousand in 2019 to €198.4 thousand in 2025, marking a peak in that period. This increase can be attributed to the growing demand for conductive yarn in various industries, including electronics and textiles. On the other hand, imports also displayed an upward trend, increasing from €248.07 thousand in 2019 to €468.54 thousand in 2025, indicating a consistent demand for foreign conductive yarn products. The significant surge in imports could be due to Denmark's reliance on specialized conductive yarn varieties not domestically produced. The Conductive Yarn Market's growth aligns with the global trend towards smart textiles and wearable technology, driving both export and import activities in the sector.
Key Highlights of the Report:
- Denmark Conductive Yarn Market Outlook
- Market Size of Denmark Conductive Yarn Market, 2025
- Forecast of Denmark Conductive Yarn Market, 2032
- Historical Data and Forecast of Denmark Conductive Yarn Revenues & Volume for the Period 2022 - 2032F
- Denmark Conductive Yarn Market Trend Evolution
- Denmark Conductive Yarn Market Drivers and Challenges
- Denmark Conductive Yarn Price Trends
- Denmark Conductive Yarn Porter`s Five Forces
- Denmark Conductive Yarn Industry Life Cycle
- Historical Data and Forecast of Denmark Conductive Yarn Market Revenues & Volume By ProductType for the Period 2022 - 2032F
- Historical Data and Forecast of Denmark Conductive Yarn Market Revenues & Volume By Metallic Type for the Period 2022 - 2032F
- Historical Data and Forecast of Denmark Conductive Yarn Market Revenues & Volume By Carbon-Based Type for the Period 2022 - 2032F
- Historical Data and Forecast of Denmark Conductive Yarn Market Revenues & Volume By Metal Compound Type for the Period 2022 - 2032F
- Historical Data and Forecast of Denmark Conductive Yarn Market Revenues & Volume By Application for the Period 2022 - 2032F
- Historical Data and Forecast of Denmark Conductive Yarn Market Revenues & Volume By Anti-Static Fabric for the Period 2022 - 2032F
- Historical Data and Forecast of Denmark Conductive Yarn Market Revenues & Volume By Signal Transmission for the Period 2022 - 2032F
- Historical Data and Forecast of Denmark Conductive Yarn Market Revenues & Volume By Cellphone Protective Cover for the Period 2022 - 2032F
- Denmark Conductive Yarn Import Export Trade Statistics
- Market Opportunity Assessment By ProductType
- Market Opportunity Assessment By Application
- Denmark Conductive Yarn Top Companies Market Share
- Denmark Conductive Yarn Competitive Benchmarking By Technical and Operational Parameters
- Denmark Conductive Yarn Company Profiles
- Denmark Conductive Yarn Key Strategic Recommendations
Frequently Asked Questions About the Market Study (FAQs):
6Wresearch actively monitors the Denmark Conductive Yarn Market and publishes its comprehensive annual report, highlighting emerging trends, growth drivers, revenue analysis, and forecast outlook. Our insights help businesses to make data-backed strategic decisions with ongoing market dynamics. Our analysts track relevent industries related to the Denmark Conductive Yarn Market, allowing our clients with actionable intelligence and reliable forecasts tailored to emerging regional needs.
Yes, we provide customisation as per your requirements. To learn more, feel free to contact us on sales@6wresearch.com
1 Executive Summary |
2 Introduction |
2.1 Key Highlights of the Report |
2.2 Report Description |
2.3 Market Scope & Segmentation |
2.4 Research Methodology |
2.5 Assumptions |
3 Denmark Conductive Yarn Market Overview |
3.1 Denmark Country Macro Economic Indicators |
3.2 Denmark Conductive Yarn Market Revenues & Volume, 2022 & 2032F |
3.3 Denmark Conductive Yarn Market - Industry Life Cycle |
3.4 Denmark Conductive Yarn Market - Porter's Five Forces |
3.5 Denmark Conductive Yarn Market Revenues & Volume Share, By Product? Type, 2022 & 2032F |
3.6 Denmark Conductive Yarn Market Revenues & Volume Share, By Application, 2022 & 2032F |
4 Denmark Conductive Yarn Market Dynamics |
4.1 Impact Analysis |
4.2 Market Drivers |
4.2.1 Increasing demand for smart textiles and wearable technology |
4.2.2 Growing awareness about the benefits of conductive yarn in various industries |
4.2.3 Technological advancements leading to improved performance and durability of conductive yarn |
4.3 Market Restraints |
4.3.1 High initial investment and production costs |
4.3.2 Limited availability of skilled labor for manufacturing conductive yarn products |
4.3.3 Stringent government regulations related to the use of conductive materials in textiles |
5 Denmark Conductive Yarn Market Trends |
6 Denmark Conductive Yarn Market Segmentations |
6.1 Denmark Conductive Yarn Market, By Product? Type |
6.1.1 Overview and Analysis |
6.1.2 Denmark Conductive Yarn Market Revenues & Volume, By Metallic Type, 2022 - 2032F |
6.1.3 Denmark Conductive Yarn Market Revenues & Volume, By Carbon-Based Type, 2022 - 2032F |
6.1.4 Denmark Conductive Yarn Market Revenues & Volume, By Metal Compound Type, 2022 - 2032F |
6.2 Denmark Conductive Yarn Market, By Application |
6.2.1 Overview and Analysis |
6.2.2 Denmark Conductive Yarn Market Revenues & Volume, By Anti-Static Fabric, 2022 - 2032F |
6.2.3 Denmark Conductive Yarn Market Revenues & Volume, By Signal Transmission, 2022 - 2032F |
6.2.4 Denmark Conductive Yarn Market Revenues & Volume, By Cellphone Protective Cover, 2022 - 2032F |
7 Denmark Conductive Yarn Market Import-Export Trade Statistics |
7.1 Denmark Conductive Yarn Market Export to Major Countries |
7.2 Denmark Conductive Yarn Market Imports from Major Countries |
8 Denmark Conductive Yarn Market Key Performance Indicators |
8.1 Research and development investment in new conductive yarn technologies |
8.2 Number of partnerships and collaborations with technology companies for innovative product development |
8.3 Rate of adoption of conductive yarn in different industries |
9 Denmark Conductive Yarn Market - Opportunity Assessment |
9.1 Denmark Conductive Yarn Market Opportunity Assessment, By Product? Type, 2022 & 2032F |
9.2 Denmark Conductive Yarn Market Opportunity Assessment, By Application, 2022 & 2032F |
10 Denmark Conductive Yarn Market - Competitive Landscape |
10.1 Denmark Conductive Yarn Market Revenue Share, By Companies, 2025 |
10.2 Denmark Conductive Yarn Market Competitive Benchmarking, By Operating and Technical Parameters |
11 Company Profiles |
12 Recommendations | 13 Disclaimer |
Global Go To Market Strategy - 2030
Export potential enables firms to identify high-growth global markets with greater confidence by combining advanced trade intelligence with a structured quantitative methodology. The framework analyzes emerging demand trends and country-level import patterns while integrating macroeconomic and trade datasets such as GDP and population forecasts, bilateral import–export flows, tariff structures, elasticity differentials between developed and developing economies, geographic distance, and import demand projections. Using weighted trade values from 2020–2024 as the base period to project country-to-country export potential for 2030, these inputs are operationalized through calculated drivers such as gravity model parameters, tariff impact factors, and projected GDP per-capita growth. Through an analysis of hidden potentials, demand hotspots, and market conditions that are most favorable to success, this method enables firms to focus on target countries, maximize returns, and global expansion with data, backed by accuracy.
By factoring in the projected importer demand gap that is currently unmet and could be potential opportunity, it identifies the potential for the Exporter (Country) among 190 countries, against the general trade analysis, which identifies the biggest importer or exporter.
To discover high-growth global markets and optimize your business strategy:
Click Here
Pricing
- Single User License$ 1,995
- Department License$ 2,400
- Site License$ 3,120
- Global License$ 3,795

Leadership Perspectives from Industry Events
Search
Thought Leadership and Analyst Meet


Our Clients
6WResearch In News
- Doha a strategic location for EV manufacturing hub: IPA Qatar
- Demand for luxury TVs surging in the GCC, says Samsung
- Empowering Growth: The Thriving Journey of Bangladesh’s Cable Industry
- Demand for luxury TVs surging in the GCC, says Samsung
- Video call with a traditional healer? Once unthinkable, it’s now common in South Africa
- Intelligent Buildings To Smooth GCC’s Path To Net Zero
Latest Reports
- Taiwan Airport Wireless Infrastructure Market (2026-2032)
- Vietnam Airport Wireless Infrastructure Market (2026-2032)
- Thailand Airport Wireless Infrastructure Market (2026-2032)
- South Korea Airport Wireless Infrastructure Market (2026-2032)
- Romania Airport Wireless Infrastructure Market (2026-2032)
- Qatar Airport Wireless Infrastructure Market (2026-2032)
- Philippines Airport Wireless Infrastructure Market (2026-2032)
- Japan Airport Wireless Infrastructure Market (2026-2032)
- Taiwan Airport Winter Services Market (2026-2032)
- Vietnam Airport Winter Services Market (2026-2032)
Industry Events and Analyst Meet

HIMTEX 2026

India Refining Summit 2026

India EV Show 2026

EV tech India Expo 2026

Auto Tech Asia 2026
Whitepaper
- Middle East & Africa Commercial Security Market Click here to view more.
- Middle East & Africa Fire Safety Systems & Equipment Market Click here to view more.
- GCC Drone Market Click here to view more.
- Middle East Lighting Fixture Market Click here to view more.
- GCC Physical & Perimeter Security Market Click here to view more.