Denmark Copper Pipe and Tube Market (2026-2032) | Outlook, Share, Segmentation, Value, Growth, Size, Companies, Trends, Revenue, Industry, Analysis & Forecast
Market Forecast By End Use (HVAC , Industrial Heat Exchanger , Plumbing , Electrical , Others) And Competitive Landscape
| Product Code: ETC5068123 | Publication Date: Nov 2023 | Updated Date: Apr 2026 | Product Type: Market Research Report | |
| Publisher: 6Wresearch | Author: Shubham Padhi | No. of Pages: 60 | No. of Figures: 30 | No. of Tables: 5 |
Denmark Copper Pipe And Tube Market Size (2020-2030)
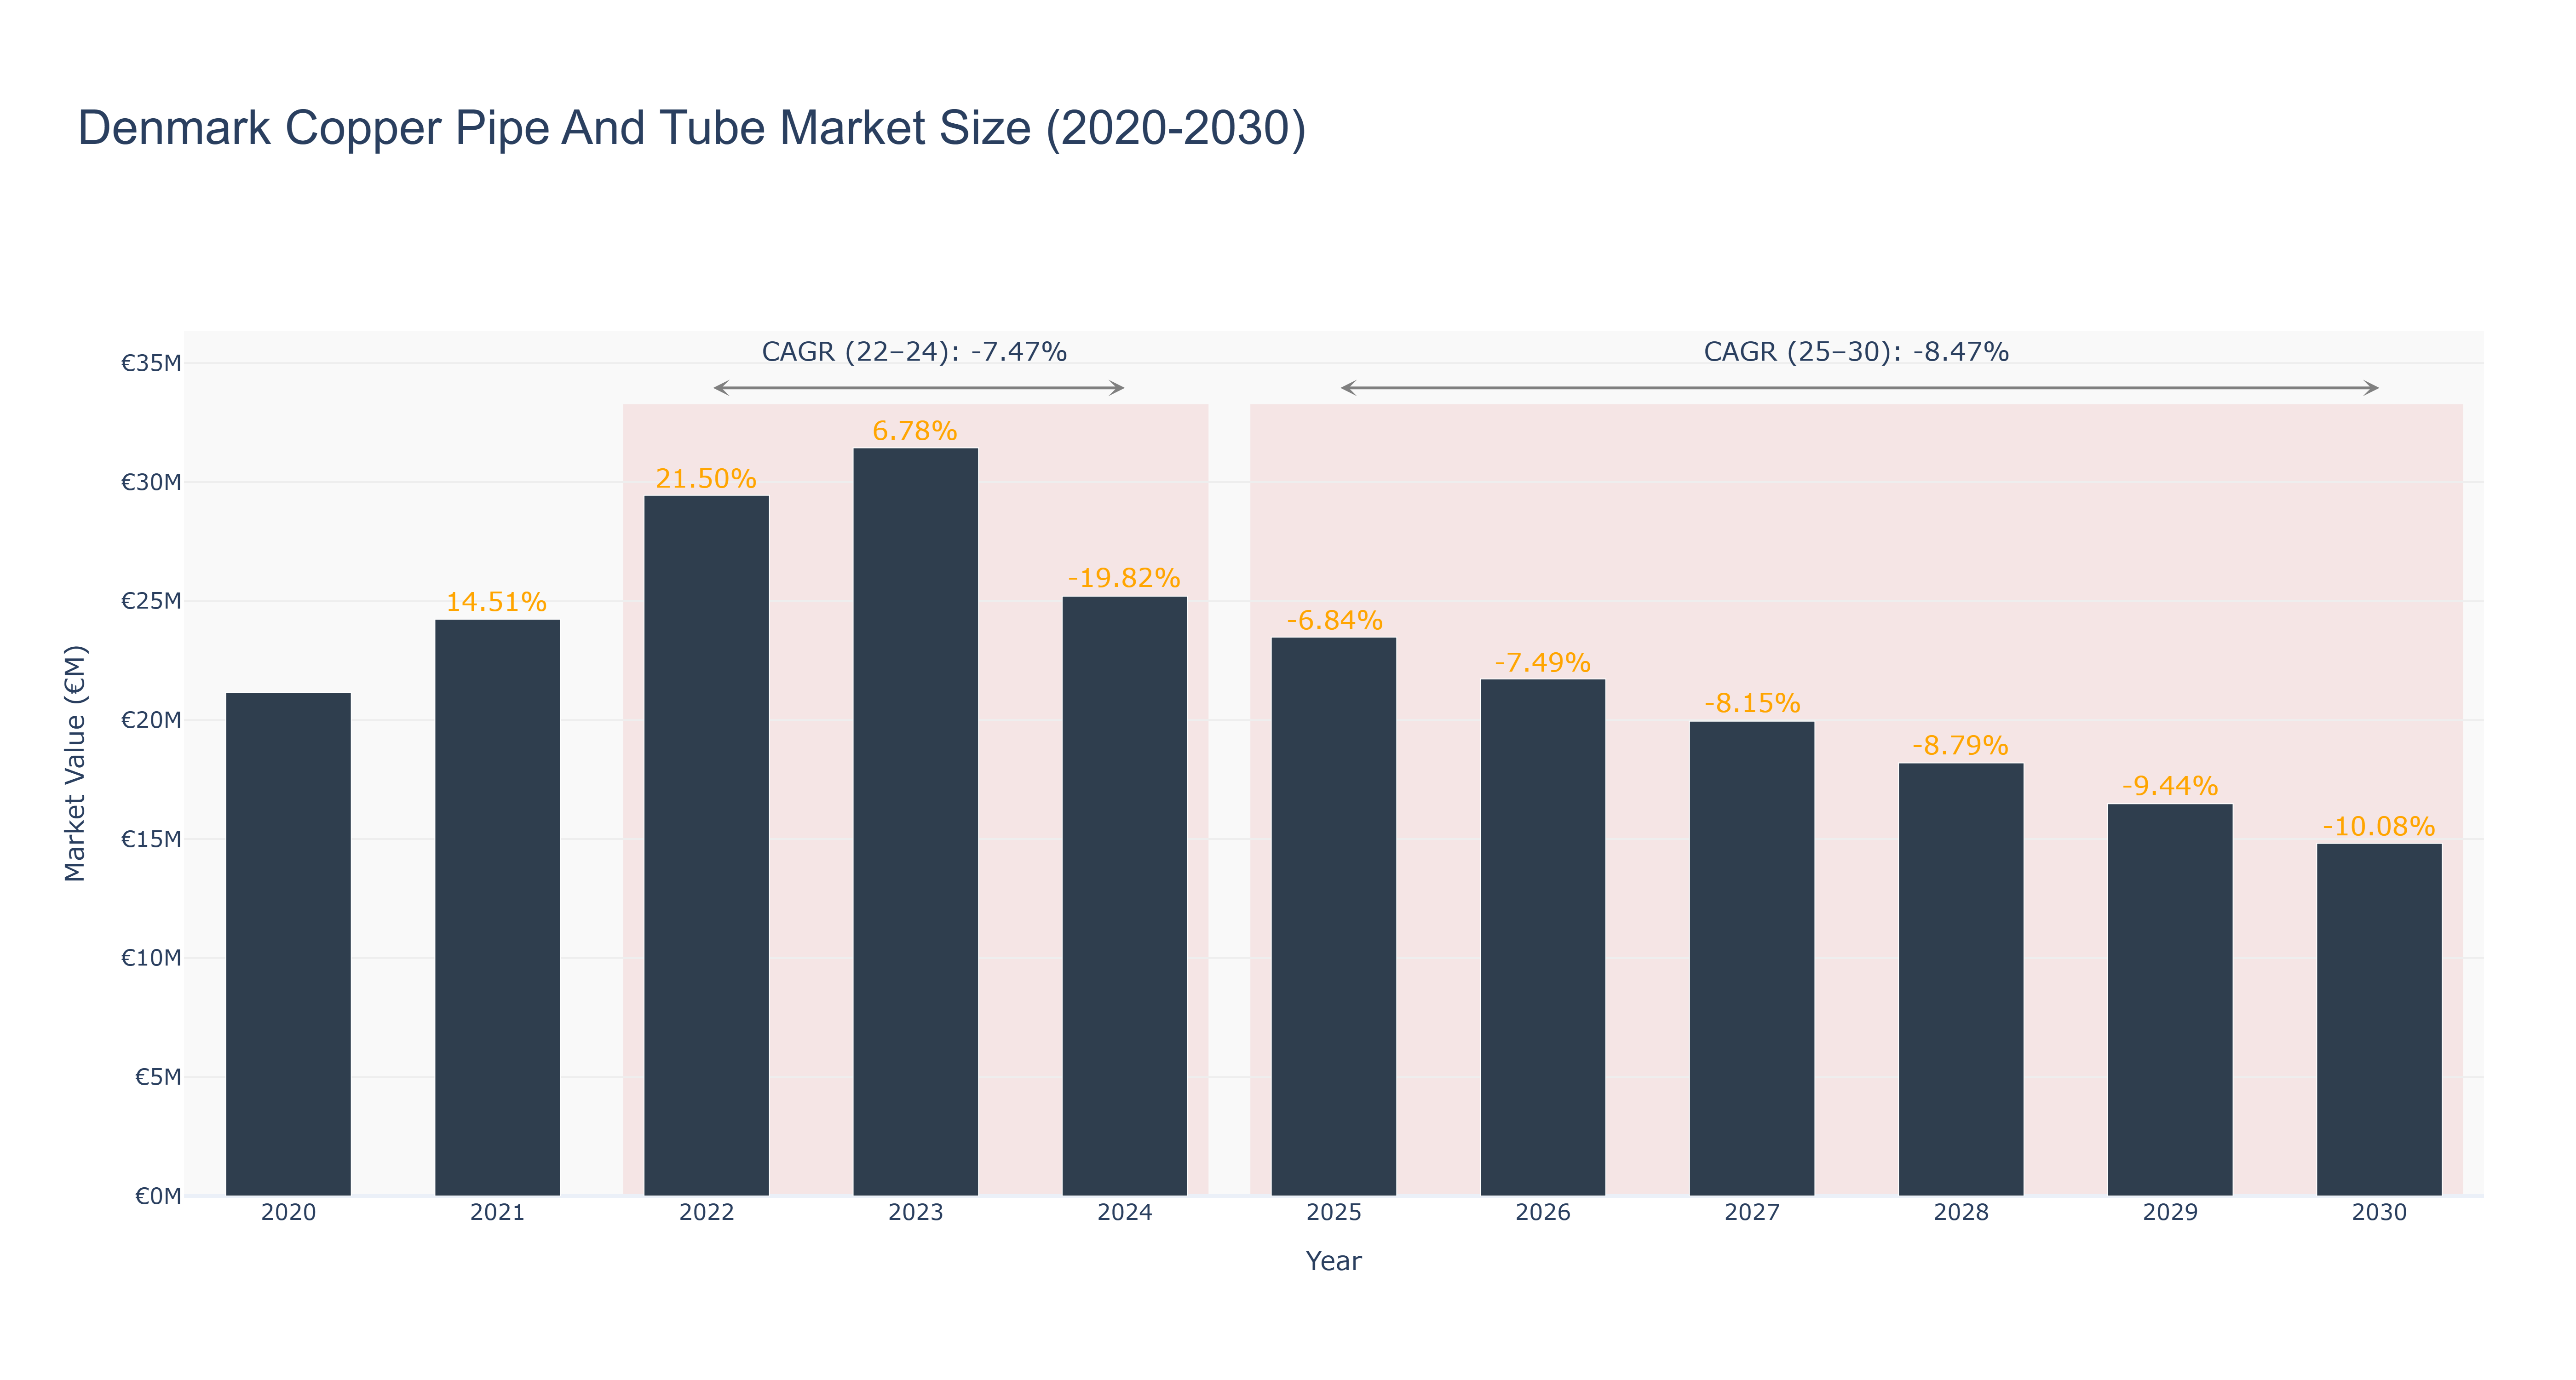
The Denmark Copper Pipe and Tube Market experienced significant growth from 2021 to 2022, peaking at a market size of €31.44 million in 2023, reflecting a robust CAGR of 14.51% and 21.50% for 2021 and 2022, respectively. However, this upward trend reversed sharply in 2024, with the market size declining to €25.21 million, resulting in a negative CAGR of -7.47% from 2022 to 2024. The forecasted period from 2025 to 2030 indicates a continued decline, with projected market sizes decreasing to €14.82 million by 2030 and a CAGR of -8.47%. This downturn can be attributed to factors such as reduced construction activity and increased competition from alternative materials. While no specific upcoming projects are highlighted, macroeconomic pressures, including inflation and supply chain disruptions, are anticipated to further challenge the market's recovery in the coming years.
Denmark Copper Pipe And Tube Market: Production & Trade Performance (2019-2025)
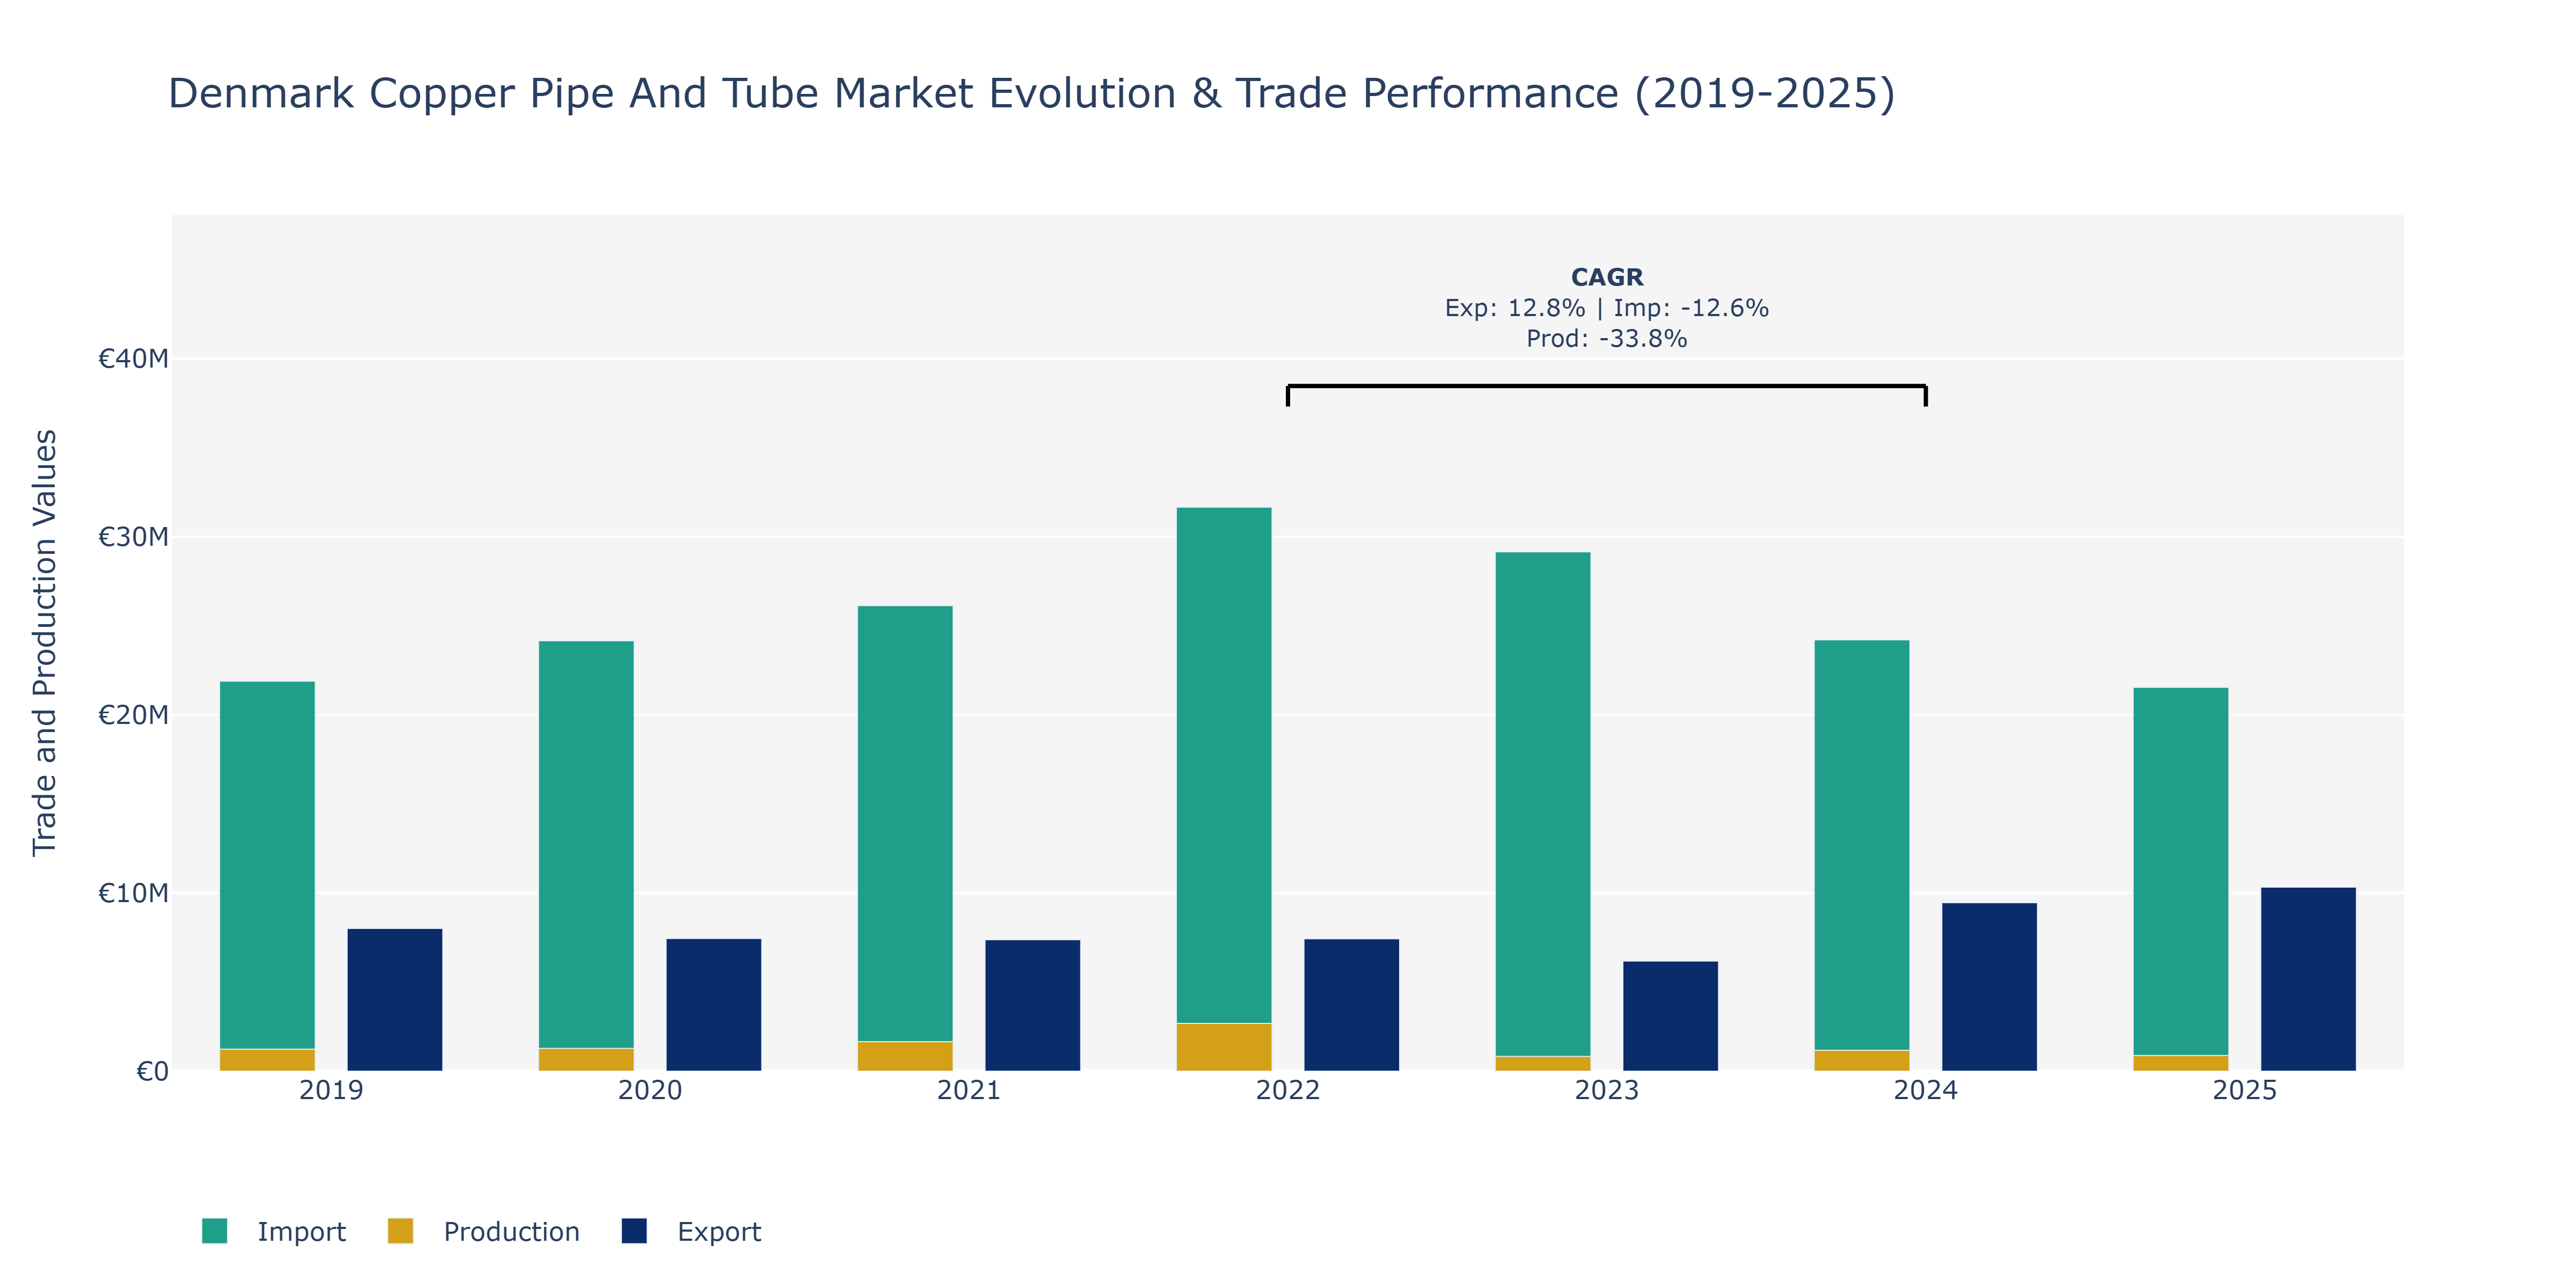
In the Denmark Copper Pipe and Tube Market, exports experienced fluctuations over the years, starting at €8.01 million in 2019, decreasing to €6.18 million in 2023, before rebounding to €10.34 million in 2025. Imports followed a similar trend, peaking at €26.14 million in 2022 and decreasing to €21.55 million in 2025. Production levels also varied, rising from €1.23 million in 2019 to a peak of €2.68 million in 2022, and then dropping to €0.88 million in 2025. The market saw a decline in production and imports possibly due to a shift in consumer preferences towards alternative materials or technological advancements in piping systems. The fluctuation in exports could be attributed to changes in global demand, currency exchange rates, or trade policies affecting the market dynamics. These trends highlight the market's responsiveness to both domestic and international factors, emphasizing the need for strategic planning and market adaptability.
Key Highlights of the Report:
- Denmark Copper Pipe and Tube Market Outlook
- Market Size of Denmark Copper Pipe and Tube Market, 2025
- Forecast of Denmark Copper Pipe and Tube Market, 2032
- Historical Data and Forecast of Denmark Copper Pipe and Tube Revenues & Volume for the Period 2022 - 2032F
- Denmark Copper Pipe and Tube Market Trend Evolution
- Denmark Copper Pipe and Tube Market Drivers and Challenges
- Denmark Copper Pipe and Tube Price Trends
- Denmark Copper Pipe and Tube Porter`s Five Forces
- Denmark Copper Pipe and Tube Industry Life Cycle
- Historical Data and Forecast of Denmark Copper Pipe and Tube Market Revenues & Volume By End Use for the Period 2022 - 2032F
- Historical Data and Forecast of Denmark Copper Pipe and Tube Market Revenues & Volume By HVAC for the Period 2022 - 2032F
- Historical Data and Forecast of Denmark Copper Pipe and Tube Market Revenues & Volume By Industrial Heat Exchanger for the Period 2022 - 2032F
- Historical Data and Forecast of Denmark Copper Pipe and Tube Market Revenues & Volume By Plumbing for the Period 2022 - 2032F
- Historical Data and Forecast of Denmark Copper Pipe and Tube Market Revenues & Volume By Electrical for the Period 2022 - 2032F
- Historical Data and Forecast of Denmark Copper Pipe and Tube Market Revenues & Volume By Others for the Period 2022 - 2032F
- Denmark Copper Pipe and Tube Import Export Trade Statistics
- Market Opportunity Assessment By End Use
- Denmark Copper Pipe and Tube Top Companies Market Share
- Denmark Copper Pipe and Tube Competitive Benchmarking By Technical and Operational Parameters
- Denmark Copper Pipe and Tube Company Profiles
- Denmark Copper Pipe and Tube Key Strategic Recommendations
Frequently Asked Questions About the Market Study (FAQs):
6Wresearch actively monitors the Denmark Copper Pipe and Tube Market and publishes its comprehensive annual report, highlighting emerging trends, growth drivers, revenue analysis, and forecast outlook. Our insights help businesses to make data-backed strategic decisions with ongoing market dynamics. Our analysts track relevent industries related to the Denmark Copper Pipe and Tube Market, allowing our clients with actionable intelligence and reliable forecasts tailored to emerging regional needs.
Yes, we provide customisation as per your requirements. To learn more, feel free to contact us on sales@6wresearch.com
1 Executive Summary |
2 Introduction |
2.1 Key Highlights of the Report |
2.2 Report Description |
2.3 Market Scope & Segmentation |
2.4 Research Methodology |
2.5 Assumptions |
3 Denmark Copper Pipe and Tube Market Overview |
3.1 Denmark Country Macro Economic Indicators |
3.2 Denmark Copper Pipe and Tube Market Revenues & Volume, 2022 & 2032F |
3.3 Denmark Copper Pipe and Tube Market - Industry Life Cycle |
3.4 Denmark Copper Pipe and Tube Market - Porter's Five Forces |
3.5 Denmark Copper Pipe and Tube Market Revenues & Volume Share, By End Use, 2022 & 2032F |
4 Denmark Copper Pipe and Tube Market Dynamics |
4.1 Impact Analysis |
4.2 Market Drivers |
4.2.1 Increasing demand for copper pipes and tubes in the construction industry due to their durability and reliability. |
4.2.2 Growing investments in infrastructure projects in Denmark, leading to higher demand for copper pipes and tubes. |
4.2.3 Rising awareness about the benefits of using copper pipes and tubes in plumbing systems, boosting market growth. |
4.3 Market Restraints |
4.3.1 Fluctuating copper prices impacting the overall cost of copper pipes and tubes. |
4.3.2 Competition from alternative materials such as plastic and steel pipes affecting market share. |
4.3.3 Environmental concerns and regulations encouraging the shift towards sustainable and eco-friendly materials, potentially limiting the growth of copper pipes and tubes market. |
5 Denmark Copper Pipe and Tube Market Trends |
6 Denmark Copper Pipe and Tube Market Segmentations |
6.1 Denmark Copper Pipe and Tube Market, By End Use |
6.1.1 Overview and Analysis |
6.1.2 Denmark Copper Pipe and Tube Market Revenues & Volume, By HVAC , 2022 - 2032F |
6.1.3 Denmark Copper Pipe and Tube Market Revenues & Volume, By Industrial Heat Exchanger , 2022 - 2032F |
6.1.4 Denmark Copper Pipe and Tube Market Revenues & Volume, By Plumbing , 2022 - 2032F |
6.1.5 Denmark Copper Pipe and Tube Market Revenues & Volume, By Electrical , 2022 - 2032F |
6.1.6 Denmark Copper Pipe and Tube Market Revenues & Volume, By Others, 2022 - 2032F |
7 Denmark Copper Pipe and Tube Market Import-Export Trade Statistics |
7.1 Denmark Copper Pipe and Tube Market Export to Major Countries |
7.2 Denmark Copper Pipe and Tube Market Imports from Major Countries |
8 Denmark Copper Pipe and Tube Market Key Performance Indicators |
8.1 Average selling price of copper pipes and tubes in the market. |
8.2 Number of new construction projects utilizing copper pipes and tubes. |
8.3 Adoption rate of copper pipes and tubes in residential and commercial plumbing installations. |
9 Denmark Copper Pipe and Tube Market - Opportunity Assessment |
9.1 Denmark Copper Pipe and Tube Market Opportunity Assessment, By End Use, 2022 & 2032F |
10 Denmark Copper Pipe and Tube Market - Competitive Landscape |
10.1 Denmark Copper Pipe and Tube Market Revenue Share, By Companies, 2025 |
10.2 Denmark Copper Pipe and Tube Market Competitive Benchmarking, By Operating and Technical Parameters |
11 Company Profiles |
12 Recommendations | 13 Disclaimer |
Export potential assessment - trade Analytics for 2030
Export potential enables firms to identify high-growth global markets with greater confidence by combining advanced trade intelligence with a structured quantitative methodology. The framework analyzes emerging demand trends and country-level import patterns while integrating macroeconomic and trade datasets such as GDP and population forecasts, bilateral import–export flows, tariff structures, elasticity differentials between developed and developing economies, geographic distance, and import demand projections. Using weighted trade values from 2020–2024 as the base period to project country-to-country export potential for 2030, these inputs are operationalized through calculated drivers such as gravity model parameters, tariff impact factors, and projected GDP per-capita growth. Through an analysis of hidden potentials, demand hotspots, and market conditions that are most favorable to success, this method enables firms to focus on target countries, maximize returns, and global expansion with data, backed by accuracy.
By factoring in the projected importer demand gap that is currently unmet and could be potential opportunity, it identifies the potential for the Exporter (Country) among 190 countries, against the general trade analysis, which identifies the biggest importer or exporter.
To discover high-growth global markets and optimize your business strategy:
Click Here
Pricing
- Single User License$ 1,995
- Department License$ 2,400
- Site License$ 3,120
- Global License$ 3,795

Search
Thought Leadership and Analyst Meet


Our Clients
Latest Reports
- China Electric Appliance Rental Market (2026-2032) | Trends, Revenue, Growth, Challenges, Size, Value, Outlook, Pricing, Strategy, Insights, Restraints, segmentation, Companies, Investment Opportunities, Analysis, Demand, Drivers, Competition, Forecast, Share
- Chile Electric Appliance Rental Market (2026-2032) | Outlook, Competition, Drivers, Strategy, Revenue, Analysis, Value, Pricing, Restraints, Size, Demand, Share, Growth, Forecast, Challenges, Insights, Investment Opportunities, Companies, Trends, segmentation
- Cambodia Electric Appliance Rental Market (2026-2032) | Companies, Analysis, Restraints, Pricing, Insights, Challenges, Outlook, Strategy, Forecast, Trends, Competition, Value, Revenue, Investment Opportunities, segmentation, Drivers, Size, Demand, Growth, Share
- Brazil Electric Appliance Rental Market (2026-2032) | Revenue, Strategy, Forecast, Companies, segmentation, Competition, Size, Investment Opportunities, Pricing, Restraints, Outlook, Challenges, Analysis, Drivers, Value, Demand, Insights, Trends, Growth, Share
- Bangladesh Electric Appliance Rental Market (2026-2032) | Drivers, Forecast, Investment Opportunities, Strategy, Insights, Demand, Challenges, Outlook, Trends, Competition, Value, Revenue, Size, Pricing, Analysis, Companies, Restraints, segmentation, Share, Growth
- Bahrain Electric Appliance Rental Market (2026-2032) | Outlook, Size, Competition, Restraints, Drivers, Value, Trends, Investment Opportunities, Insights, Forecast, Revenue, Strategy, Growth, Share, Demand, Analysis, Challenges, Companies, segmentation, Pricing
- Azerbaijan Electric Appliance Rental Market (2026-2032) | Trends, Investment Opportunities, Restraints, Insights, Strategy, Competition, Value, Growth, Demand, Drivers, Analysis, Forecast, Size, Share, Outlook, segmentation, Pricing, Challenges, Revenue, Companies
- Australia Electric Appliance Rental Market (2026-2032) | Challenges, Restraints, Forecast, Demand, Size, Competition, Pricing, Investment Opportunities, Revenue, Trends, Drivers, Growth, Outlook, Analysis, Strategy, Value, segmentation, Insights, Companies, Share
- Argentina Electric Appliance Rental Market (2026-2032) | Growth, Trends, Insights, Outlook, Forecast, Size, Drivers, Analysis, Restraints, Challenges, Share, Revenue, Investment Opportunities, Strategy, Demand, Value, Companies, segmentation, Competition, Pricing
- Algeria Electric Appliance Rental Market (2026-2032) | Share, Size, Value, Strategy, Competition, Outlook, Challenges, Companies, Trends, Pricing, Insights, Forecast, Investment Opportunities, Revenue, Growth, Restraints, segmentation, Analysis, Demand, Drivers
Industry Events and Analyst Meet

HIMTEX 2026

India Refining Summit 2026

India EV Show 2026

EV tech India Expo 2026

Auto Tech Asia 2026
Whitepaper
- Middle East & Africa Commercial Security Market Click here to view more.
- Middle East & Africa Fire Safety Systems & Equipment Market Click here to view more.
- GCC Drone Market Click here to view more.
- Middle East Lighting Fixture Market Click here to view more.
- GCC Physical & Perimeter Security Market Click here to view more.
6WResearch In News
- Doha a strategic location for EV manufacturing hub: IPA Qatar
- Demand for luxury TVs surging in the GCC, says Samsung
- Empowering Growth: The Thriving Journey of Bangladesh’s Cable Industry
- Demand for luxury TVs surging in the GCC, says Samsung
- Video call with a traditional healer? Once unthinkable, it’s now common in South Africa
- Intelligent Buildings To Smooth GCC’s Path To Net Zero