Denmark Copper Sulfate Market (2026-2032) | Competition, Supply, Forecast, Share, Pricing Analysis, Companies, Segments, Trends, Drivers, Competitive, Demand, Investment Trends, Outlook, Strategic Insights, Industry, Restraints, Strategy, Growth, Segmentation, Size, Challenges, Analysis, Consumer Insights, Revenue, Opportunities, Value
Market Forecast By Form (Powder, Liquid, Crystals, Others), By Grade (Technical Grade, Industrial Grade, Feed Grade, Others), By Application (Fungicide, Electroplating, Feed Additive, Others), By End-Use (Agriculture, Electronics, Animal Nutrition, Others), By Distribution Channel (Direct Sales, Distributors, Online Sales, Others) And Competitive Landscape
| Product Code: ETC11761688 | Publication Date: Apr 2025 | Updated Date: Apr 2026 | Product Type: Market Research Report | |
| Publisher: 6Wresearch | No. of Pages: 65 | No. of Figures: 34 | No. of Tables: 19 | |
Denmark Copper Sulfate Market Size (2020-2030)
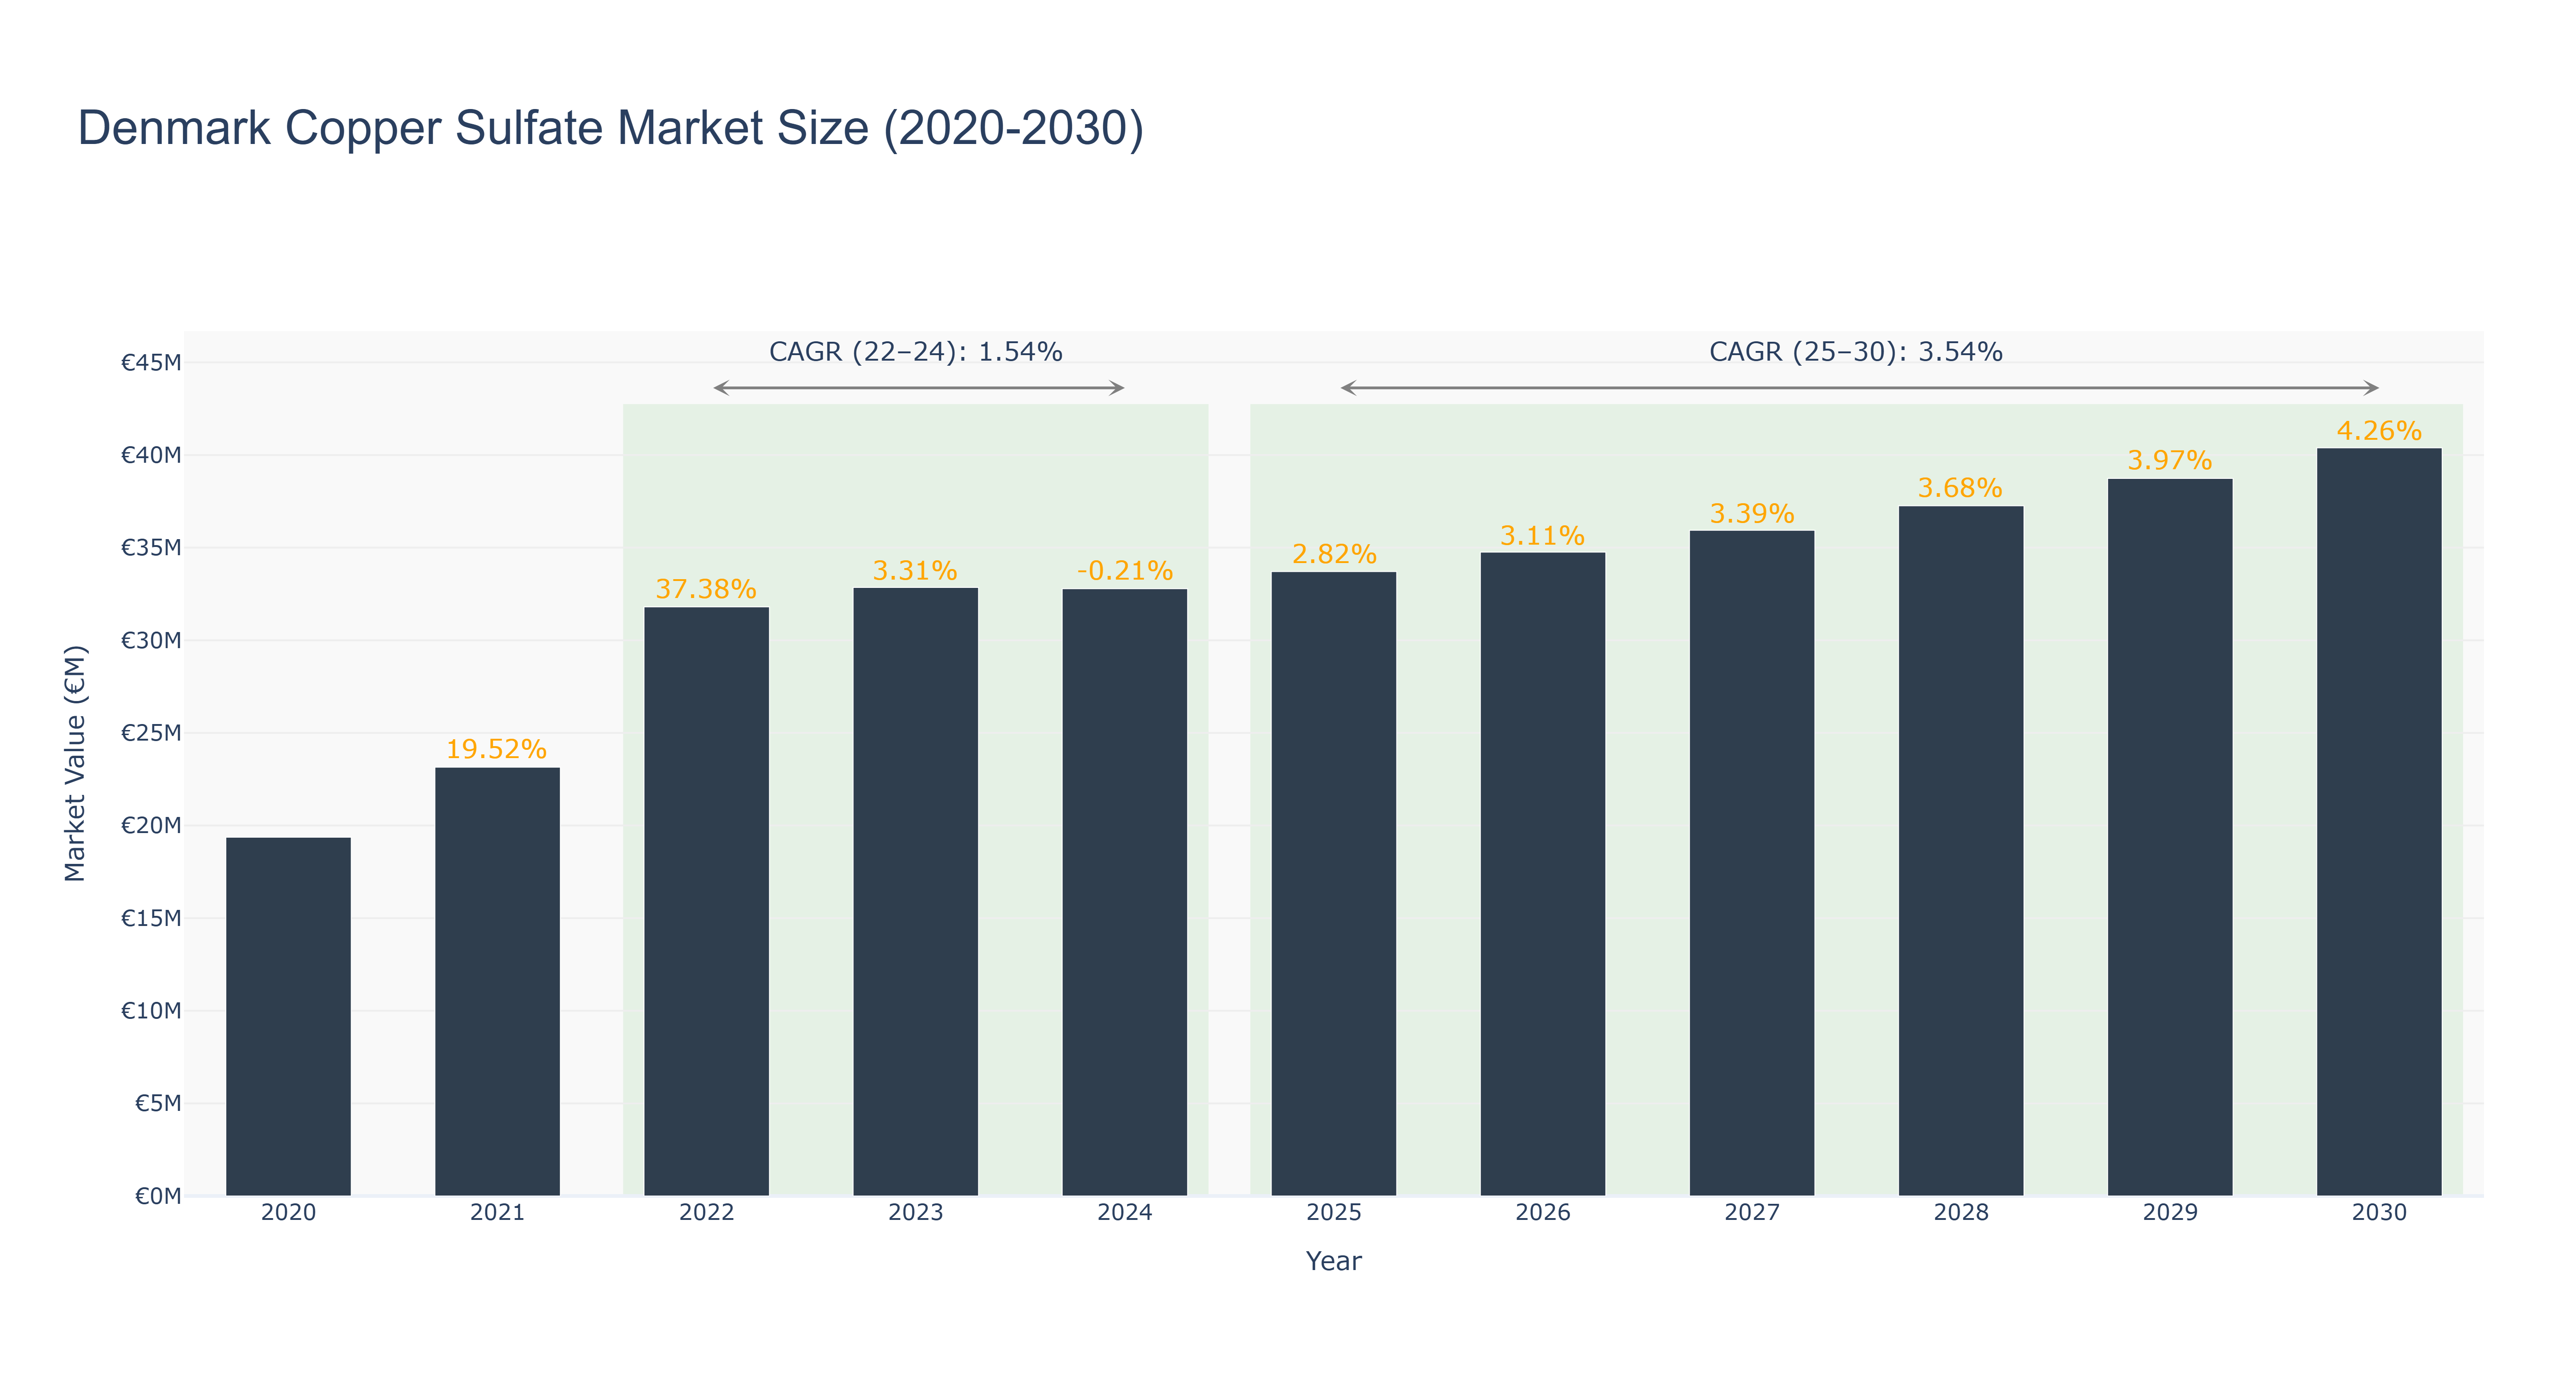
The Denmark Copper Sulfate Market experienced significant fluctuations between 2020 and 2024, peaking at €31.80 million in 2022, with a remarkable growth rate of 37.38% that year. However, the growth trajectory began to taper off, with a modest increase of only 3.31% in 2023 and a slight decline of -0.21% in 2024, resulting in a CAGR of 1.54% for the actual period from 2022 to 2024. Looking ahead, the market is projected to recover, with a forecasted CAGR of 3.54% from 2025 to 2030, ultimately reaching €40.39 million by 2030. This positive outlook may be driven by increasing applications in agriculture and industrial sectors, alongside a potential rise in environmental regulations promoting sustainable practices. Continued investment in innovative production methods and the expansion of copper sulfate applications are expected to bolster market growth in the coming years.
Denmark Copper Sulfate Market: Production & Trade Performance (2019-2025)
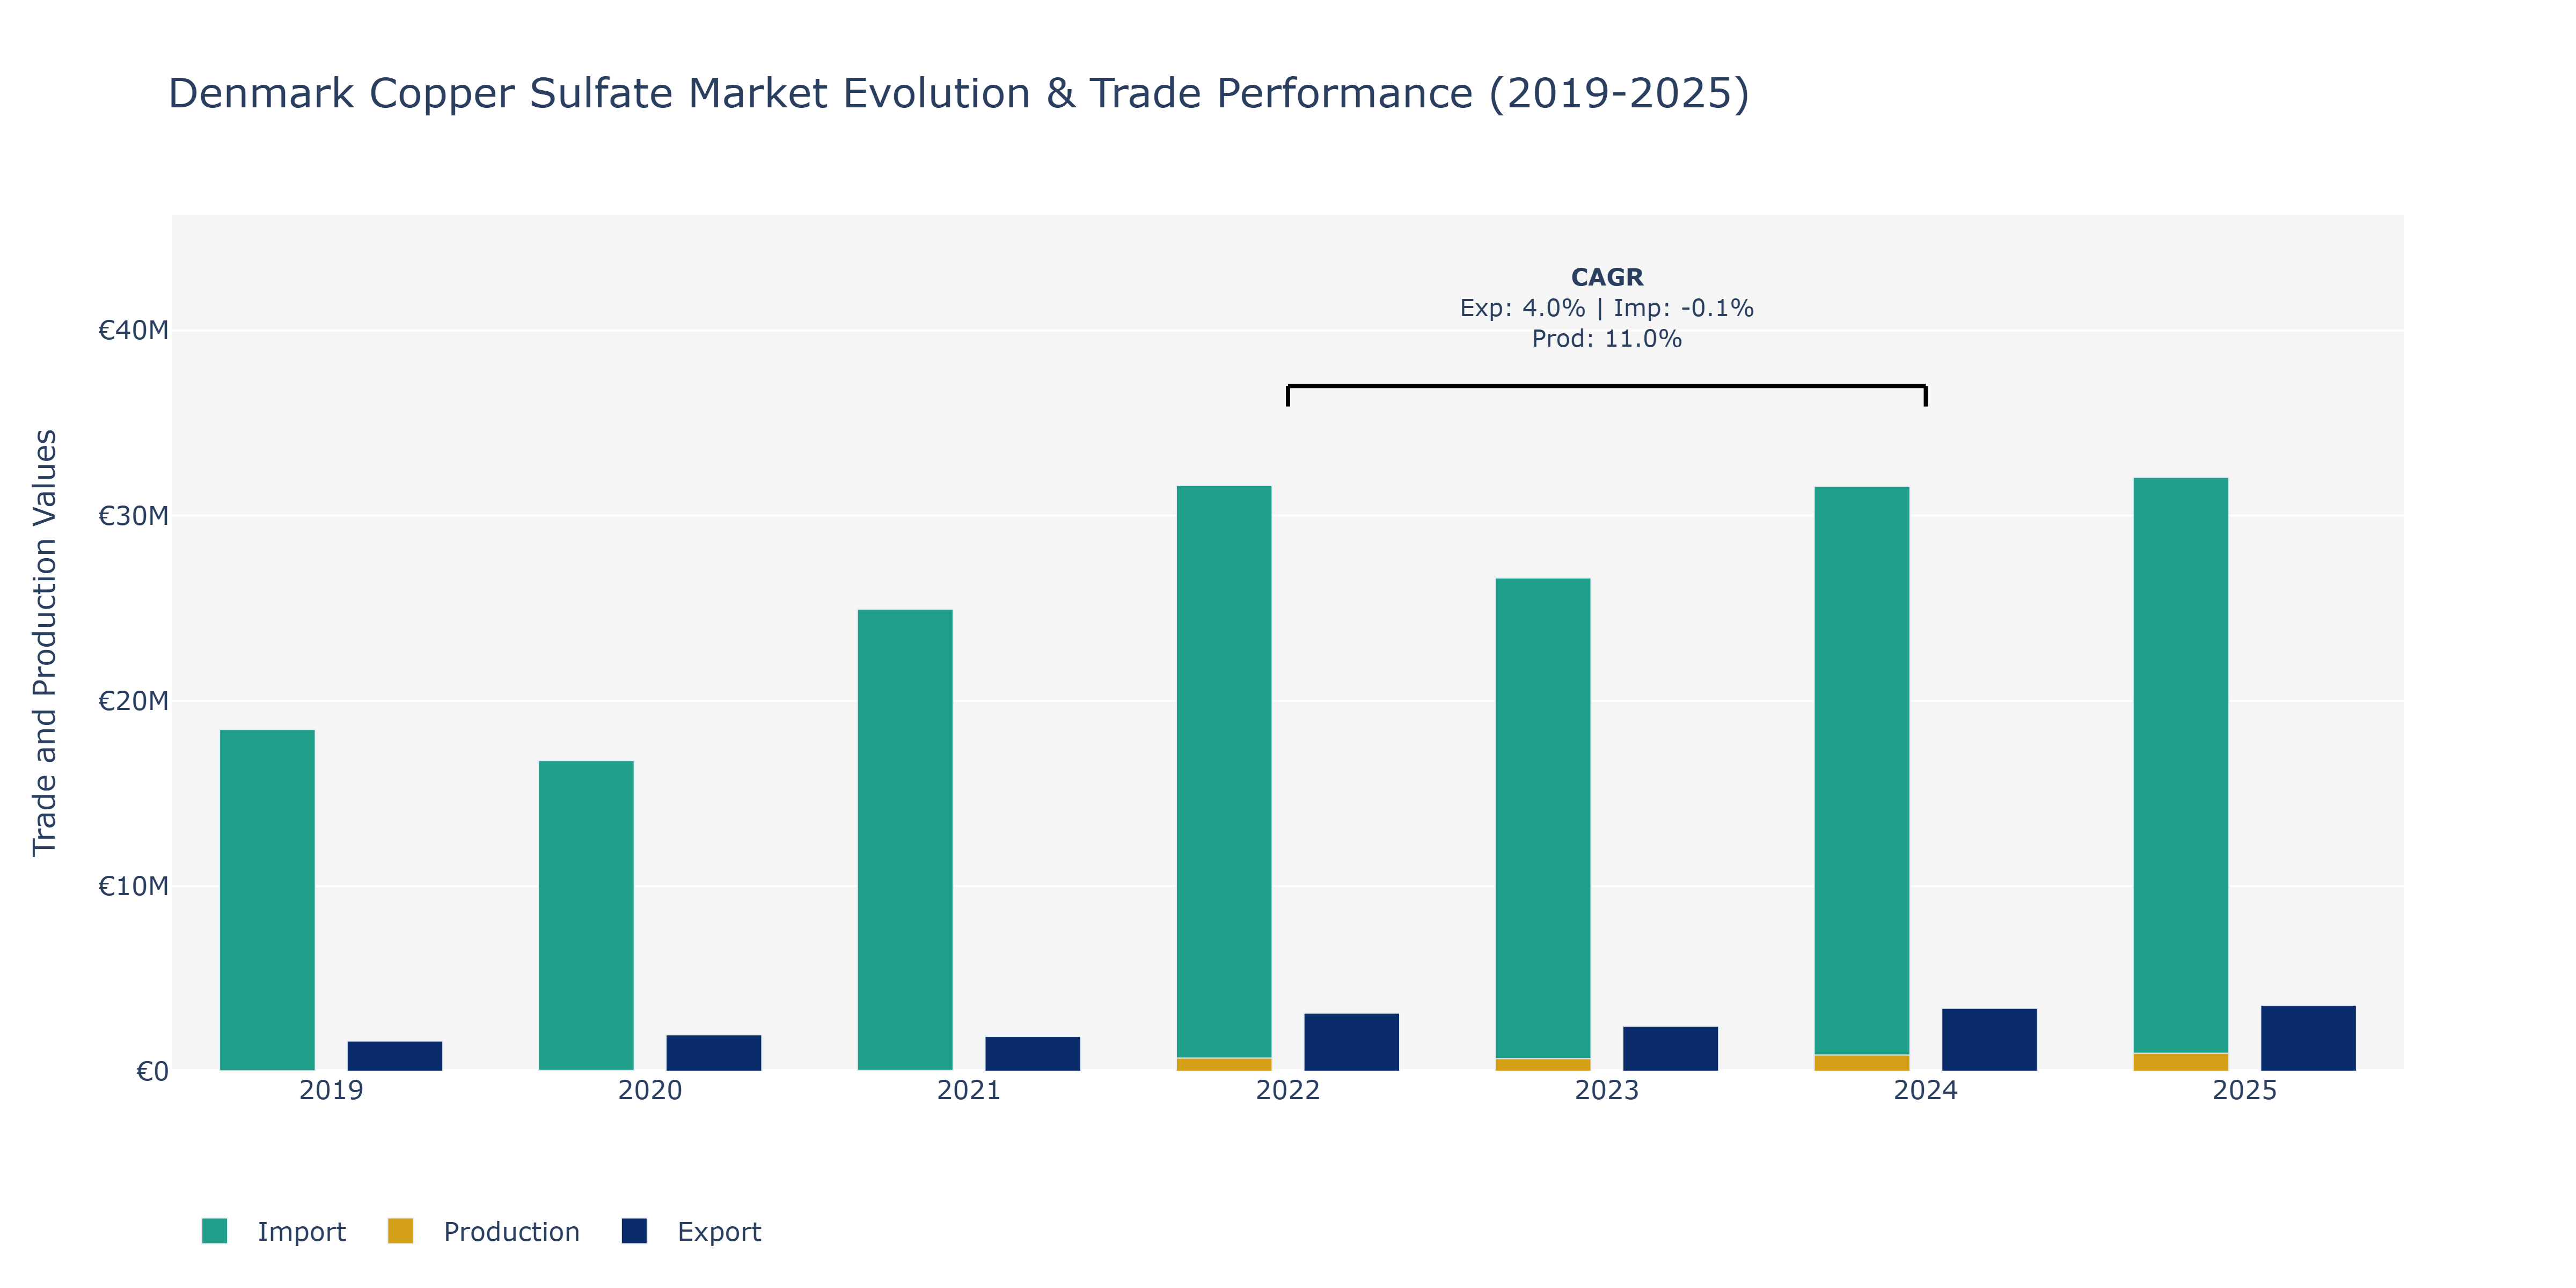
In the Denmark Copper Sulfate Market, from 2019 to 2025, exports demonstrated a steady growth trajectory. Starting at €1.63 million in 2019, exports increased annually, reaching €3.56 million in 2025. The consistent rise can be attributed to increased global demand for copper sulfate, driven by its diverse applications in agriculture, mining, and manufacturing industries. On the other hand, imports fluctuated notably over the same period, with a peak of €31.61 million in 2022 and a slight decrease to €32.07 million in 2025. This fluctuation may be influenced by changing international trade dynamics, currency exchange rates, and evolving supply chain strategies. Production, which stood at €24.51 million in 2019, surged significantly to €968.24 million by 2025. This exponential growth can be linked to technological advancements, boosting production efficiency and capacity in the copper sulfate industry.
Key Highlights of the Report:
- Denmark Copper Sulfate Market Outlook
- Market Size of Denmark Copper Sulfate Market, 2025
- Forecast of Denmark Copper Sulfate Market, 2032
- Historical Data and Forecast of Denmark Copper Sulfate Revenues & Volume for the Period 2022 - 2032F
- Denmark Copper Sulfate Market Trend Evolution
- Denmark Copper Sulfate Market Drivers and Challenges
- Denmark Copper Sulfate Price Trends
- Denmark Copper Sulfate Porter's Five Forces
- Denmark Copper Sulfate Industry Life Cycle
- Historical Data and Forecast of Denmark Copper Sulfate Market Revenues & Volume By Form for the Period 2022 - 2032F
- Historical Data and Forecast of Denmark Copper Sulfate Market Revenues & Volume By Powder for the Period 2022 - 2032F
- Historical Data and Forecast of Denmark Copper Sulfate Market Revenues & Volume By Liquid for the Period 2022 - 2032F
- Historical Data and Forecast of Denmark Copper Sulfate Market Revenues & Volume By Crystals for the Period 2022 - 2032F
- Historical Data and Forecast of Denmark Copper Sulfate Market Revenues & Volume By Others for the Period 2022 - 2032F
- Historical Data and Forecast of Denmark Copper Sulfate Market Revenues & Volume By Grade for the Period 2022 - 2032F
- Historical Data and Forecast of Denmark Copper Sulfate Market Revenues & Volume By Technical Grade for the Period 2022 - 2032F
- Historical Data and Forecast of Denmark Copper Sulfate Market Revenues & Volume By Industrial Grade for the Period 2022 - 2032F
- Historical Data and Forecast of Denmark Copper Sulfate Market Revenues & Volume By Feed Grade for the Period 2022 - 2032F
- Historical Data and Forecast of Denmark Copper Sulfate Market Revenues & Volume By Others for the Period 2022 - 2032F
- Historical Data and Forecast of Denmark Copper Sulfate Market Revenues & Volume By Application for the Period 2022 - 2032F
- Historical Data and Forecast of Denmark Copper Sulfate Market Revenues & Volume By Fungicide for the Period 2022 - 2032F
- Historical Data and Forecast of Denmark Copper Sulfate Market Revenues & Volume By Electroplating for the Period 2022 - 2032F
- Historical Data and Forecast of Denmark Copper Sulfate Market Revenues & Volume By Feed Additive for the Period 2022 - 2032F
- Historical Data and Forecast of Denmark Copper Sulfate Market Revenues & Volume By Others for the Period 2022 - 2032F
- Historical Data and Forecast of Denmark Copper Sulfate Market Revenues & Volume By End-Use for the Period 2022 - 2032F
- Historical Data and Forecast of Denmark Copper Sulfate Market Revenues & Volume By Agriculture for the Period 2022 - 2032F
- Historical Data and Forecast of Denmark Copper Sulfate Market Revenues & Volume By Electronics for the Period 2022 - 2032F
- Historical Data and Forecast of Denmark Copper Sulfate Market Revenues & Volume By Animal Nutrition for the Period 2022 - 2032F
- Historical Data and Forecast of Denmark Copper Sulfate Market Revenues & Volume By Others for the Period 2022 - 2032F
- Historical Data and Forecast of Denmark Copper Sulfate Market Revenues & Volume By Distribution Channel for the Period 2022 - 2032F
- Historical Data and Forecast of Denmark Copper Sulfate Market Revenues & Volume By Direct Sales for the Period 2022 - 2032F
- Historical Data and Forecast of Denmark Copper Sulfate Market Revenues & Volume By Distributors for the Period 2022 - 2032F
- Historical Data and Forecast of Denmark Copper Sulfate Market Revenues & Volume By Online Sales for the Period 2022 - 2032F
- Historical Data and Forecast of Denmark Copper Sulfate Market Revenues & Volume By Others for the Period 2022 - 2032F
- Denmark Copper Sulfate Import Export Trade Statistics
- Market Opportunity Assessment By Form
- Market Opportunity Assessment By Grade
- Market Opportunity Assessment By Application
- Market Opportunity Assessment By End-Use
- Market Opportunity Assessment By Distribution Channel
- Denmark Copper Sulfate Top Companies Market Share
- Denmark Copper Sulfate Competitive Benchmarking By Technical and Operational Parameters
- Denmark Copper Sulfate Company Profiles
- Denmark Copper Sulfate Key Strategic Recommendations
Frequently Asked Questions About the Market Study (FAQs):
6Wresearch actively monitors the Denmark Copper Sulfate Market and publishes its comprehensive annual report, highlighting emerging trends, growth drivers, revenue analysis, and forecast outlook. Our insights help businesses to make data-backed strategic decisions with ongoing market dynamics. Our analysts track relevent industries related to the Denmark Copper Sulfate Market, allowing our clients with actionable intelligence and reliable forecasts tailored to emerging regional needs.
Yes, we provide customisation as per your requirements. To learn more, feel free to contact us on sales@6wresearch.com
1 Executive Summary |
2 Introduction |
2.1 Key Highlights of the Report |
2.2 Report Description |
2.3 Market Scope & Segmentation |
2.4 Research Methodology |
2.5 Assumptions |
3 Denmark Copper Sulfate Market Overview |
3.1 Denmark Country Macro Economic Indicators |
3.2 Denmark Copper Sulfate Market Revenues & Volume, 2022 & 2032F |
3.3 Denmark Copper Sulfate Market - Industry Life Cycle |
3.4 Denmark Copper Sulfate Market - Porter's Five Forces |
3.5 Denmark Copper Sulfate Market Revenues & Volume Share, By Form, 2022 & 2032F |
3.6 Denmark Copper Sulfate Market Revenues & Volume Share, By Grade, 2022 & 2032F |
3.7 Denmark Copper Sulfate Market Revenues & Volume Share, By Application, 2022 & 2032F |
3.8 Denmark Copper Sulfate Market Revenues & Volume Share, By End-Use, 2022 & 2032F |
3.9 Denmark Copper Sulfate Market Revenues & Volume Share, By Distribution Channel, 2022 & 2032F |
4 Denmark Copper Sulfate Market Dynamics |
4.1 Impact Analysis |
4.2 Market Drivers |
4.2.1 Increasing demand for copper sulfate in agriculture for crop protection and animal nutrition |
4.2.2 Growing adoption of copper sulfate in the manufacturing industry for metal plating and surface treatment |
4.2.3 Rising awareness about the benefits of copper sulfate in water treatment and aquaculture |
4.3 Market Restraints |
4.3.1 Fluctuating prices of raw materials impacting the production cost of copper sulfate |
4.3.2 Stringent regulations regarding the environmental impact of copper sulfate usage |
4.3.3 Competition from alternative products and substitutes in various applications |
5 Denmark Copper Sulfate Market Trends |
6 Denmark Copper Sulfate Market, By Types |
6.1 Denmark Copper Sulfate Market, By Form |
6.1.1 Overview and Analysis |
6.1.2 Denmark Copper Sulfate Market Revenues & Volume, By Form, 2022 - 2032F |
6.1.3 Denmark Copper Sulfate Market Revenues & Volume, By Powder, 2022 - 2032F |
6.1.4 Denmark Copper Sulfate Market Revenues & Volume, By Liquid, 2022 - 2032F |
6.1.5 Denmark Copper Sulfate Market Revenues & Volume, By Crystals, 2022 - 2032F |
6.1.6 Denmark Copper Sulfate Market Revenues & Volume, By Others, 2022 - 2032F |
6.2 Denmark Copper Sulfate Market, By Grade |
6.2.1 Overview and Analysis |
6.2.2 Denmark Copper Sulfate Market Revenues & Volume, By Technical Grade, 2022 - 2032F |
6.2.3 Denmark Copper Sulfate Market Revenues & Volume, By Industrial Grade, 2022 - 2032F |
6.2.4 Denmark Copper Sulfate Market Revenues & Volume, By Feed Grade, 2022 - 2032F |
6.2.5 Denmark Copper Sulfate Market Revenues & Volume, By Others, 2022 - 2032F |
6.3 Denmark Copper Sulfate Market, By Application |
6.3.1 Overview and Analysis |
6.3.2 Denmark Copper Sulfate Market Revenues & Volume, By Fungicide, 2022 - 2032F |
6.3.3 Denmark Copper Sulfate Market Revenues & Volume, By Electroplating, 2022 - 2032F |
6.3.4 Denmark Copper Sulfate Market Revenues & Volume, By Feed Additive, 2022 - 2032F |
6.3.5 Denmark Copper Sulfate Market Revenues & Volume, By Others, 2022 - 2032F |
6.4 Denmark Copper Sulfate Market, By End-Use |
6.4.1 Overview and Analysis |
6.4.2 Denmark Copper Sulfate Market Revenues & Volume, By Agriculture, 2022 - 2032F |
6.4.3 Denmark Copper Sulfate Market Revenues & Volume, By Electronics, 2022 - 2032F |
6.4.4 Denmark Copper Sulfate Market Revenues & Volume, By Animal Nutrition, 2022 - 2032F |
6.4.5 Denmark Copper Sulfate Market Revenues & Volume, By Others, 2022 - 2032F |
6.5 Denmark Copper Sulfate Market, By Distribution Channel |
6.5.1 Overview and Analysis |
6.5.2 Denmark Copper Sulfate Market Revenues & Volume, By Direct Sales, 2022 - 2032F |
6.5.3 Denmark Copper Sulfate Market Revenues & Volume, By Distributors, 2022 - 2032F |
6.5.4 Denmark Copper Sulfate Market Revenues & Volume, By Online Sales, 2022 - 2032F |
6.5.5 Denmark Copper Sulfate Market Revenues & Volume, By Others, 2022 - 2032F |
7 Denmark Copper Sulfate Market Import-Export Trade Statistics |
7.1 Denmark Copper Sulfate Market Export to Major Countries |
7.2 Denmark Copper Sulfate Market Imports from Major Countries |
8 Denmark Copper Sulfate Market Key Performance Indicators |
8.1 Environmental impact index measuring the sustainability practices in copper sulfate production |
8.2 Adoption rate of copper sulfate in new application areas |
8.3 Research and development investment in improving the efficiency and effectiveness of copper sulfate applications |
9 Denmark Copper Sulfate Market - Opportunity Assessment |
9.1 Denmark Copper Sulfate Market Opportunity Assessment, By Form, 2022 & 2032F |
9.2 Denmark Copper Sulfate Market Opportunity Assessment, By Grade, 2022 & 2032F |
9.3 Denmark Copper Sulfate Market Opportunity Assessment, By Application, 2022 & 2032F |
9.4 Denmark Copper Sulfate Market Opportunity Assessment, By End-Use, 2022 & 2032F |
9.5 Denmark Copper Sulfate Market Opportunity Assessment, By Distribution Channel, 2022 & 2032F |
10 Denmark Copper Sulfate Market - Competitive Landscape |
10.1 Denmark Copper Sulfate Market Revenue Share, By Companies, 2025 |
10.2 Denmark Copper Sulfate Market Competitive Benchmarking, By Operating and Technical Parameters |
11 Company Profiles |
12 Recommendations |
13 Disclaimer |
Global Go To Market Strategy - 2030
Export potential enables firms to identify high-growth global markets with greater confidence by combining advanced trade intelligence with a structured quantitative methodology. The framework analyzes emerging demand trends and country-level import patterns while integrating macroeconomic and trade datasets such as GDP and population forecasts, bilateral import–export flows, tariff structures, elasticity differentials between developed and developing economies, geographic distance, and import demand projections. Using weighted trade values from 2020–2024 as the base period to project country-to-country export potential for 2030, these inputs are operationalized through calculated drivers such as gravity model parameters, tariff impact factors, and projected GDP per-capita growth. Through an analysis of hidden potentials, demand hotspots, and market conditions that are most favorable to success, this method enables firms to focus on target countries, maximize returns, and global expansion with data, backed by accuracy.
By factoring in the projected importer demand gap that is currently unmet and could be potential opportunity, it identifies the potential for the Exporter (Country) among 190 countries, against the general trade analysis, which identifies the biggest importer or exporter.
To discover high-growth global markets and optimize your business strategy:
Click Here
Pricing
- Single User License$ 1,995
- Department License$ 2,400
- Site License$ 3,120
- Global License$ 3,795

Leadership Perspectives from Industry Events
Search
Thought Leadership and Analyst Meet


Our Clients
6WResearch In News
- Doha a strategic location for EV manufacturing hub: IPA Qatar
- Demand for luxury TVs surging in the GCC, says Samsung
- Empowering Growth: The Thriving Journey of Bangladesh’s Cable Industry
- Demand for luxury TVs surging in the GCC, says Samsung
- Video call with a traditional healer? Once unthinkable, it’s now common in South Africa
- Intelligent Buildings To Smooth GCC’s Path To Net Zero
Latest Reports
- Taiwan Airport Wireless Infrastructure Market (2026-2032)
- Vietnam Airport Wireless Infrastructure Market (2026-2032)
- Thailand Airport Wireless Infrastructure Market (2026-2032)
- South Korea Airport Wireless Infrastructure Market (2026-2032)
- Romania Airport Wireless Infrastructure Market (2026-2032)
- Qatar Airport Wireless Infrastructure Market (2026-2032)
- Philippines Airport Wireless Infrastructure Market (2026-2032)
- Japan Airport Wireless Infrastructure Market (2026-2032)
- Taiwan Airport Winter Services Market (2026-2032)
- Vietnam Airport Winter Services Market (2026-2032)
Industry Events and Analyst Meet

HIMTEX 2026

India Refining Summit 2026

India EV Show 2026

EV tech India Expo 2026

Auto Tech Asia 2026
Whitepaper
- Middle East & Africa Commercial Security Market Click here to view more.
- Middle East & Africa Fire Safety Systems & Equipment Market Click here to view more.
- GCC Drone Market Click here to view more.
- Middle East Lighting Fixture Market Click here to view more.
- GCC Physical & Perimeter Security Market Click here to view more.