Denmark Cumene Market (2025-2031) | Share, Growth, Trends, Revenue, Analysis, Segmentation, Industry, Outlook, Companies, Size, Value & Forecast
Market Forecast By Type (Zeloite, Solid Phosphoric Acid, Aluminum Chloride), By Application (Phenol, Acetone, Others) And Competitive Landscape
| Product Code: ETC5263234 | Publication Date: Nov 2023 | Updated Date: Dec 2025 | Product Type: Market Research Report | |
| Publisher: 6Wresearch | Author: Bhawna Singh | No. of Pages: 60 | No. of Figures: 30 | No. of Tables: 5 |
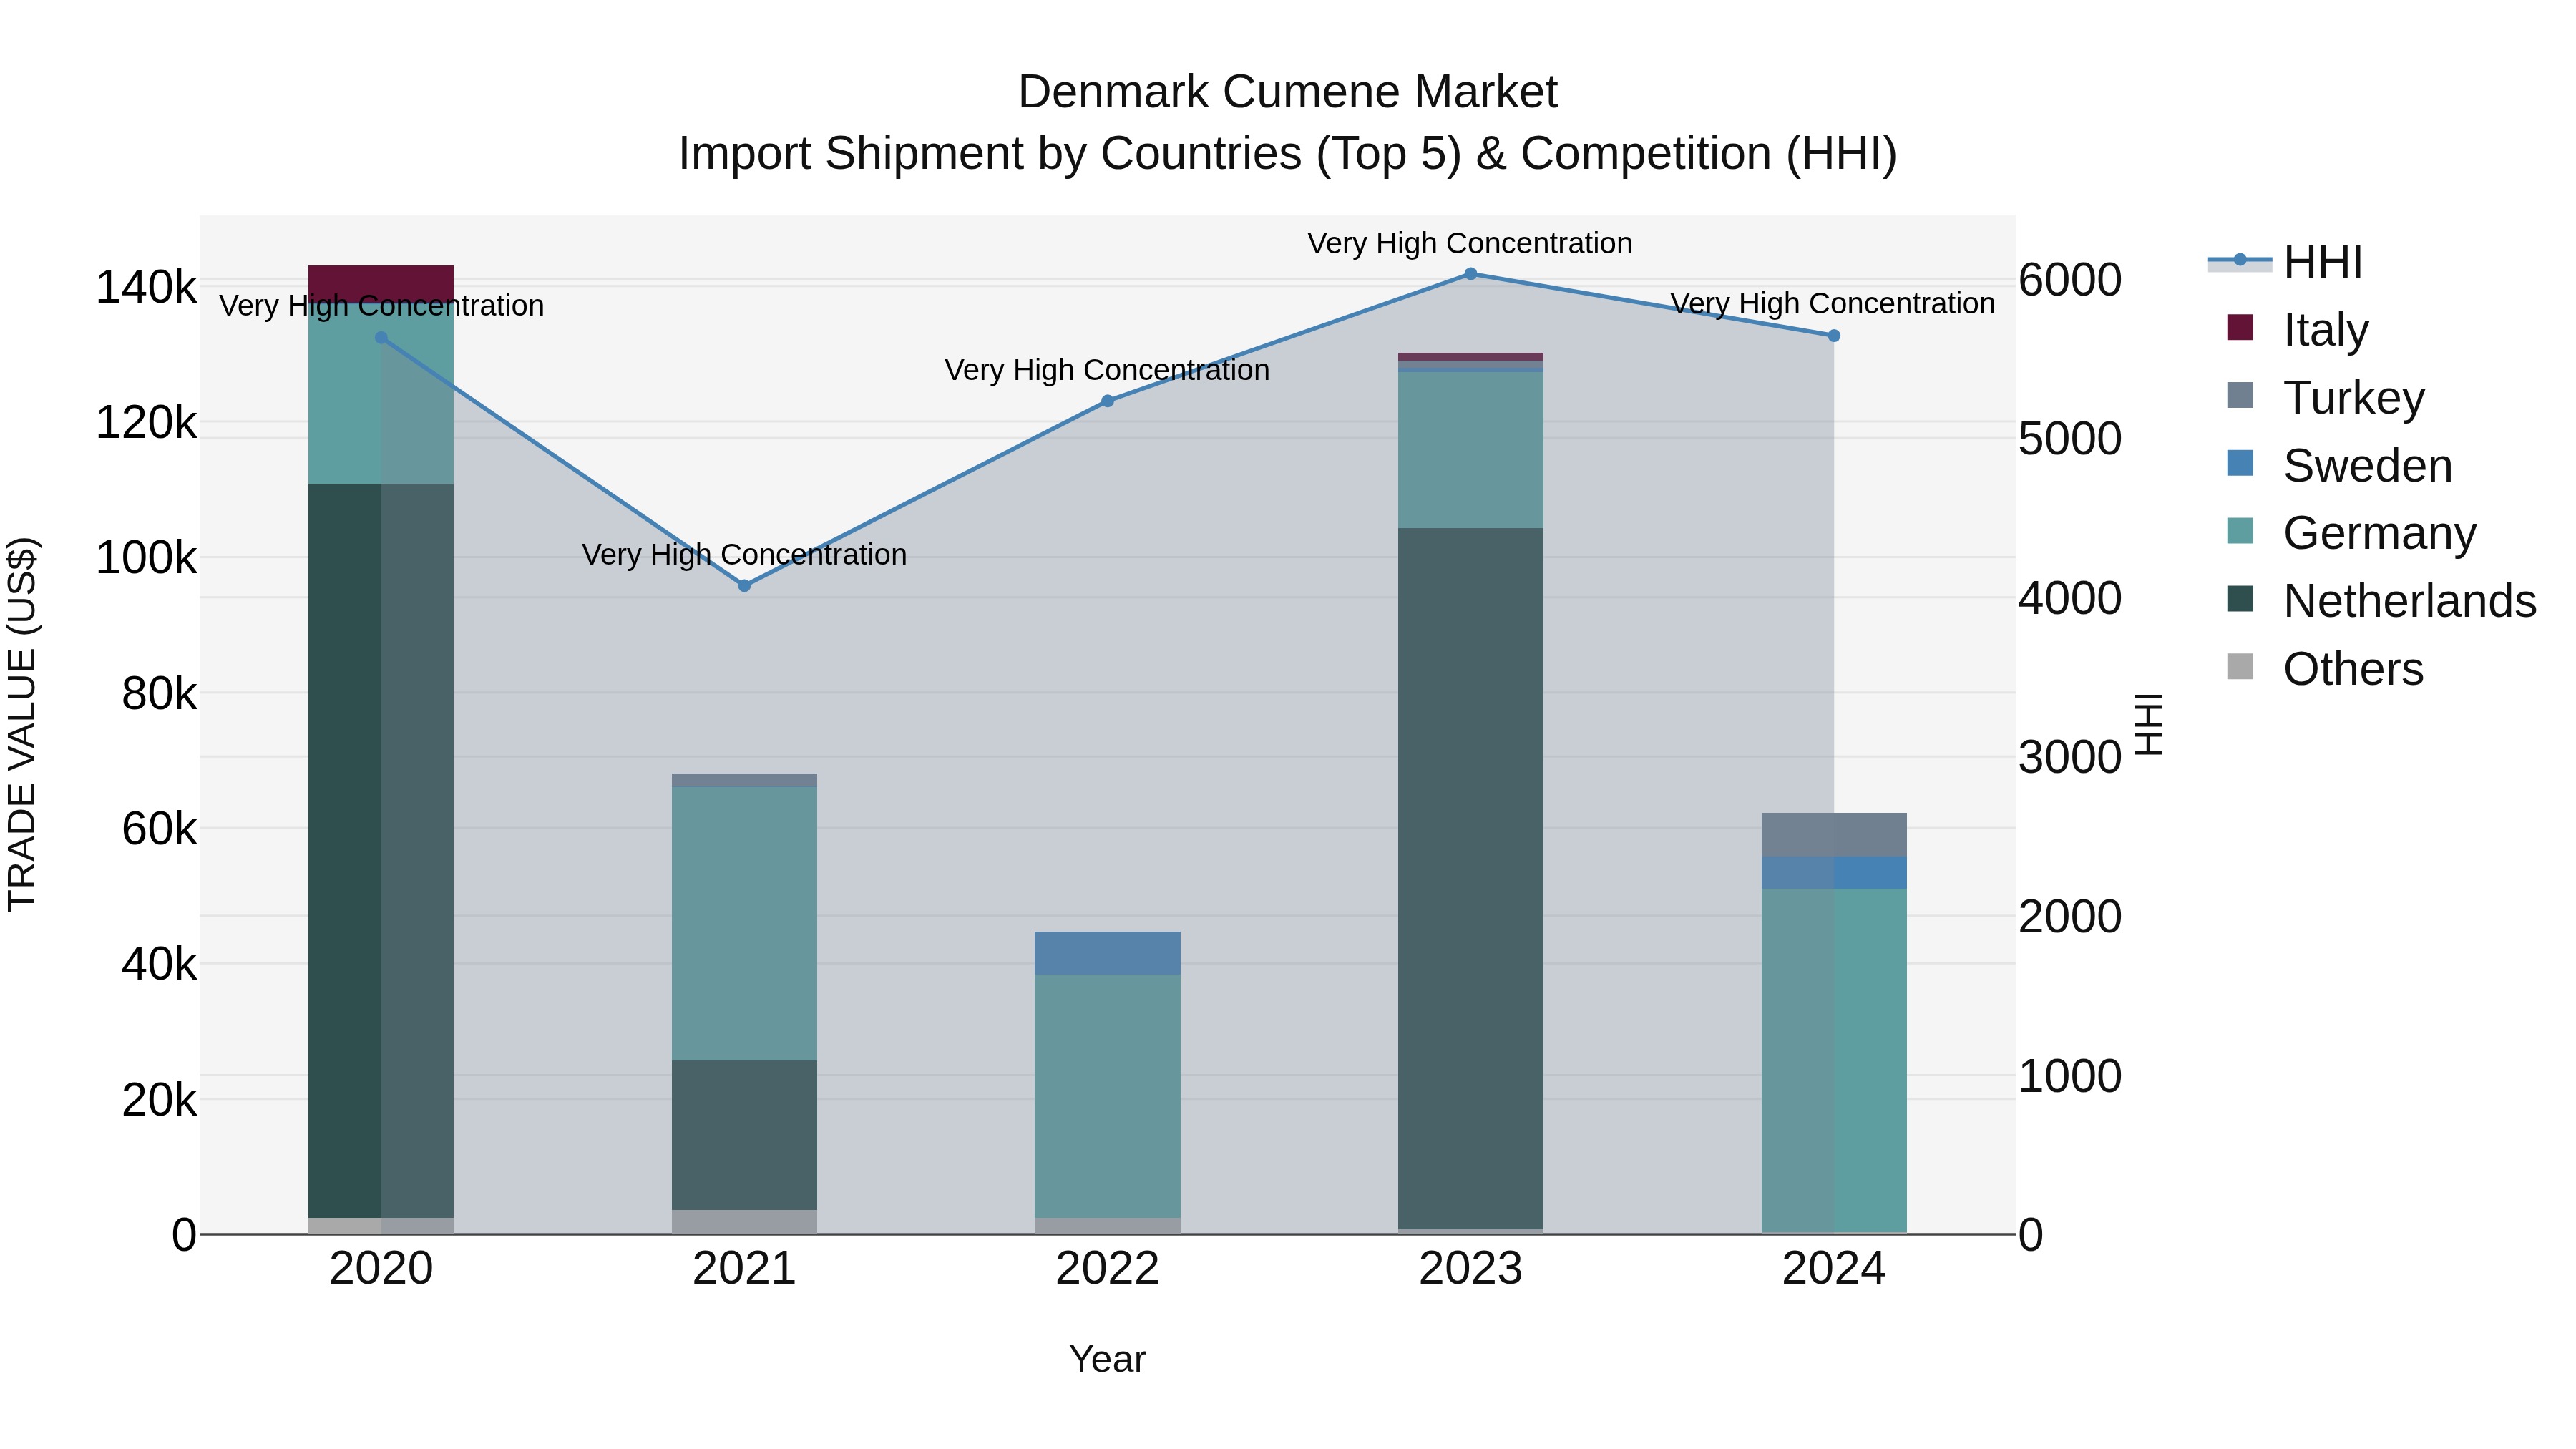
Denmark Cumene Market Top 5 Importing Countries and Market Competition (HHI) Analysis
Denmark cumene import market in 2024 continued to be dominated by a few key players, with Germany, Turkey, Sweden, Metropolitan France, and Belgium leading the way. The high Herfindahl-Hirschman Index (HHI) indicates a concentrated market structure. However, the market experienced a significant decline with a negative Compound Annual Growth Rate (CAGR) of -18.79% from 2020 to 2024. The growth rate in 2024 also saw a sharp decline of -52.21% compared to the previous year, reflecting a challenging environment for cumene imports into Denmark.
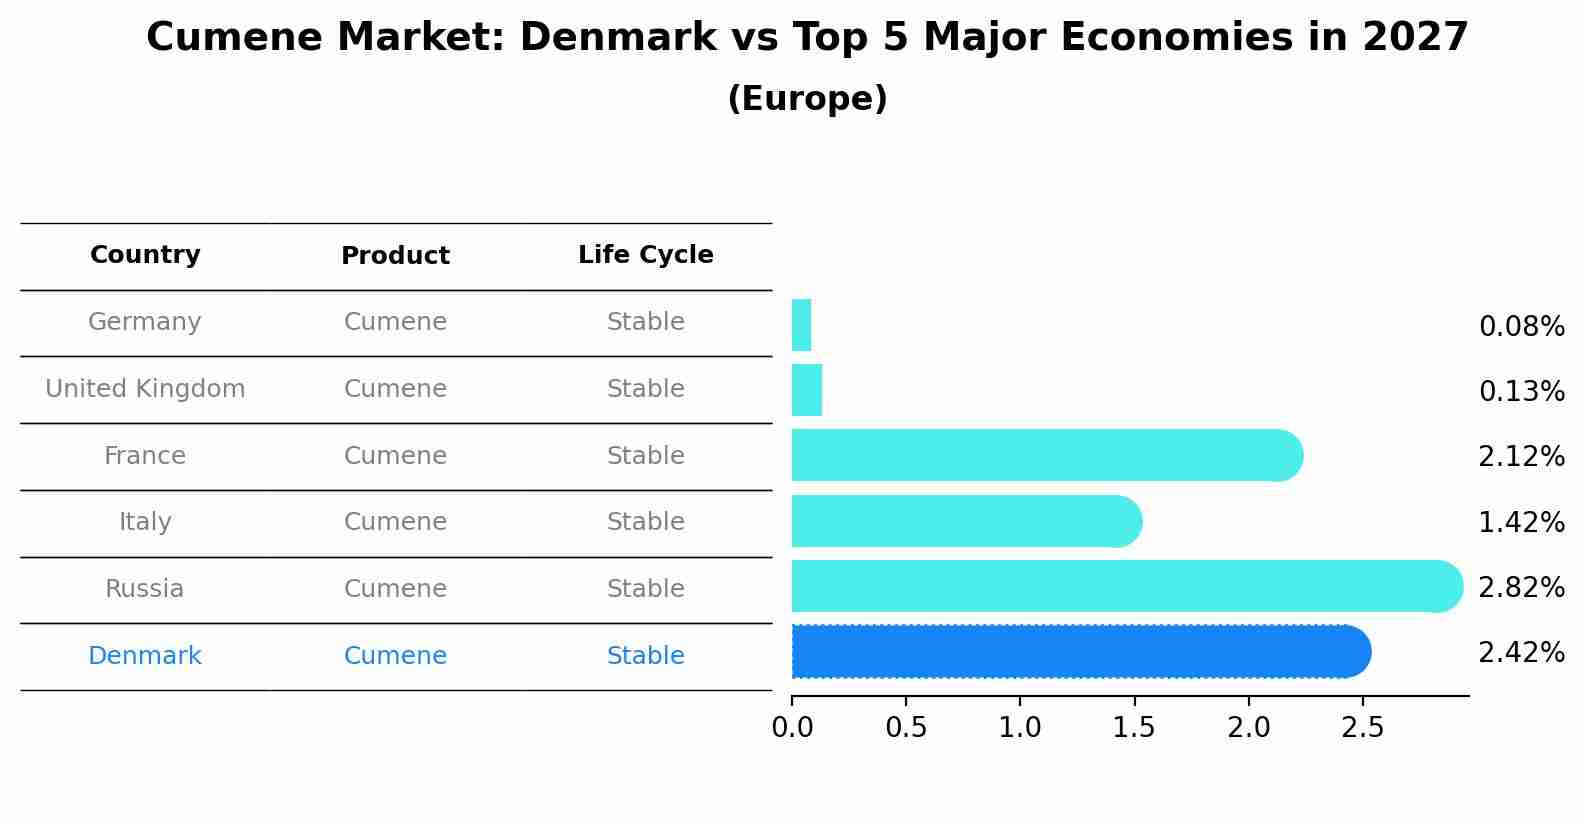
Cumene Market: Denmark vs Top 5 Major Economies in 2027 (Europe)
The Cumene market in Denmark is projected to grow at a stable growth rate of 2.42% by 2027, highlighting the country's increasing focus on advanced technologies within the Europe region, where Germany holds the dominant position, followed closely by United Kingdom, France, Italy and Russia, shaping overall regional demand.
Denmark Cumene Market Overview
The cumene market in Denmark is growing due to its applications in the production of chemicals, particularly phenol and acetone. Cumene is a key intermediate in the chemical industry, and the increasing demand for phenolic compounds in various applications is driving market growth. The rising need for sustainable and eco-friendly chemicals is also influencing the cumene market, as manufacturers seek alternatives to traditional petrochemical sources. As the chemical industry evolves, the cumene market is set for expansion.
Drivers of the market
The cumene market in Denmark is driven by its use in the production of phenol and acetone, which are key intermediates in the chemical industry. The growing demand for phenolic resins, plastics, and synthetic fibers is propelling the cumene market.
Challenges of the market
The Denmark Cumene Market is challenged by the volatility of raw material prices and environmental concerns regarding the production of chemicals like cumene. Compliance with strict regulations on chemical emissions adds to the cost burden for manufacturers.
Government Policy of the market
Government policies regarding the cumene market in Denmark focus on environmental safety and chemical management. Regulations that promote the responsible use and handling of chemicals drive demand for eco-friendly production practices. Furthermore, government initiatives supporting research into safer chemical alternatives align with Denmark`s commitment to reducing environmental impact and enhancing public safety.
Key Highlights of the Report:
- Denmark Cumene Market Outlook
- Market Size of Denmark Cumene Market, 2024
- Forecast of Denmark Cumene Market, 2031
- Historical Data and Forecast of Denmark Cumene Revenues & Volume for the Period 2021-2031
- Denmark Cumene Market Trend Evolution
- Denmark Cumene Market Drivers and Challenges
- Denmark Cumene Price Trends
- Denmark Cumene Porter`s Five Forces
- Denmark Cumene Industry Life Cycle
- Historical Data and Forecast of Denmark Cumene Market Revenues & Volume By Type for the Period 2021-2031
- Historical Data and Forecast of Denmark Cumene Market Revenues & Volume By Zeloite for the Period 2021-2031
- Historical Data and Forecast of Denmark Cumene Market Revenues & Volume By Solid Phosphoric Acid for the Period 2021-2031
- Historical Data and Forecast of Denmark Cumene Market Revenues & Volume By Aluminum Chloride for the Period 2021-2031
- Historical Data and Forecast of Denmark Cumene Market Revenues & Volume By Application for the Period 2021-2031
- Historical Data and Forecast of Denmark Cumene Market Revenues & Volume By Phenol for the Period 2021-2031
- Historical Data and Forecast of Denmark Cumene Market Revenues & Volume By Acetone for the Period 2021-2031
- Historical Data and Forecast of Denmark Cumene Market Revenues & Volume By Others for the Period 2021-2031
- Denmark Cumene Import Export Trade Statistics
- Market Opportunity Assessment By Type
- Market Opportunity Assessment By Application
- Denmark Cumene Top Companies Market Share
- Denmark Cumene Competitive Benchmarking By Technical and Operational Parameters
- Denmark Cumene Company Profiles
- Denmark Cumene Key Strategic Recommendations
Frequently Asked Questions About the Market Study (FAQs):
6Wresearch actively monitors the Denmark Cumene Market and publishes its comprehensive annual report, highlighting emerging trends, growth drivers, revenue analysis, and forecast outlook. Our insights help businesses to make data-backed strategic decisions with ongoing market dynamics. Our analysts track relevent industries related to the Denmark Cumene Market, allowing our clients with actionable intelligence and reliable forecasts tailored to emerging regional needs.
Yes, we provide customisation as per your requirements. To learn more, feel free to contact us on sales@6wresearch.com
1 Executive Summary |
2 Introduction |
2.1 Key Highlights of the Report |
2.2 Report Description |
2.3 Market Scope & Segmentation |
2.4 Research Methodology |
2.5 Assumptions |
3 Denmark Cumene Market Overview |
3.1 Denmark Country Macro Economic Indicators |
3.2 Denmark Cumene Market Revenues & Volume, 2021 & 2031F |
3.3 Denmark Cumene Market - Industry Life Cycle |
3.4 Denmark Cumene Market - Porter's Five Forces |
3.5 Denmark Cumene Market Revenues & Volume Share, By Type, 2021 & 2031F |
3.6 Denmark Cumene Market Revenues & Volume Share, By Application, 2021 & 2031F |
4 Denmark Cumene Market Dynamics |
4.1 Impact Analysis |
4.2 Market Drivers |
4.2.1 Increasing demand for phenol and acetone, which are major derivatives of cumene, in various industries such as pharmaceuticals, plastics, and electronics. |
4.2.2 Growing focus on sustainable practices and bio-based chemicals, where bio-cumene can provide a competitive edge in the market. |
4.2.3 Technological advancements leading to enhanced production efficiency and cost-effectiveness in the cumene manufacturing process. |
4.3 Market Restraints |
4.3.1 Volatility in crude oil prices impacting the cost of raw materials required for cumene production. |
4.3.2 Regulatory challenges related to environmental concerns and emissions control, leading to compliance costs for manufacturers. |
4.3.3 Intense competition from alternative products and substitutes in the market, affecting the market share of cumene. |
5 Denmark Cumene Market Trends |
6 Denmark Cumene Market Segmentations |
6.1 Denmark Cumene Market, By Type |
6.1.1 Overview and Analysis |
6.1.2 Denmark Cumene Market Revenues & Volume, By Zeloite, 2021-2031F |
6.1.3 Denmark Cumene Market Revenues & Volume, By Solid Phosphoric Acid, 2021-2031F |
6.1.4 Denmark Cumene Market Revenues & Volume, By Aluminum Chloride, 2021-2031F |
6.2 Denmark Cumene Market, By Application |
6.2.1 Overview and Analysis |
6.2.2 Denmark Cumene Market Revenues & Volume, By Phenol, 2021-2031F |
6.2.3 Denmark Cumene Market Revenues & Volume, By Acetone, 2021-2031F |
6.2.4 Denmark Cumene Market Revenues & Volume, By Others, 2021-2031F |
7 Denmark Cumene Market Import-Export Trade Statistics |
7.1 Denmark Cumene Market Export to Major Countries |
7.2 Denmark Cumene Market Imports from Major Countries |
8 Denmark Cumene Market Key Performance Indicators |
8.1 Percentage of bio-cumene adoption in the market. |
8.2 Average production cost per unit of cumene. |
8.3 Number of patents filed for innovative cumene production technologies. |
8.4 Percentage of recycled or sustainable raw materials used in cumene production. |
8.5 Research and development expenditure dedicated to improving cumene production processes. |
9 Denmark Cumene Market - Opportunity Assessment |
9.1 Denmark Cumene Market Opportunity Assessment, By Type, 2021 & 2031F |
9.2 Denmark Cumene Market Opportunity Assessment, By Application, 2021 & 2031F |
10 Denmark Cumene Market - Competitive Landscape |
10.1 Denmark Cumene Market Revenue Share, By Companies, 2024 |
10.2 Denmark Cumene Market Competitive Benchmarking, By Operating and Technical Parameters |
11 Company Profiles |
12 Recommendations | 13 Disclaimer |
Export potential assessment - trade Analytics for 2030
Export potential enables firms to identify high-growth global markets with greater confidence by combining advanced trade intelligence with a structured quantitative methodology. The framework analyzes emerging demand trends and country-level import patterns while integrating macroeconomic and trade datasets such as GDP and population forecasts, bilateral import–export flows, tariff structures, elasticity differentials between developed and developing economies, geographic distance, and import demand projections. Using weighted trade values from 2020–2024 as the base period to project country-to-country export potential for 2030, these inputs are operationalized through calculated drivers such as gravity model parameters, tariff impact factors, and projected GDP per-capita growth. Through an analysis of hidden potentials, demand hotspots, and market conditions that are most favorable to success, this method enables firms to focus on target countries, maximize returns, and global expansion with data, backed by accuracy.
By factoring in the projected importer demand gap that is currently unmet and could be potential opportunity, it identifies the potential for the Exporter (Country) among 190 countries, against the general trade analysis, which identifies the biggest importer or exporter.
To discover high-growth global markets and optimize your business strategy:
Click Here
Pricing
- Single User License$ 1,995
- Department License$ 2,400
- Site License$ 3,120
- Global License$ 3,795

Search
Thought Leadership and Analyst Meet


Our Clients
Latest Reports
- Philippines Polyhydroxybutyrate-co-Hydroxyvalerate Market (2026-2032) | Trends, Insights, Challenges, Restraints, Competition, Size, Value, Forecast, Pricing, Share, Outlook, Revenue, Investment Opportunities, Strategy, Drivers, Demand, Growth, segmentation, Analysis, Companies
- Peru Polyhydroxybutyrate-co-Hydroxyvalerate Market (2026-2032) | Growth, Demand, Challenges, Share, Trends, Analysis, Pricing, Investment Opportunities, Drivers, Value, Forecast, Competition, Size, Companies, Insights, Outlook, Restraints, segmentation, Revenue, Strategy
- Pakistan Polyhydroxybutyrate-co-Hydroxyvalerate Market (2026-2032) | Restraints, segmentation, Pricing, Forecast, Share, Strategy, Competition, Trends, Insights, Drivers, Challenges, Growth, Revenue, Outlook, Value, Investment Opportunities, Companies, Size, Analysis, Demand
- Oman Polyhydroxybutyrate-co-Hydroxyvalerate Market (2026-2032) | Drivers, segmentation, Insights, Competition, Pricing, Outlook, Size, Revenue, Challenges, Forecast, Analysis, Growth, Value, Share, Trends, Investment Opportunities, Strategy, Restraints, Companies, Demand
- Nigeria Polyhydroxybutyrate-co-Hydroxyvalerate Market (2026-2032) | Value, Investment Opportunities, Analysis, Revenue, Restraints, Pricing, Outlook, Competition, Demand, Growth, Forecast, Companies, Trends, Challenges, segmentation, Drivers, Insights, Share, Size, Strategy
- Nepal Polyhydroxybutyrate-co-Hydroxyvalerate Market (2026-2032) | Insights, Analysis, Drivers, Share, Revenue, Demand, segmentation, Investment Opportunities, Competition, Forecast, Growth, Pricing, Companies, Strategy, Trends, Restraints, Challenges, Outlook, Size, Value
- Myanmar Polyhydroxybutyrate-co-Hydroxyvalerate Market (2026-2032) | Outlook, Revenue, Strategy, Restraints, Drivers, segmentation, Share, Forecast, Competition, Insights, Growth, Pricing, Size, Demand, Value, Companies, Trends, Challenges, Investment Opportunities, Analysis
- Morocco Polyhydroxybutyrate-co-Hydroxyvalerate Market (2026-2032) | Outlook, Investment Opportunities, Restraints, Strategy, Forecast, Challenges, Drivers, Growth, Companies, segmentation, Trends, Size, Competition, Revenue, Demand, Insights, Share, Analysis, Value, Pricing
- Mexico Polyhydroxybutyrate-co-Hydroxyvalerate Market (2026-2032) | Size, Drivers, Outlook, Share, Strategy, Growth, Pricing, Challenges, Companies, Demand, Value, Investment Opportunities, Restraints, Trends, Forecast, segmentation, Analysis, Insights, Competition, Revenue
- Malaysia Polyhydroxybutyrate-co-Hydroxyvalerate Market (2026-2032) | Share, segmentation, Size, Companies, Analysis, Insights, Forecast, Value, Revenue, Drivers, Restraints, Challenges, Investment Opportunities, Trends, Competition, Strategy, Demand, Growth, Outlook, Pricing
Industry Events and Analyst Meet

HIMTEX 2026

India Refining Summit 2026

India EV Show 2026

EV tech India Expo 2026

Auto Tech Asia 2026
Whitepaper
- Middle East & Africa Commercial Security Market Click here to view more.
- Middle East & Africa Fire Safety Systems & Equipment Market Click here to view more.
- GCC Drone Market Click here to view more.
- Middle East Lighting Fixture Market Click here to view more.
- GCC Physical & Perimeter Security Market Click here to view more.
6WResearch In News
- Doha a strategic location for EV manufacturing hub: IPA Qatar
- Demand for luxury TVs surging in the GCC, says Samsung
- Empowering Growth: The Thriving Journey of Bangladesh’s Cable Industry
- Demand for luxury TVs surging in the GCC, says Samsung
- Video call with a traditional healer? Once unthinkable, it’s now common in South Africa
- Intelligent Buildings To Smooth GCC’s Path To Net Zero