Denmark Edible Oils Market (2026-2032) | Value, Outlook, Analysis, Revenue, Trends, Growth, Size, Industry, Forecast, Share, Segmentation & Companies
Market Forecast By Type (Palm Oil, Soybean Oil, Sunflower Oil, Rapeseed Oil, Olive Oil), By Packaging Type (Pouches, Jars, Cans, Bottles), By End Use (Domestic, Food Service , Industrial) And Competitive Landscape
| Product Code: ETC5791092 | Publication Date: Nov 2023 | Updated Date: Apr 2026 | Product Type: Market Research Report | |
| Publisher: 6Wresearch | Author: Ravi Bhandari | No. of Pages: 60 | No. of Figures: 30 | No. of Tables: 5 |
Denmark Edible Oils Market Size (2020-2030)
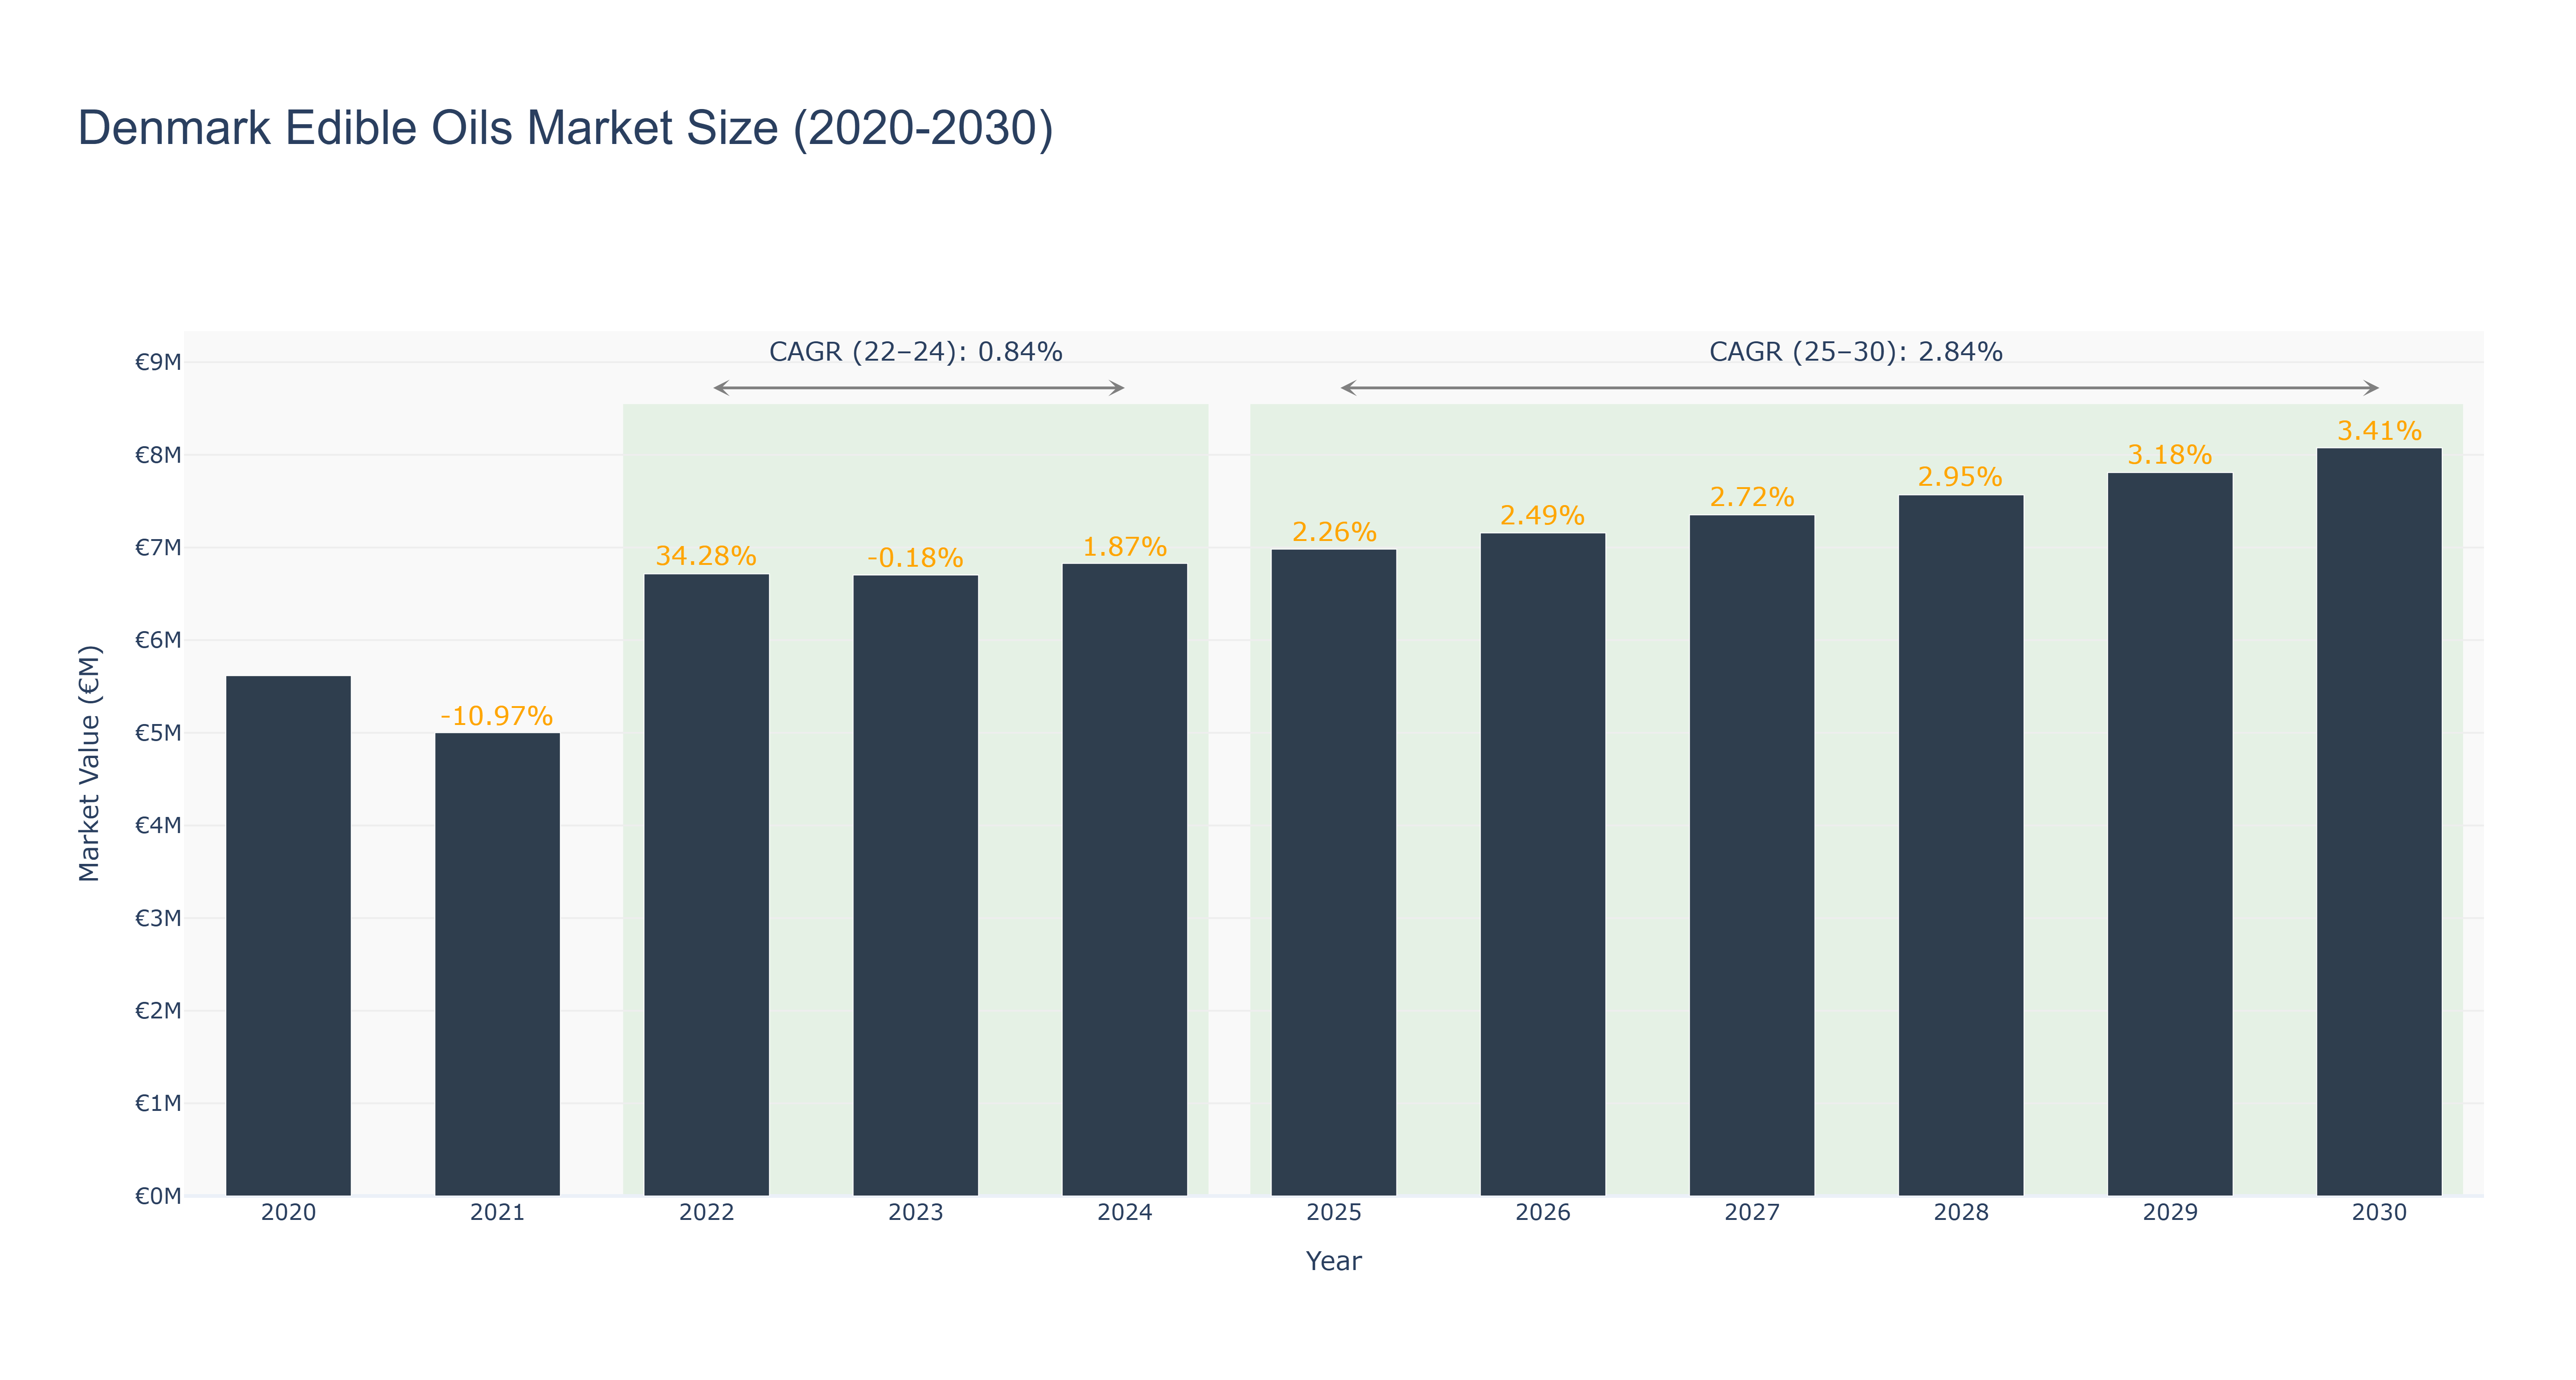
Denmark Edible Oils Market has shown a steady growth trajectory over the years. The peak market size of €8.08 million is forecasted for 2030, with an impressive CAGR of 2.83% from 2025 to 2030. The market experienced a slight dip in growth from 2022 to 2024, with a CAGR of 0.84%, attributed to fluctuating raw material prices and changing consumer preferences. However, from 2025 onwards, the market rebounded with a stronger CAGR, driven by increasing health consciousness among consumers and the rising popularity of plant-based diets. In the near future, Denmark is set to launch sustainable farming initiatives to enhance the quality and production of edible oils, aligning with the country's commitment to environmental sustainability. This strategic move is expected to further boost the market growth and solidify Denmark's position as a key player in the global edible oils market.
Denmark Edible Oils Market: Production & Trade Performance (2019-2025)
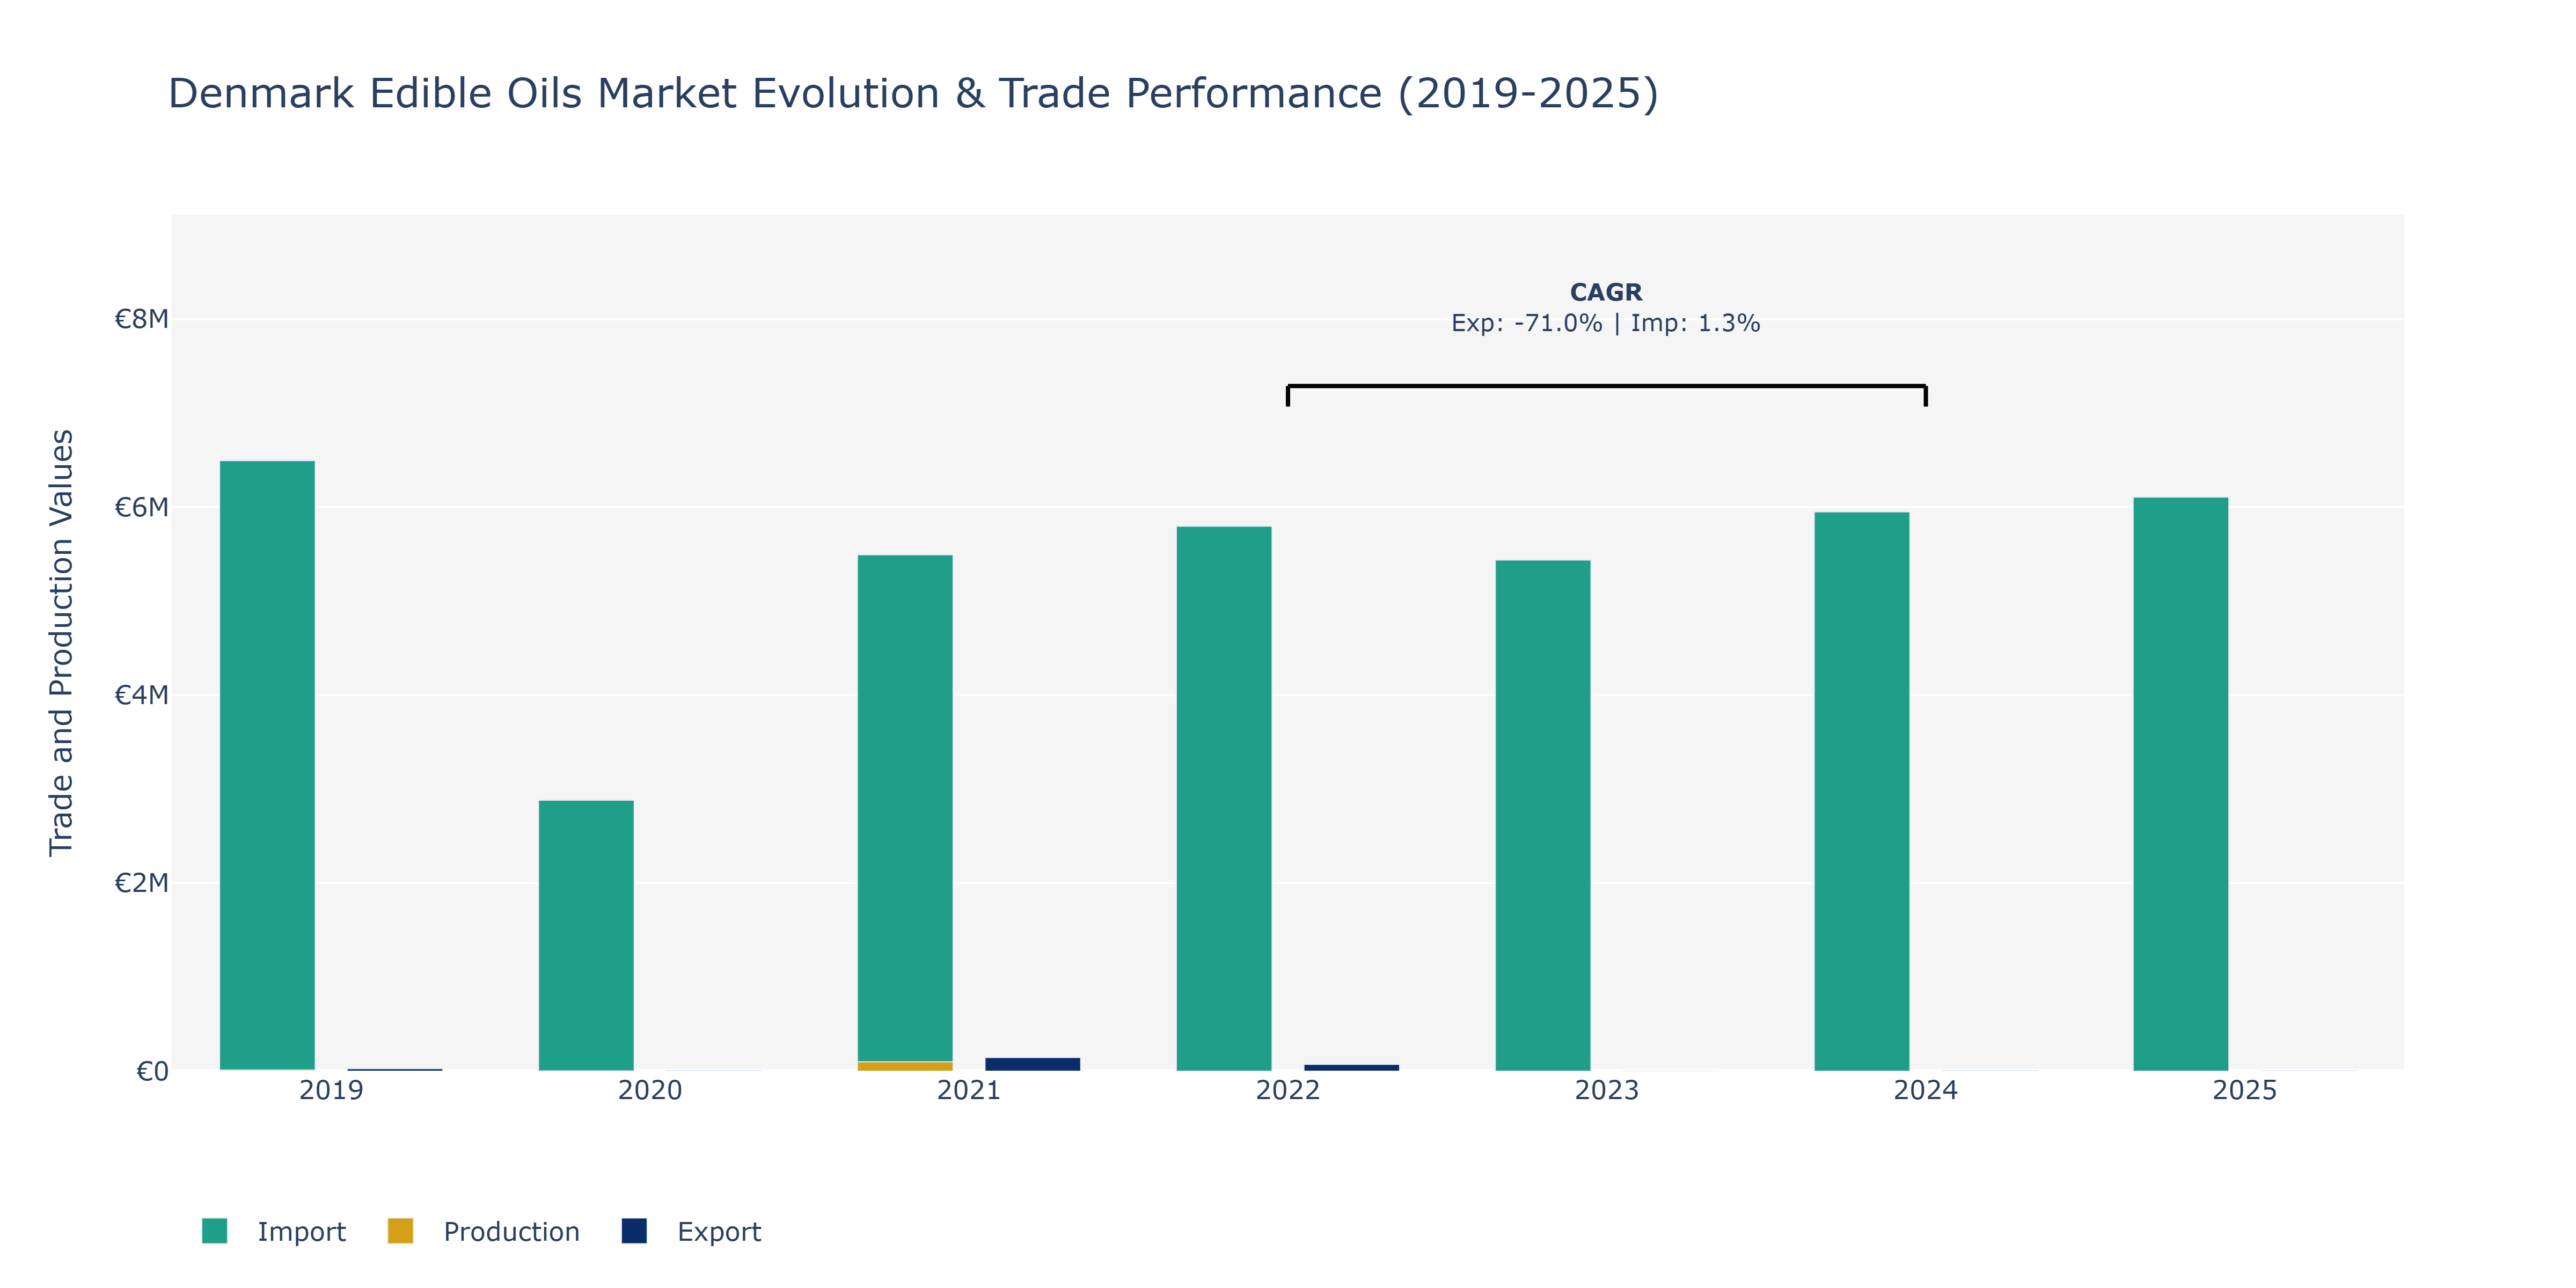
In the Denmark Edible Oils Market, there were notable fluctuations in exports, imports, and production from 2019 to 2025. Exports experienced a significant decline from €26.81 million in 2019 to around €1.73 thousand in 2023, before showing a slight recovery to €4.62 thousand in 2025. Imports, on the other hand, decreased steadily from €6.49 million in 2019 to approximately €5.95 million in 2024, before a slight uptick in 2025 to about €6.11 million. Production value followed a similar pattern, with a decrease from €13.26 million in 2019 to €2.68 million in 2020, before a substantial increase to €100.44 million in 2021. The fluctuations in exports can be attributed to changes in global demand and supply chains, while the steady import decline could be influenced by domestic production improvements. The surge in production in 2021 may reflect increased efficiency or new market opportunities within the edible oils sector in Denmark.
Key Highlights of the Report:
- Denmark Edible Oils Market Outlook
- Market Size of Denmark Edible Oils Market, 2025
- Forecast of Denmark Edible Oils Market, 2032
- Historical Data and Forecast of Denmark Edible Oils Revenues & Volume for the Period 2022 - 2032F
- Denmark Edible Oils Market Trend Evolution
- Denmark Edible Oils Market Drivers and Challenges
- Denmark Edible Oils Price Trends
- Denmark Edible Oils Porter`s Five Forces
- Denmark Edible Oils Industry Life Cycle
- Historical Data and Forecast of Denmark Edible Oils Market Revenues & Volume By Type for the Period 2022 - 2032F
- Historical Data and Forecast of Denmark Edible Oils Market Revenues & Volume By Palm Oil for the Period 2022 - 2032F
- Historical Data and Forecast of Denmark Edible Oils Market Revenues & Volume By Soybean Oil for the Period 2022 - 2032F
- Historical Data and Forecast of Denmark Edible Oils Market Revenues & Volume By Sunflower Oil for the Period 2022 - 2032F
- Historical Data and Forecast of Denmark Edible Oils Market Revenues & Volume By Rapeseed Oil for the Period 2022 - 2032F
- Historical Data and Forecast of Denmark Edible Oils Market Revenues & Volume By Olive Oil for the Period 2022 - 2032F
- Historical Data and Forecast of Denmark Edible Oils Market Revenues & Volume By Packaging Type for the Period 2022 - 2032F
- Historical Data and Forecast of Denmark Edible Oils Market Revenues & Volume By Pouches for the Period 2022 - 2032F
- Historical Data and Forecast of Denmark Edible Oils Market Revenues & Volume By Jars for the Period 2022 - 2032F
- Historical Data and Forecast of Denmark Edible Oils Market Revenues & Volume By Cans for the Period 2022 - 2032F
- Historical Data and Forecast of Denmark Edible Oils Market Revenues & Volume By Bottles for the Period 2022 - 2032F
- Historical Data and Forecast of Denmark Edible Oils Market Revenues & Volume By End Use for the Period 2022 - 2032F
- Historical Data and Forecast of Denmark Edible Oils Market Revenues & Volume By Domestic for the Period 2022 - 2032F
- Historical Data and Forecast of Denmark Edible Oils Market Revenues & Volume By Food Service for the Period 2022 - 2032F
- Historical Data and Forecast of Denmark Edible Oils Market Revenues & Volume By Industrial for the Period 2022 - 2032F
- Denmark Edible Oils Import Export Trade Statistics
- Market Opportunity Assessment By Type
- Market Opportunity Assessment By Packaging Type
- Market Opportunity Assessment By End Use
- Denmark Edible Oils Top Companies Market Share
- Denmark Edible Oils Competitive Benchmarking By Technical and Operational Parameters
- Denmark Edible Oils Company Profiles
- Denmark Edible Oils Key Strategic Recommendations
Frequently Asked Questions About the Market Study (FAQs):
6Wresearch actively monitors the Denmark Edible Oils Market and publishes its comprehensive annual report, highlighting emerging trends, growth drivers, revenue analysis, and forecast outlook. Our insights help businesses to make data-backed strategic decisions with ongoing market dynamics. Our analysts track relevent industries related to the Denmark Edible Oils Market, allowing our clients with actionable intelligence and reliable forecasts tailored to emerging regional needs.
Yes, we provide customisation as per your requirements. To learn more, feel free to contact us on sales@6wresearch.com
1 Executive Summary |
2 Introduction |
2.1 Key Highlights of the Report |
2.2 Report Description |
2.3 Market Scope & Segmentation |
2.4 Research Methodology |
2.5 Assumptions |
3 Denmark Edible Oils Market Overview |
3.1 Denmark Country Macro Economic Indicators |
3.2 Denmark Edible Oils Market Revenues & Volume, 2022 & 2032F |
3.3 Denmark Edible Oils Market - Industry Life Cycle |
3.4 Denmark Edible Oils Market - Porter's Five Forces |
3.5 Denmark Edible Oils Market Revenues & Volume Share, By Type, 2022 & 2032F |
3.6 Denmark Edible Oils Market Revenues & Volume Share, By Packaging Type, 2022 & 2032F |
3.7 Denmark Edible Oils Market Revenues & Volume Share, By End Use, 2022 & 2032F |
4 Denmark Edible Oils Market Dynamics |
4.1 Impact Analysis |
4.2 Market Drivers |
4.2.1 Increasing health consciousness and demand for healthier cooking oils |
4.2.2 Growing food industry and demand for convenience foods |
4.2.3 Rising trend of plant-based diets and veganism |
4.3 Market Restraints |
4.3.1 Fluctuating prices of raw materials such as soybean and palm oil |
4.3.2 Regulatory constraints and government policies impacting the edible oils market |
5 Denmark Edible Oils Market Trends |
6 Denmark Edible Oils Market Segmentations |
6.1 Denmark Edible Oils Market, By Type |
6.1.1 Overview and Analysis |
6.1.2 Denmark Edible Oils Market Revenues & Volume, By Palm Oil, 2022 - 2032F |
6.1.3 Denmark Edible Oils Market Revenues & Volume, By Soybean Oil, 2022 - 2032F |
6.1.4 Denmark Edible Oils Market Revenues & Volume, By Sunflower Oil, 2022 - 2032F |
6.1.5 Denmark Edible Oils Market Revenues & Volume, By Rapeseed Oil, 2022 - 2032F |
6.1.6 Denmark Edible Oils Market Revenues & Volume, By Olive Oil, 2022 - 2032F |
6.2 Denmark Edible Oils Market, By Packaging Type |
6.2.1 Overview and Analysis |
6.2.2 Denmark Edible Oils Market Revenues & Volume, By Pouches, 2022 - 2032F |
6.2.3 Denmark Edible Oils Market Revenues & Volume, By Jars, 2022 - 2032F |
6.2.4 Denmark Edible Oils Market Revenues & Volume, By Cans, 2022 - 2032F |
6.2.5 Denmark Edible Oils Market Revenues & Volume, By Bottles, 2022 - 2032F |
6.3 Denmark Edible Oils Market, By End Use |
6.3.1 Overview and Analysis |
6.3.2 Denmark Edible Oils Market Revenues & Volume, By Domestic, 2022 - 2032F |
6.3.3 Denmark Edible Oils Market Revenues & Volume, By Food Service , 2022 - 2032F |
6.3.4 Denmark Edible Oils Market Revenues & Volume, By Industrial, 2022 - 2032F |
7 Denmark Edible Oils Market Import-Export Trade Statistics |
7.1 Denmark Edible Oils Market Export to Major Countries |
7.2 Denmark Edible Oils Market Imports from Major Countries |
8 Denmark Edible Oils Market Key Performance Indicators |
8.1 Consumer awareness and preference for healthier cooking oils |
8.2 Adoption rate of plant-based diets in Denmark |
8.3 Import/export trends of edible oils in Denmark |
9 Denmark Edible Oils Market - Opportunity Assessment |
9.1 Denmark Edible Oils Market Opportunity Assessment, By Type, 2022 & 2032F |
9.2 Denmark Edible Oils Market Opportunity Assessment, By Packaging Type, 2022 & 2032F |
9.3 Denmark Edible Oils Market Opportunity Assessment, By End Use, 2022 & 2032F |
10 Denmark Edible Oils Market - Competitive Landscape |
10.1 Denmark Edible Oils Market Revenue Share, By Companies, 2025 |
10.2 Denmark Edible Oils Market Competitive Benchmarking, By Operating and Technical Parameters |
11 Company Profiles |
12 Recommendations | 13 Disclaimer |
Export potential assessment - trade Analytics for 2030
Export potential enables firms to identify high-growth global markets with greater confidence by combining advanced trade intelligence with a structured quantitative methodology. The framework analyzes emerging demand trends and country-level import patterns while integrating macroeconomic and trade datasets such as GDP and population forecasts, bilateral import–export flows, tariff structures, elasticity differentials between developed and developing economies, geographic distance, and import demand projections. Using weighted trade values from 2020–2024 as the base period to project country-to-country export potential for 2030, these inputs are operationalized through calculated drivers such as gravity model parameters, tariff impact factors, and projected GDP per-capita growth. Through an analysis of hidden potentials, demand hotspots, and market conditions that are most favorable to success, this method enables firms to focus on target countries, maximize returns, and global expansion with data, backed by accuracy.
By factoring in the projected importer demand gap that is currently unmet and could be potential opportunity, it identifies the potential for the Exporter (Country) among 190 countries, against the general trade analysis, which identifies the biggest importer or exporter.
To discover high-growth global markets and optimize your business strategy:
Click Here
Pricing
- Single User License$ 1,995
- Department License$ 2,400
- Site License$ 3,120
- Global License$ 3,795

Search
Thought Leadership and Analyst Meet


Our Clients
Latest Reports
- Canada Cloud CFD Market (2026-2032) | Size & Revenue, Industry, Growth, Competitive Landscape, Forecast, Segmentation, Value, Outlook, Trends, Share, Analysis, Companies
- Taiwan Food Delivery Platform Market (2026-2032) | Companies, Outlook, Analysis, Trends, Value, Revenue, Segmentation, Share, Forecast, Competitive Landscape, Growth, Size & Forecast
- United Kingdom (UK) Long-term Care Insurance Market (2026-2032) | Growth, Share, Consumer Insights, Drivers, Opportunities, Competition, Pricing Analysis, Segments, Restraints, Companies, Competitive, Value, Outlook, Size, Demand, Analysis, Challenges, Strategic Insights, Investment Trends, Revenue, Trends, Supply, Forecast
- United Kingdom (UK) Long Term Care Market (2026-2032) | Companies, Outlook, Analysis, Trends, Value, Revenue, Segmentation, Share, Forecast, Competitive Landscape, Growth, Size & Forecast
- Iraq Insulation and Waterproofing Market (2026-2032) | Outlook, Drivers, Growth, Size, Share, Industry, Revenue, Trends, Demand, Competitive, Strategic Insights, Opportunities, Segments, Companies, Challenges, Strategy, Consumer Insights, Analysis, Investment Trends, Value, Segmentation, Forecast, Restraints
- India Switchgear Market Outlook (2026-2032) | Size, Share, Trends, Growth, Revenue, Forecast, Analysis, Value, Outlook
- Pakistan Contraceptive Implants Market (2025-2031) | Demand, Growth, Size, Share, Industry, Pricing Analysis, Competitive, Strategic Insights, Strategy, Consumer Insights, Analysis, Investment Trends, Opportunities, Revenue, Segments, Value, Segmentation, Supply, Forecast, Restraints, Outlook, Competition, Drivers, Trends, Companies, Challenges
- Sri Lanka Packaging Market (2026-2032) | Outlook, Competition, Drivers, Trends, Demand, Pricing Analysis, Competitive, Strategic Insights, Companies, Challenges, Strategy, Consumer Insights, Analysis, Investment Trends, Opportunities, Growth, Size, Share, Industry, Revenue, Segments, Value, Segmentation, Supply, Forecast, Restraints
- India Kids Watches Market (2026-2032) | Strategy, Consumer Insights, Analysis, Investment Trends, Opportunities, Growth, Size, Share, Industry, Revenue, Segments, Value, Segmentation, Supply, Forecast, Restraints, Outlook, Competition, Drivers, Trends, Demand, Pricing Analysis, Competitive, Strategic Insights, Companies, Challenges
- Saudi Arabia Core Assurance Service Market (2025-2031) | Strategy, Consumer Insights, Analysis, Investment Trends, Opportunities, Growth, Size, Share, Industry, Revenue, Segments, Value, Segmentation, Supply, Forecast, Restraints, Outlook, Competition, Drivers, Trends, Demand, Pricing Analysis, Competitive, Strategic Insights, Companies, Challenges
Industry Events and Analyst Meet

India EV Show 2026

EV tech India Expo 2026

Auto Tech Asia 2026

Battery Tech India 2026

Smart Production Solutions Guangzhou 2026
Whitepaper
- Middle East & Africa Commercial Security Market Click here to view more.
- Middle East & Africa Fire Safety Systems & Equipment Market Click here to view more.
- GCC Drone Market Click here to view more.
- Middle East Lighting Fixture Market Click here to view more.
- GCC Physical & Perimeter Security Market Click here to view more.
6WResearch In News
- Doha a strategic location for EV manufacturing hub: IPA Qatar
- Demand for luxury TVs surging in the GCC, says Samsung
- Empowering Growth: The Thriving Journey of Bangladesh’s Cable Industry
- Demand for luxury TVs surging in the GCC, says Samsung
- Video call with a traditional healer? Once unthinkable, it’s now common in South Africa
- Intelligent Buildings To Smooth GCC’s Path To Net Zero