Denmark Fuel Station Market (2026-2032) | Forecast, Revenue, Growth, Size, Companies, Share, Outlook, Analysis, Segmentation, Trends, Value & Industry
Market Forecast By Fuel (Gasoline, Diesel, Gas, others), By End-User (Road Transport Vehicles, Air Transport Vehicles, Water Transport Vehicles) And Competitive Landscape
| Product Code: ETC5044183 | Publication Date: Nov 2023 | Updated Date: Apr 2026 | Product Type: Market Research Report | |
| Publisher: 6Wresearch | Author: Shubham Padhi | No. of Pages: 60 | No. of Figures: 30 | No. of Tables: 5 |
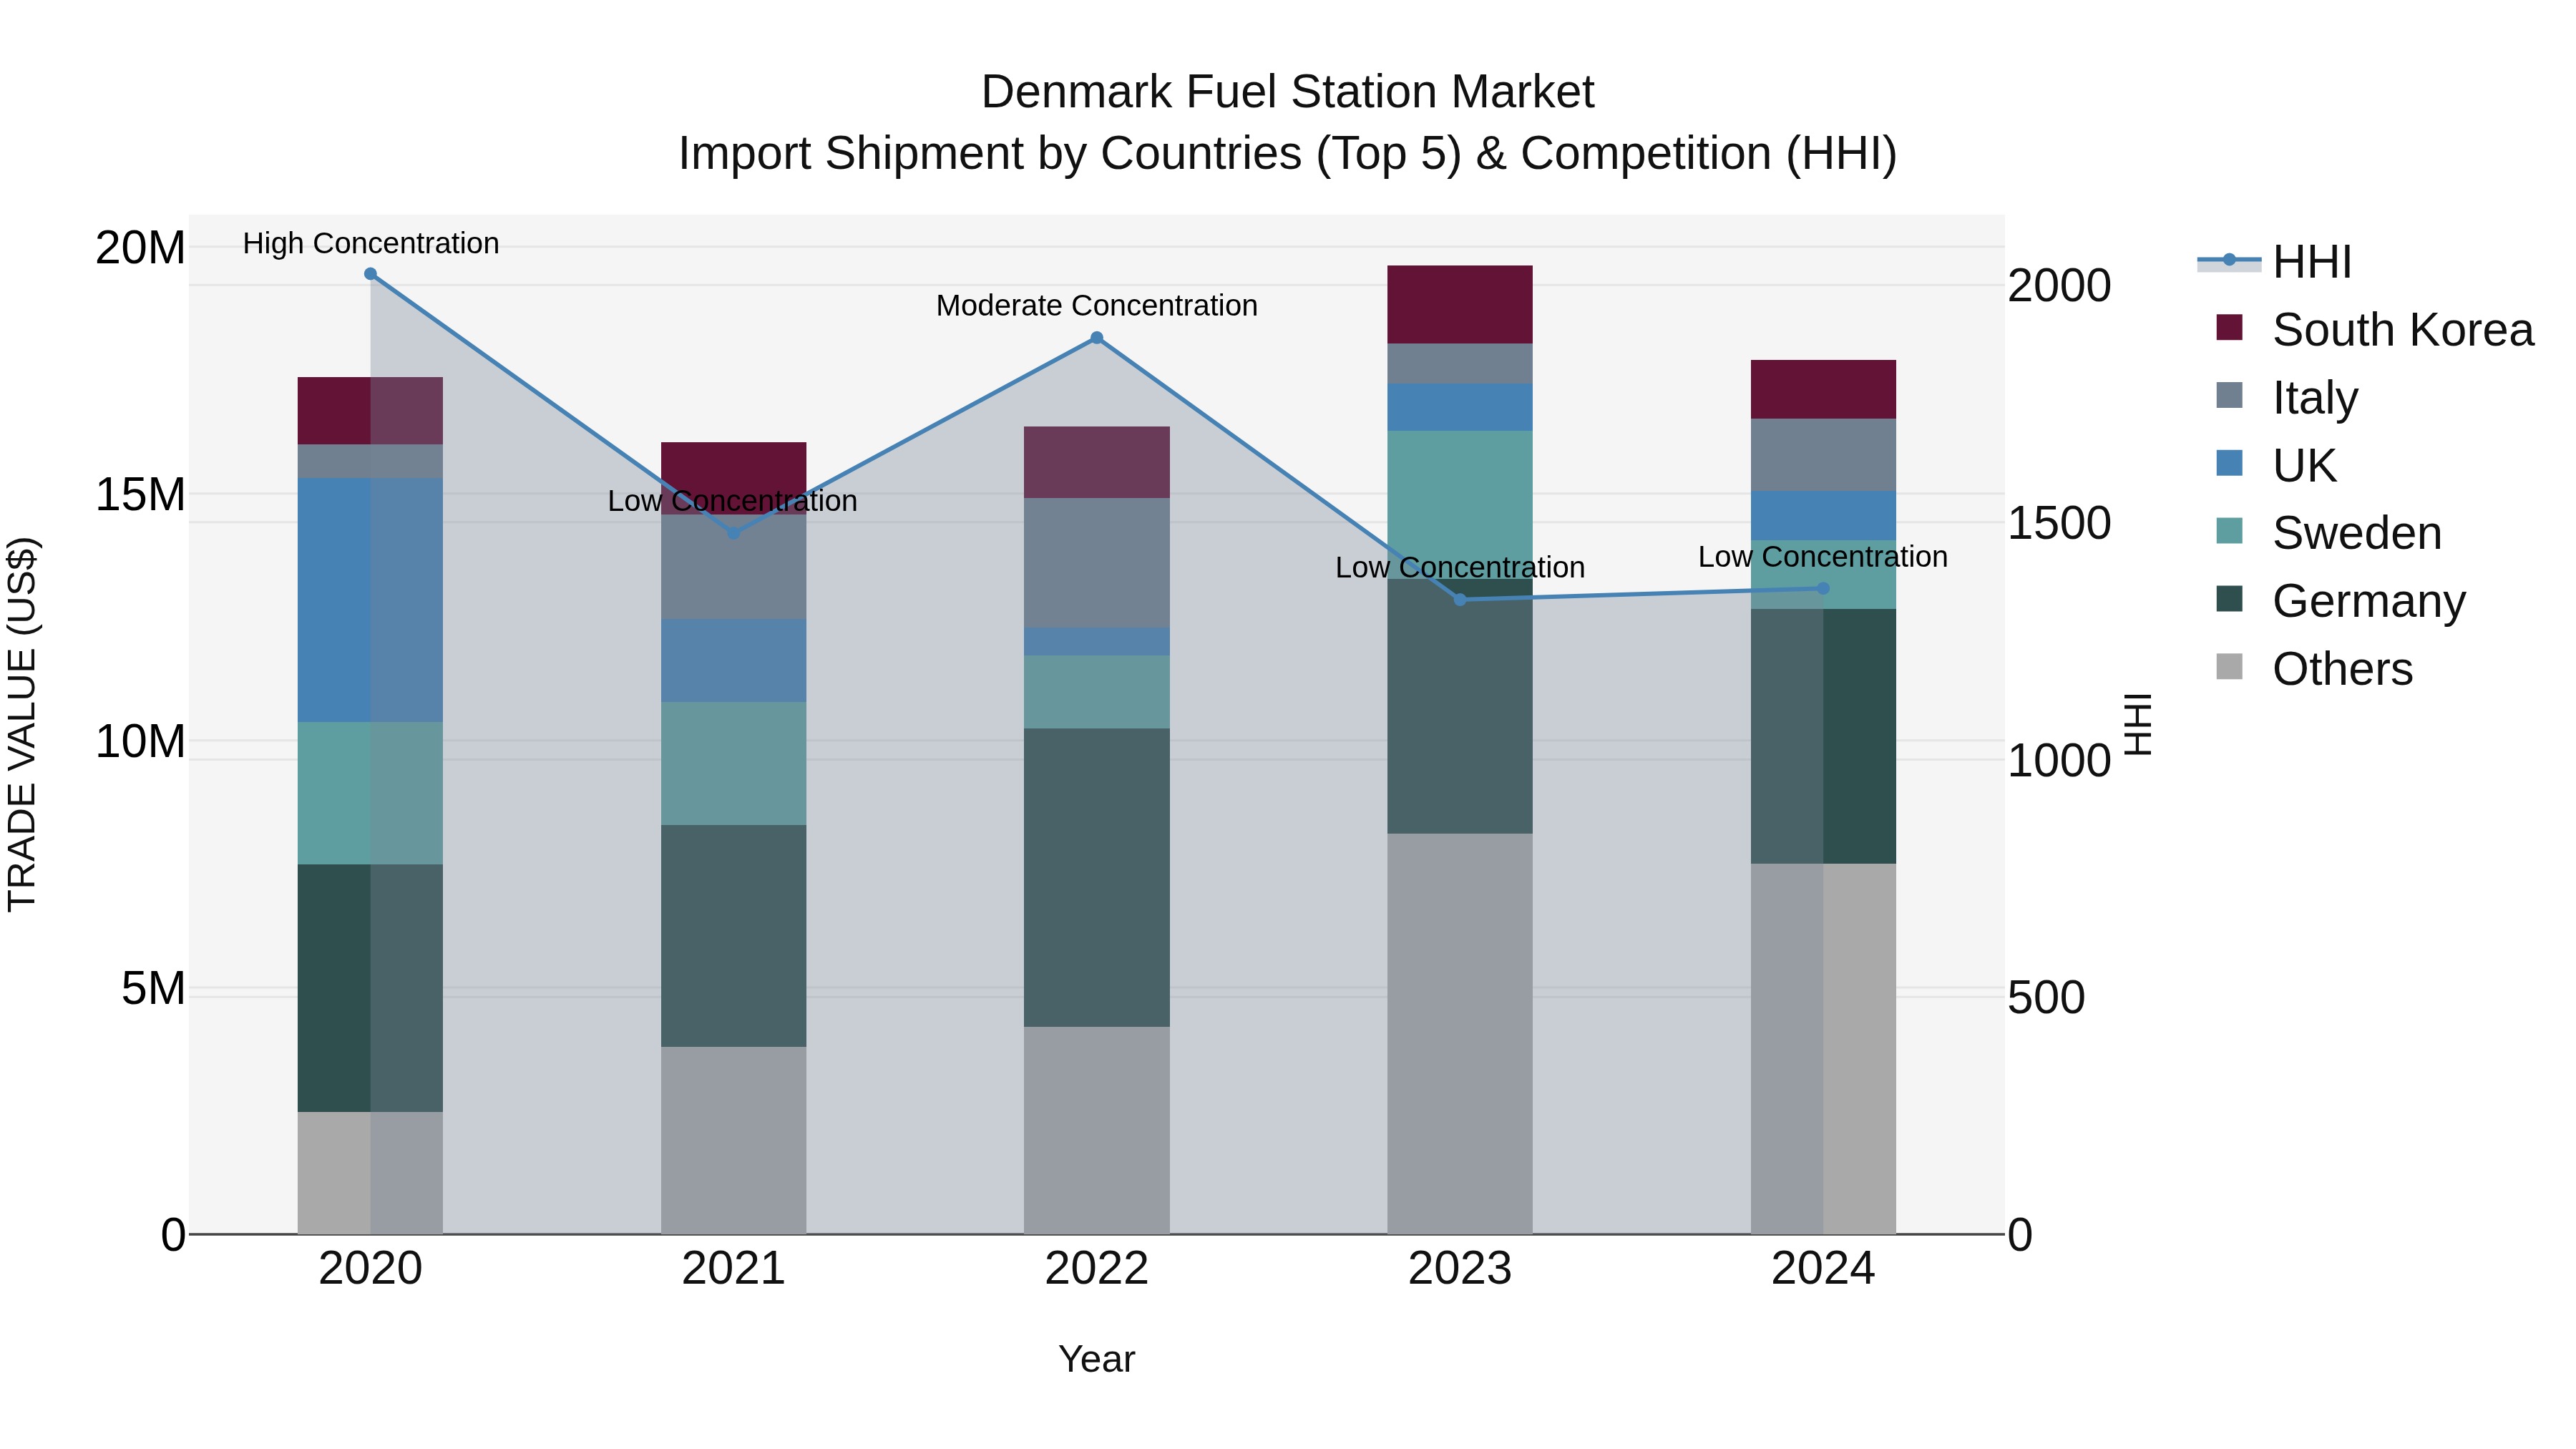
Denmark Fuel Station Market Top 5 Importing Countries and Market Competition (HHI) Analysis
In 2024, Denmark witnessed steady import shipments of fuel stations, with top exporters being Germany, Czechia, Norway, Italy, and Sweden. The market showed low concentration with a Herfindahl-Hirschman Index (HHI) remaining stable. The compound annual growth rate (CAGR) from 2020 to 2024 stood at 0.49%, indicating a slow but consistent growth pattern. However, there was a decline in growth rate from 2023 to 2024 at -9.71%, suggesting a temporary setback in the industry. Overall, the import market for fuel stations in Denmark displayed resilience amidst fluctuating trends.
Key Highlights of the Report:
- Denmark Fuel Station Market Outlook
- Market Size of Denmark Fuel Station Market, 2025
- Forecast of Denmark Fuel Station Market, 2032
- Historical Data and Forecast of Denmark Fuel Station Revenues & Volume for the Period 2022 - 2032F
- Denmark Fuel Station Market Trend Evolution
- Denmark Fuel Station Market Drivers and Challenges
- Denmark Fuel Station Price Trends
- Denmark Fuel Station Porter`s Five Forces
- Denmark Fuel Station Industry Life Cycle
- Historical Data and Forecast of Denmark Fuel Station Market Revenues & Volume By Fuel for the Period 2022 - 2032F
- Historical Data and Forecast of Denmark Fuel Station Market Revenues & Volume By Gasoline for the Period 2022 - 2032F
- Historical Data and Forecast of Denmark Fuel Station Market Revenues & Volume By Diesel for the Period 2022 - 2032F
- Historical Data and Forecast of Denmark Fuel Station Market Revenues & Volume By Gas for the Period 2022 - 2032F
- Historical Data and Forecast of Denmark Fuel Station Market Revenues & Volume By others for the Period 2022 - 2032F
- Historical Data and Forecast of Denmark Fuel Station Market Revenues & Volume By End-User for the Period 2022 - 2032F
- Historical Data and Forecast of Denmark Fuel Station Market Revenues & Volume By Road Transport Vehicles for the Period 2022 - 2032F
- Historical Data and Forecast of Denmark Fuel Station Market Revenues & Volume By Air Transport Vehicles for the Period 2022 - 2032F
- Historical Data and Forecast of Denmark Fuel Station Market Revenues & Volume By Water Transport Vehicles for the Period 2022 - 2032F
- Denmark Fuel Station Import Export Trade Statistics
- Market Opportunity Assessment By Fuel
- Market Opportunity Assessment By End-User
- Denmark Fuel Station Top Companies Market Share
- Denmark Fuel Station Competitive Benchmarking By Technical and Operational Parameters
- Denmark Fuel Station Company Profiles
- Denmark Fuel Station Key Strategic Recommendations
Frequently Asked Questions About the Market Study (FAQs):
6Wresearch actively monitors the Denmark Fuel Station Market and publishes its comprehensive annual report, highlighting emerging trends, growth drivers, revenue analysis, and forecast outlook. Our insights help businesses to make data-backed strategic decisions with ongoing market dynamics. Our analysts track relevent industries related to the Denmark Fuel Station Market, allowing our clients with actionable intelligence and reliable forecasts tailored to emerging regional needs.
Yes, we provide customisation as per your requirements. To learn more, feel free to contact us on sales@6wresearch.com
1 Executive Summary |
2 Introduction |
2.1 Key Highlights of the Report |
2.2 Report Description |
2.3 Market Scope & Segmentation |
2.4 Research Methodology |
2.5 Assumptions |
3 Denmark Fuel Station Market Overview |
3.1 Denmark Country Macro Economic Indicators |
3.2 Denmark Fuel Station Market Revenues & Volume, 2022 & 2032F |
3.3 Denmark Fuel Station Market - Industry Life Cycle |
3.4 Denmark Fuel Station Market - Porter's Five Forces |
3.5 Denmark Fuel Station Market Revenues & Volume Share, By Fuel, 2022 & 2032F |
3.6 Denmark Fuel Station Market Revenues & Volume Share, By End-User, 2022 & 2032F |
4 Denmark Fuel Station Market Dynamics |
4.1 Impact Analysis |
4.2 Market Drivers |
4.2.1 Growing demand for convenience and on-the-go services, leading to increased visits to fuel stations |
4.2.2 Government initiatives promoting clean energy and electric vehicles, driving the need for adaptability and innovation in fuel station offerings |
4.2.3 Tourism industry growth in Denmark, contributing to higher footfall and usage of fuel stations |
4.3 Market Restraints |
4.3.1 Increasing competition from electric vehicle charging stations, impacting traditional fuel sales |
4.3.2 Regulatory changes and environmental policies pushing for reduced carbon emissions, requiring fuel stations to invest in costly upgrades |
4.3.3 Fluctuating crude oil prices affecting the profitability and pricing strategies of fuel stations |
5 Denmark Fuel Station Market Trends |
6 Denmark Fuel Station Market Segmentations |
6.1 Denmark Fuel Station Market, By Fuel |
6.1.1 Overview and Analysis |
6.1.2 Denmark Fuel Station Market Revenues & Volume, By Gasoline, 2022 - 2032F |
6.1.3 Denmark Fuel Station Market Revenues & Volume, By Diesel, 2022 - 2032F |
6.1.4 Denmark Fuel Station Market Revenues & Volume, By Gas, 2022 - 2032F |
6.1.5 Denmark Fuel Station Market Revenues & Volume, By others, 2022 - 2032F |
6.2 Denmark Fuel Station Market, By End-User |
6.2.1 Overview and Analysis |
6.2.2 Denmark Fuel Station Market Revenues & Volume, By Road Transport Vehicles, 2022 - 2032F |
6.2.3 Denmark Fuel Station Market Revenues & Volume, By Air Transport Vehicles, 2022 - 2032F |
6.2.4 Denmark Fuel Station Market Revenues & Volume, By Water Transport Vehicles, 2022 - 2032F |
7 Denmark Fuel Station Market Import-Export Trade Statistics |
7.1 Denmark Fuel Station Market Export to Major Countries |
7.2 Denmark Fuel Station Market Imports from Major Countries |
8 Denmark Fuel Station Market Key Performance Indicators |
8.1 Average transaction value per customer |
8.2 Number of loyalty program sign-ups |
8.3 Percentage of revenue generated from non-fuel products and services |
8.4 Customer satisfaction ratings for cleanliness and service quality |
8.5 Percentage of revenue from sustainable or alternative fuel sources |
9 Denmark Fuel Station Market - Opportunity Assessment |
9.1 Denmark Fuel Station Market Opportunity Assessment, By Fuel, 2022 & 2032F |
9.2 Denmark Fuel Station Market Opportunity Assessment, By End-User, 2022 & 2032F |
10 Denmark Fuel Station Market - Competitive Landscape |
10.1 Denmark Fuel Station Market Revenue Share, By Companies, 2025 |
10.2 Denmark Fuel Station Market Competitive Benchmarking, By Operating and Technical Parameters |
11 Company Profiles |
12 Recommendations | 13 Disclaimer |
Global Go To Market Strategy - 2030
Export potential enables firms to identify high-growth global markets with greater confidence by combining advanced trade intelligence with a structured quantitative methodology. The framework analyzes emerging demand trends and country-level import patterns while integrating macroeconomic and trade datasets such as GDP and population forecasts, bilateral import–export flows, tariff structures, elasticity differentials between developed and developing economies, geographic distance, and import demand projections. Using weighted trade values from 2020–2024 as the base period to project country-to-country export potential for 2030, these inputs are operationalized through calculated drivers such as gravity model parameters, tariff impact factors, and projected GDP per-capita growth. Through an analysis of hidden potentials, demand hotspots, and market conditions that are most favorable to success, this method enables firms to focus on target countries, maximize returns, and global expansion with data, backed by accuracy.
By factoring in the projected importer demand gap that is currently unmet and could be potential opportunity, it identifies the potential for the Exporter (Country) among 190 countries, against the general trade analysis, which identifies the biggest importer or exporter.
To discover high-growth global markets and optimize your business strategy:
Click Here
Pricing
- Single User License$ 1,995
- Department License$ 2,400
- Site License$ 3,120
- Global License$ 3,795

Leadership Perspectives from Industry Events
Search
Thought Leadership and Analyst Meet


Our Clients
6WResearch In News
- Doha a strategic location for EV manufacturing hub: IPA Qatar
- Demand for luxury TVs surging in the GCC, says Samsung
- Empowering Growth: The Thriving Journey of Bangladesh’s Cable Industry
- Demand for luxury TVs surging in the GCC, says Samsung
- Video call with a traditional healer? Once unthinkable, it’s now common in South Africa
- Intelligent Buildings To Smooth GCC’s Path To Net Zero
Latest Reports
- Taiwan Airport Wireless Infrastructure Market (2026-2032)
- Vietnam Airport Wireless Infrastructure Market (2026-2032)
- Thailand Airport Wireless Infrastructure Market (2026-2032)
- South Korea Airport Wireless Infrastructure Market (2026-2032)
- Romania Airport Wireless Infrastructure Market (2026-2032)
- Qatar Airport Wireless Infrastructure Market (2026-2032)
- Philippines Airport Wireless Infrastructure Market (2026-2032)
- Japan Airport Wireless Infrastructure Market (2026-2032)
- Taiwan Airport Winter Services Market (2026-2032)
- Vietnam Airport Winter Services Market (2026-2032)
Industry Events and Analyst Meet

HIMTEX 2026

India Refining Summit 2026

India EV Show 2026

EV tech India Expo 2026

Auto Tech Asia 2026
Whitepaper
- Middle East & Africa Commercial Security Market Click here to view more.
- Middle East & Africa Fire Safety Systems & Equipment Market Click here to view more.
- GCC Drone Market Click here to view more.
- Middle East Lighting Fixture Market Click here to view more.
- GCC Physical & Perimeter Security Market Click here to view more.