Denmark Graphite Market (2026-2032) | Revenue, Analysis, Trends, Industry, Value, Size, Companies, Forecast, Segmentation, Outlook, Growth & Share
Market Forecast By Types (Natural Graphite, Synthetic Graphite), By Applications (Refractory, Foundry, Battery, Friction Product, Lubricant) And Competitive Landscape
| Product Code: ETC4653828 | Publication Date: Nov 2023 | Updated Date: Apr 2026 | Product Type: Market Research Report | |
| Publisher: 6Wresearch | Author: Shubham Padhi | No. of Pages: 60 | No. of Figures: 30 | No. of Tables: 5 |
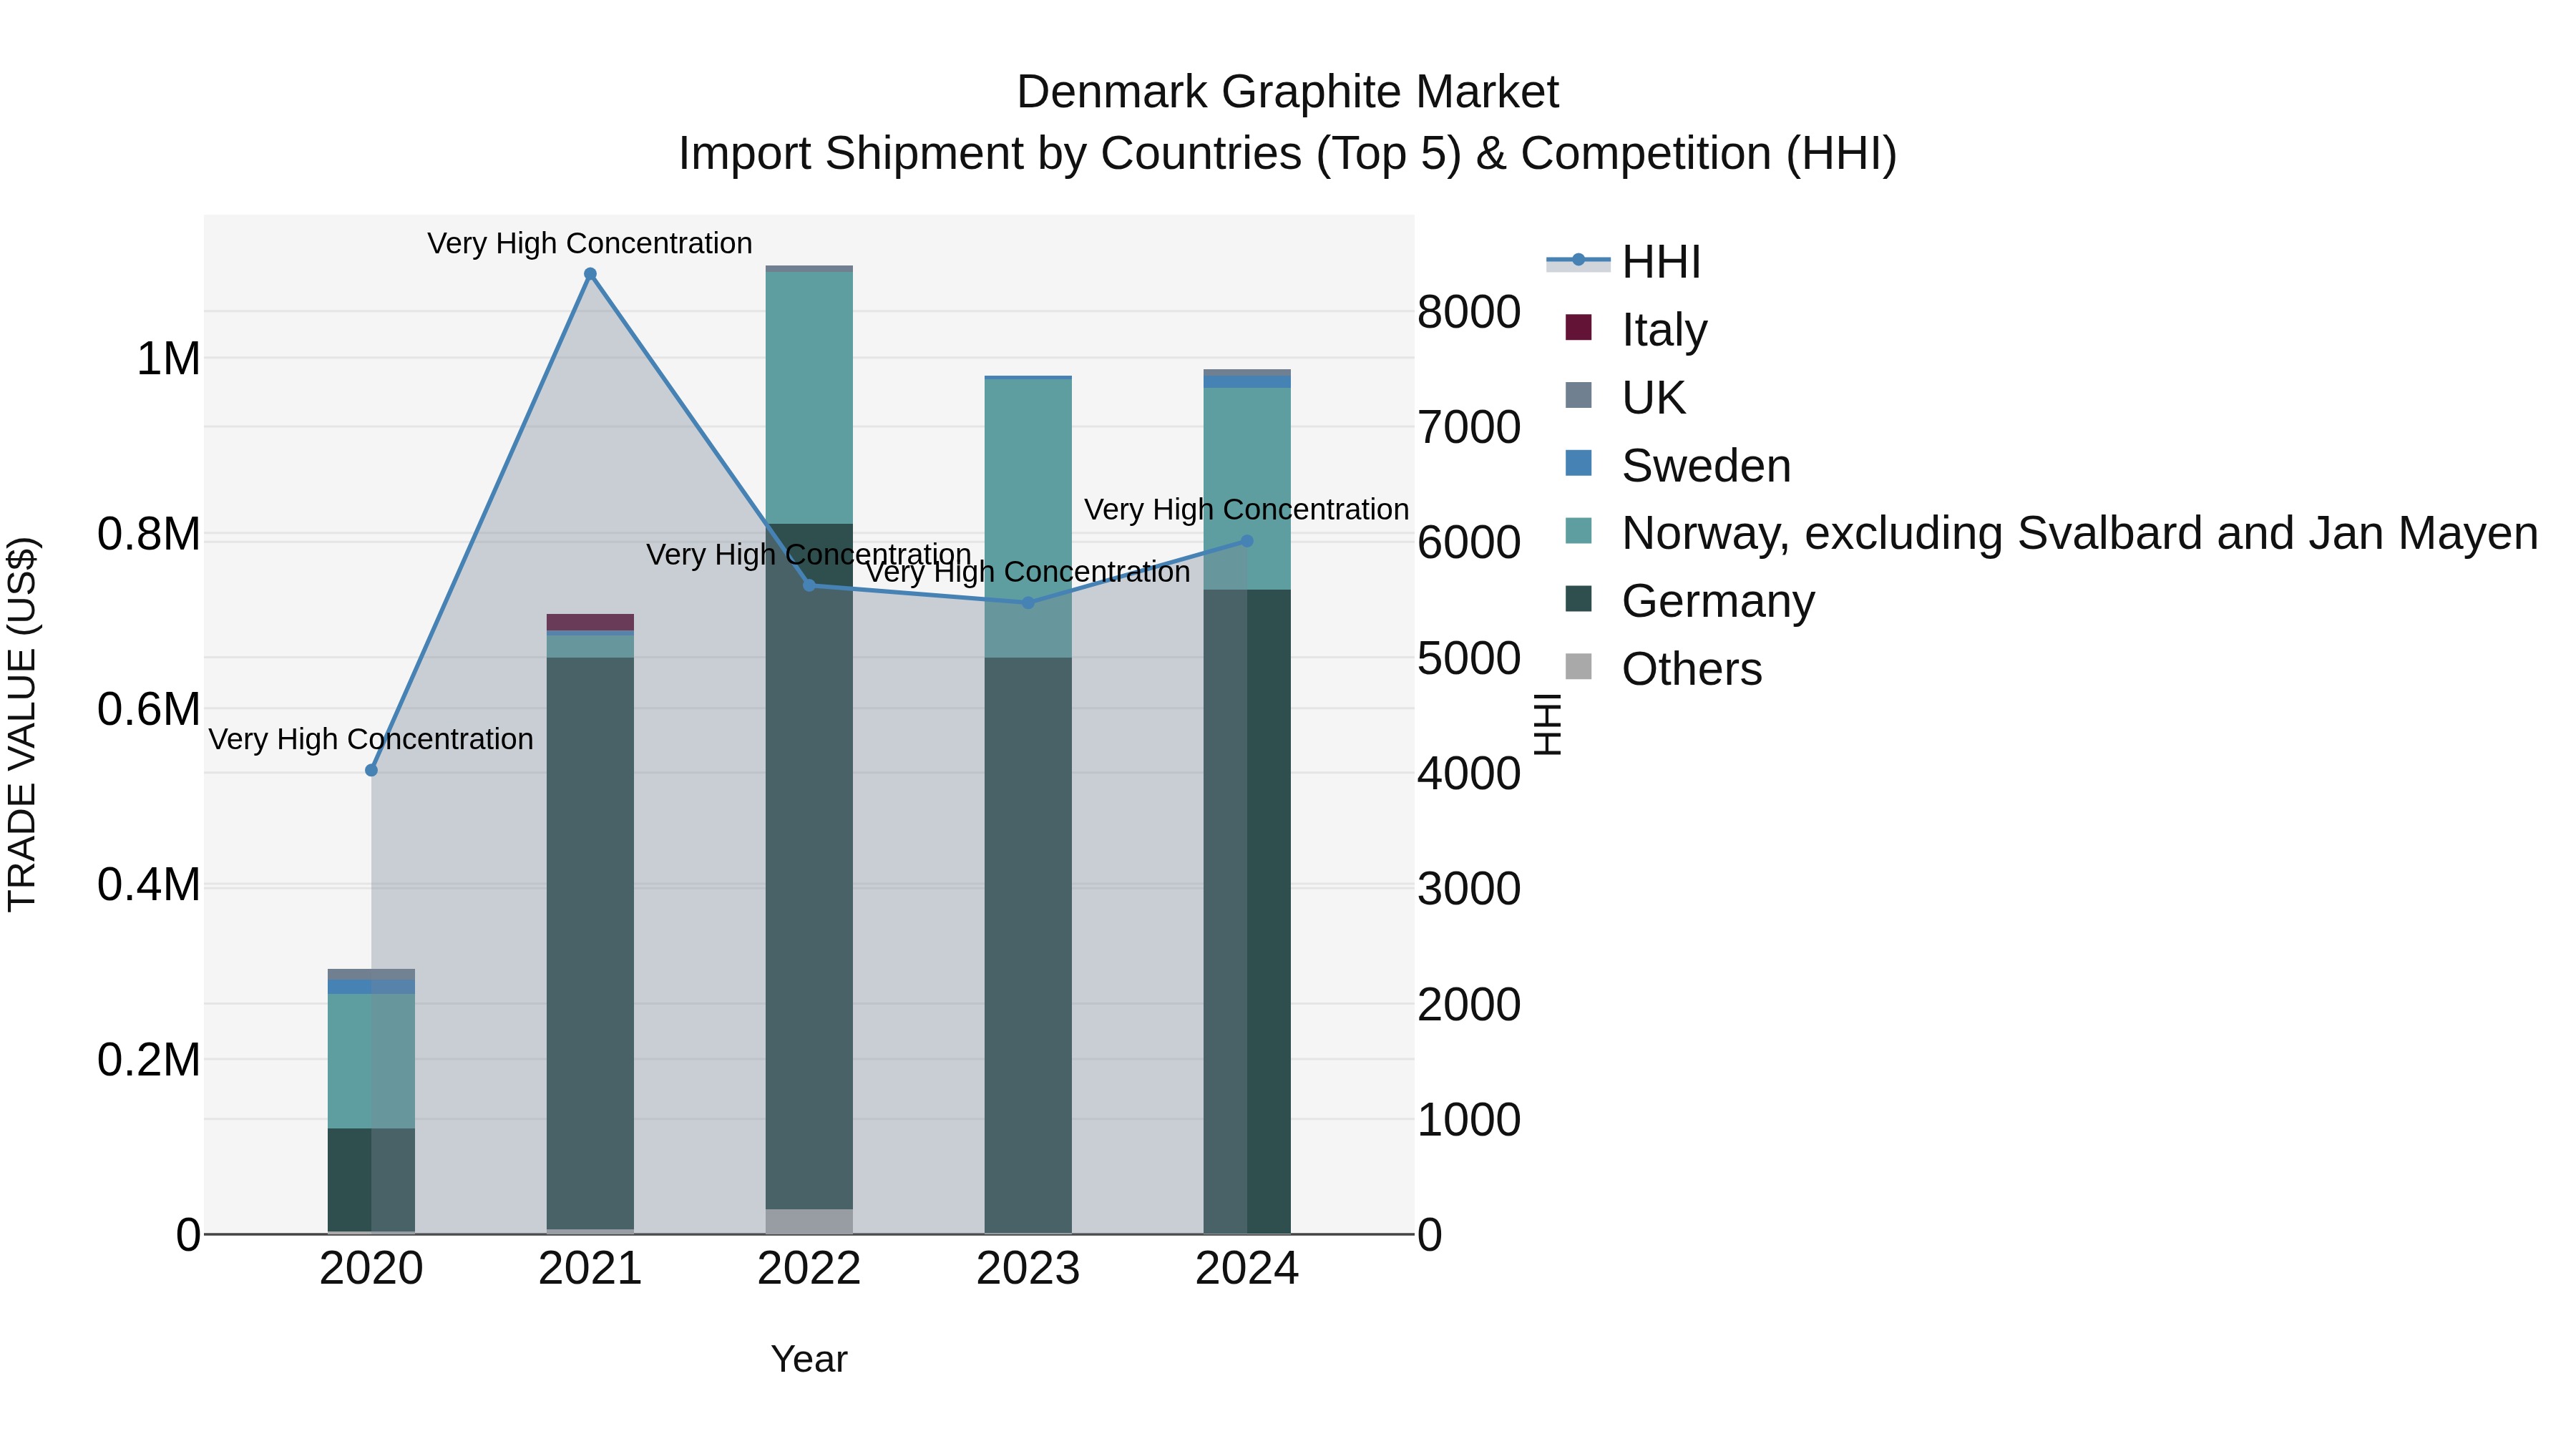
Denmark Graphite Market Top 5 Importing Countries and Market Competition (HHI) Analysis
Denmark graphite import shipments in 2024 continued to show a high concentration, with top exporting countries being Germany, Norway (excluding Svalbard and Jan Mayen), Sweden, UK, and China. The Herfindahl-Hirschman Index (HHI) remained at a very high level, indicating a consolidated market. The compound annual growth rate (CAGR) for graphite imports from 2020 to 2024 was impressive at 34.34%, highlighting a strong upward trajectory in demand. Despite a slight dip, the growth rate from 2023 to 2024 was still positive at 0.76%, suggesting a stable market performance overall.
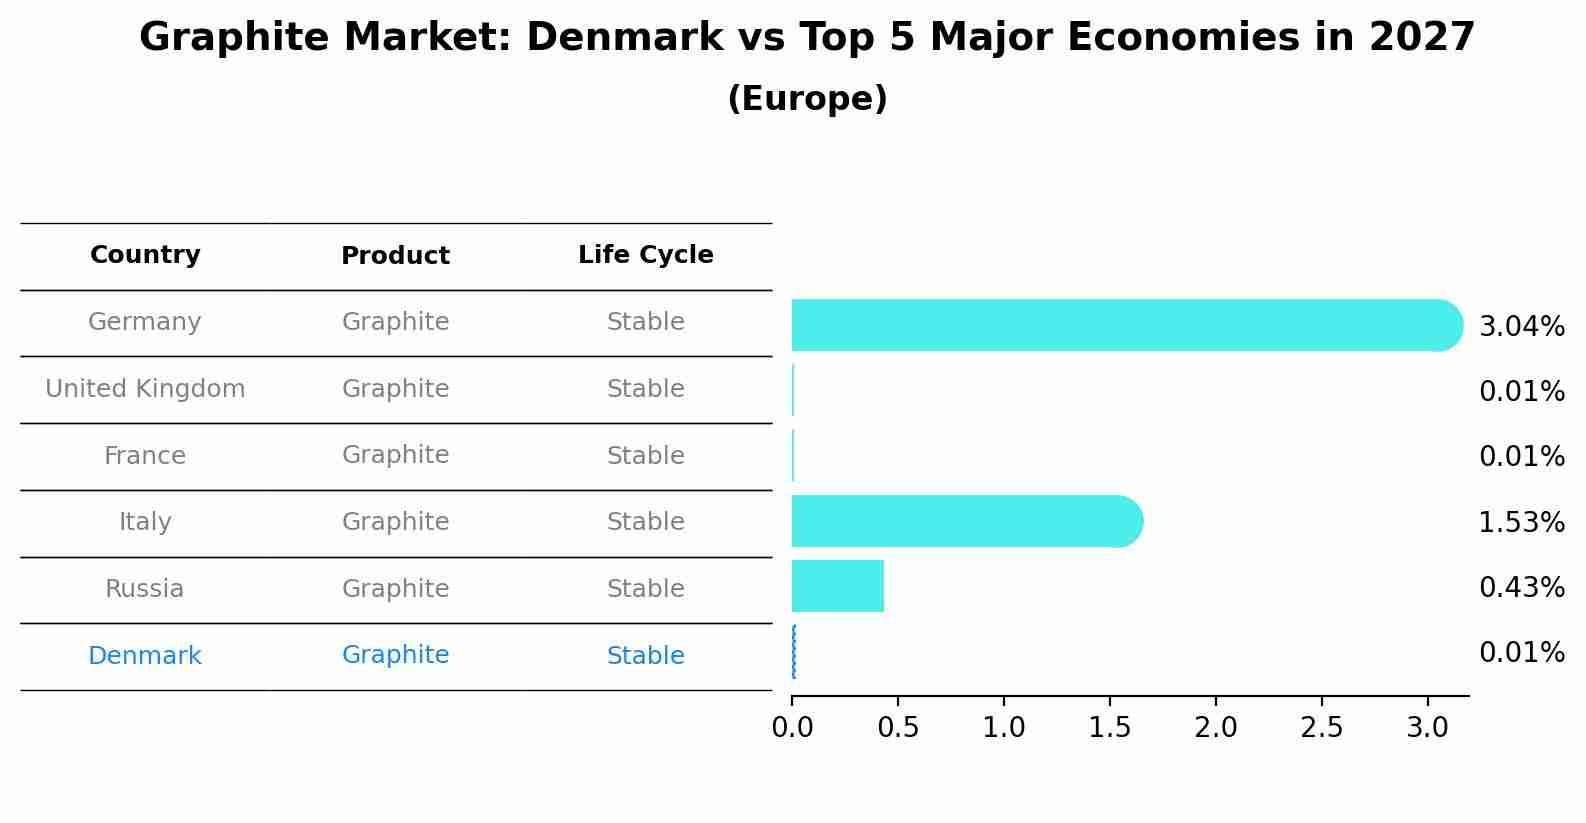
Graphite Market: Denmark vs Top 5 Major Economies in 2027 (Europe)
Denmark's Graphite market is anticipated to experience a stable growth rate of 0.01% by 2027, reflecting trends observed in the largest economy Germany, followed by United Kingdom, France, Italy and Russia.
Key Highlights of the Report:
- Denmark Graphite Market Outlook
- Market Size of Denmark Graphite Market, 2025
- Forecast of Denmark Graphite Market, 2032
- Historical Data and Forecast of Denmark Graphite Revenues & Volume for the Period 2022 - 2032F
- Denmark Graphite Market Trend Evolution
- Denmark Graphite Market Drivers and Challenges
- Denmark Graphite Price Trends
- Denmark Graphite Porter`s Five Forces
- Denmark Graphite Industry Life Cycle
- Historical Data and Forecast of Denmark Graphite Market Revenues & Volume By Types for the Period 2022 - 2032F
- Historical Data and Forecast of Denmark Graphite Market Revenues & Volume By Natural Graphite for the Period 2022 - 2032F
- Historical Data and Forecast of Denmark Graphite Market Revenues & Volume By Synthetic Graphite for the Period 2022 - 2032F
- Historical Data and Forecast of Denmark Graphite Market Revenues & Volume By Applications for the Period 2022 - 2032F
- Historical Data and Forecast of Denmark Graphite Market Revenues & Volume By Refractory for the Period 2022 - 2032F
- Historical Data and Forecast of Denmark Graphite Market Revenues & Volume By Foundry for the Period 2022 - 2032F
- Historical Data and Forecast of Denmark Graphite Market Revenues & Volume By Battery for the Period 2022 - 2032F
- Historical Data and Forecast of Denmark Graphite Market Revenues & Volume By Friction Product for the Period 2022 - 2032F
- Historical Data and Forecast of Denmark Graphite Market Revenues & Volume By Lubricant for the Period 2022 - 2032F
- Denmark Graphite Import Export Trade Statistics
- Market Opportunity Assessment By Types
- Market Opportunity Assessment By Applications
- Denmark Graphite Top Companies Market Share
- Denmark Graphite Competitive Benchmarking By Technical and Operational Parameters
- Denmark Graphite Company Profiles
- Denmark Graphite Key Strategic Recommendations
Frequently Asked Questions About the Market Study (FAQs):
6Wresearch actively monitors the Denmark Graphite Market and publishes its comprehensive annual report, highlighting emerging trends, growth drivers, revenue analysis, and forecast outlook. Our insights help businesses to make data-backed strategic decisions with ongoing market dynamics. Our analysts track relevent industries related to the Denmark Graphite Market, allowing our clients with actionable intelligence and reliable forecasts tailored to emerging regional needs.
Yes, we provide customisation as per your requirements. To learn more, feel free to contact us on sales@6wresearch.com
1 Executive Summary |
2 Introduction |
2.1 Key Highlights of the Report |
2.2 Report Description |
2.3 Market Scope & Segmentation |
2.4 Research Methodology |
2.5 Assumptions |
3 Denmark Graphite Market Overview |
3.1 Denmark Country Macro Economic Indicators |
3.2 Denmark Graphite Market Revenues & Volume, 2022 & 2032F |
3.3 Denmark Graphite Market - Industry Life Cycle |
3.4 Denmark Graphite Market - Porter's Five Forces |
3.5 Denmark Graphite Market Revenues & Volume Share Segmentations, 2022 & 2032F |
3.6 Denmark Graphite Market Revenues & Volume Share, By Applications, 2022 & 2032F |
4 Denmark Graphite Market Dynamics |
4.1 Impact Analysis |
4.2 Market Drivers |
4.2.1 Increasing demand for graphite in electric vehicle (EV) batteries due to the shift towards sustainable transportation. |
4.2.2 Growing usage of graphite in renewable energy applications such as solar panels and wind turbines. |
4.2.3 Technological advancements leading to the development of high-performance graphite materials for various industries. |
4.3 Market Restraints |
4.3.1 Volatility in graphite prices due to fluctuations in the supply of raw materials. |
4.3.2 Environmental concerns related to graphite mining and processing. |
4.3.3 Competition from alternative materials like lithium-ion batteries in the energy storage sector. |
5 Denmark Graphite Market Trends |
6 Denmark Graphite Market Segmentations |
6.1 Denmark Graphite Market Segmentations |
6.1.1 Overview and Analysis |
6.1.2 Denmark Graphite Market Revenues & Volume, By Natural Graphite, 2022 - 2032F |
6.1.3 Denmark Graphite Market Revenues & Volume, By Synthetic Graphite, 2022 - 2032F |
6.2 Denmark Graphite Market, By Applications |
6.2.1 Overview and Analysis |
6.2.2 Denmark Graphite Market Revenues & Volume, By Refractory, 2022 - 2032F |
6.2.3 Denmark Graphite Market Revenues & Volume, By Foundry, 2022 - 2032F |
6.2.4 Denmark Graphite Market Revenues & Volume, By Battery, 2022 - 2032F |
6.2.5 Denmark Graphite Market Revenues & Volume, By Friction Product, 2022 - 2032F |
6.2.6 Denmark Graphite Market Revenues & Volume, By Lubricant, 2022 - 2032F |
7 Denmark Graphite Market Import-Export Trade Statistics |
7.1 Denmark Graphite Market Export to Major Countries |
7.2 Denmark Graphite Market Imports from Major Countries |
8 Denmark Graphite Market Key Performance Indicators |
8.1 Average selling price of graphite products in Denmark. |
8.2 Research and development investment in graphite technologies. |
8.3 Adoption rate of graphite in key industries such as automotive, electronics, and aerospace. |
9 Denmark Graphite Market - Opportunity Assessment |
9.1 Denmark Graphite Market Opportunity Assessment Segmentations, 2022 & 2032F |
9.2 Denmark Graphite Market Opportunity Assessment, By Applications, 2022 & 2032F |
10 Denmark Graphite Market - Competitive Landscape |
10.1 Denmark Graphite Market Revenue Share, By Companies, 2025 |
10.2 Denmark Graphite Market Competitive Benchmarking, By Operating and Technical Parameters |
11 Company Profiles |
12 Recommendations | 13 Disclaimer |
Export potential assessment - trade Analytics for 2030
Export potential enables firms to identify high-growth global markets with greater confidence by combining advanced trade intelligence with a structured quantitative methodology. The framework analyzes emerging demand trends and country-level import patterns while integrating macroeconomic and trade datasets such as GDP and population forecasts, bilateral import–export flows, tariff structures, elasticity differentials between developed and developing economies, geographic distance, and import demand projections. Using weighted trade values from 2020–2024 as the base period to project country-to-country export potential for 2030, these inputs are operationalized through calculated drivers such as gravity model parameters, tariff impact factors, and projected GDP per-capita growth. Through an analysis of hidden potentials, demand hotspots, and market conditions that are most favorable to success, this method enables firms to focus on target countries, maximize returns, and global expansion with data, backed by accuracy.
By factoring in the projected importer demand gap that is currently unmet and could be potential opportunity, it identifies the potential for the Exporter (Country) among 190 countries, against the general trade analysis, which identifies the biggest importer or exporter.
To discover high-growth global markets and optimize your business strategy:
Click Here
Pricing
- Single User License$ 1,995
- Department License$ 2,400
- Site License$ 3,120
- Global License$ 3,795

Search
Thought Leadership and Analyst Meet


Our Clients
Latest Reports
- China Electric Appliance Rental Market (2026-2032) | Trends, Revenue, Growth, Challenges, Size, Value, Outlook, Pricing, Strategy, Insights, Restraints, segmentation, Companies, Investment Opportunities, Analysis, Demand, Drivers, Competition, Forecast, Share
- Chile Electric Appliance Rental Market (2026-2032) | Outlook, Competition, Drivers, Strategy, Revenue, Analysis, Value, Pricing, Restraints, Size, Demand, Share, Growth, Forecast, Challenges, Insights, Investment Opportunities, Companies, Trends, segmentation
- Cambodia Electric Appliance Rental Market (2026-2032) | Companies, Analysis, Restraints, Pricing, Insights, Challenges, Outlook, Strategy, Forecast, Trends, Competition, Value, Revenue, Investment Opportunities, segmentation, Drivers, Size, Demand, Growth, Share
- Brazil Electric Appliance Rental Market (2026-2032) | Revenue, Strategy, Forecast, Companies, segmentation, Competition, Size, Investment Opportunities, Pricing, Restraints, Outlook, Challenges, Analysis, Drivers, Value, Demand, Insights, Trends, Growth, Share
- Bangladesh Electric Appliance Rental Market (2026-2032) | Drivers, Forecast, Investment Opportunities, Strategy, Insights, Demand, Challenges, Outlook, Trends, Competition, Value, Revenue, Size, Pricing, Analysis, Companies, Restraints, segmentation, Share, Growth
- Bahrain Electric Appliance Rental Market (2026-2032) | Outlook, Size, Competition, Restraints, Drivers, Value, Trends, Investment Opportunities, Insights, Forecast, Revenue, Strategy, Growth, Share, Demand, Analysis, Challenges, Companies, segmentation, Pricing
- Azerbaijan Electric Appliance Rental Market (2026-2032) | Trends, Investment Opportunities, Restraints, Insights, Strategy, Competition, Value, Growth, Demand, Drivers, Analysis, Forecast, Size, Share, Outlook, segmentation, Pricing, Challenges, Revenue, Companies
- Australia Electric Appliance Rental Market (2026-2032) | Challenges, Restraints, Forecast, Demand, Size, Competition, Pricing, Investment Opportunities, Revenue, Trends, Drivers, Growth, Outlook, Analysis, Strategy, Value, segmentation, Insights, Companies, Share
- Argentina Electric Appliance Rental Market (2026-2032) | Growth, Trends, Insights, Outlook, Forecast, Size, Drivers, Analysis, Restraints, Challenges, Share, Revenue, Investment Opportunities, Strategy, Demand, Value, Companies, segmentation, Competition, Pricing
- Algeria Electric Appliance Rental Market (2026-2032) | Share, Size, Value, Strategy, Competition, Outlook, Challenges, Companies, Trends, Pricing, Insights, Forecast, Investment Opportunities, Revenue, Growth, Restraints, segmentation, Analysis, Demand, Drivers
Industry Events and Analyst Meet

HIMTEX 2026

India Refining Summit 2026

India EV Show 2026

EV tech India Expo 2026

Auto Tech Asia 2026
Whitepaper
- Middle East & Africa Commercial Security Market Click here to view more.
- Middle East & Africa Fire Safety Systems & Equipment Market Click here to view more.
- GCC Drone Market Click here to view more.
- Middle East Lighting Fixture Market Click here to view more.
- GCC Physical & Perimeter Security Market Click here to view more.
6WResearch In News
- Doha a strategic location for EV manufacturing hub: IPA Qatar
- Demand for luxury TVs surging in the GCC, says Samsung
- Empowering Growth: The Thriving Journey of Bangladesh’s Cable Industry
- Demand for luxury TVs surging in the GCC, says Samsung
- Video call with a traditional healer? Once unthinkable, it’s now common in South Africa
- Intelligent Buildings To Smooth GCC’s Path To Net Zero