Denmark Industrial Chain Market (2026-2032) | Analysis, Restraints, Strategic Insights, Share, Investment Trends, Challenges, Segments, Competition, Drivers, Industry, Strategy, Trends, Forecast, Growth, Consumer Insights, Outlook, Pricing Analysis, Value, Competitive, Demand, Size, Opportunities, Segmentation, Revenue, Companies, Supply
Market Forecast By Chain Type (Roller Chains, Leaf Chains, Silent Chains, Engineered Chains), By Material Used (Stainless Steel, Carbon Steel, Alloy Steel, Nickel-Plated Steel), By Application (Conveyor Systems, Power Transmission, Lifting Applications, Mining & Drilling), By End User (Manufacturing, Automotive, Construction, Oil & Gas), By Sales Model (Direct Sales, Distributors, Online Suppliers, Industrial Suppliers) And Competitive Landscape
| Product Code: ETC12478616 | Publication Date: Apr 2025 | Updated Date: Apr 2026 | Product Type: Market Research Report | |
| Publisher: 6Wresearch | No. of Pages: 65 | No. of Figures: 34 | No. of Tables: 19 | |
Denmark Industrial Chain Market Size (2020-2030)
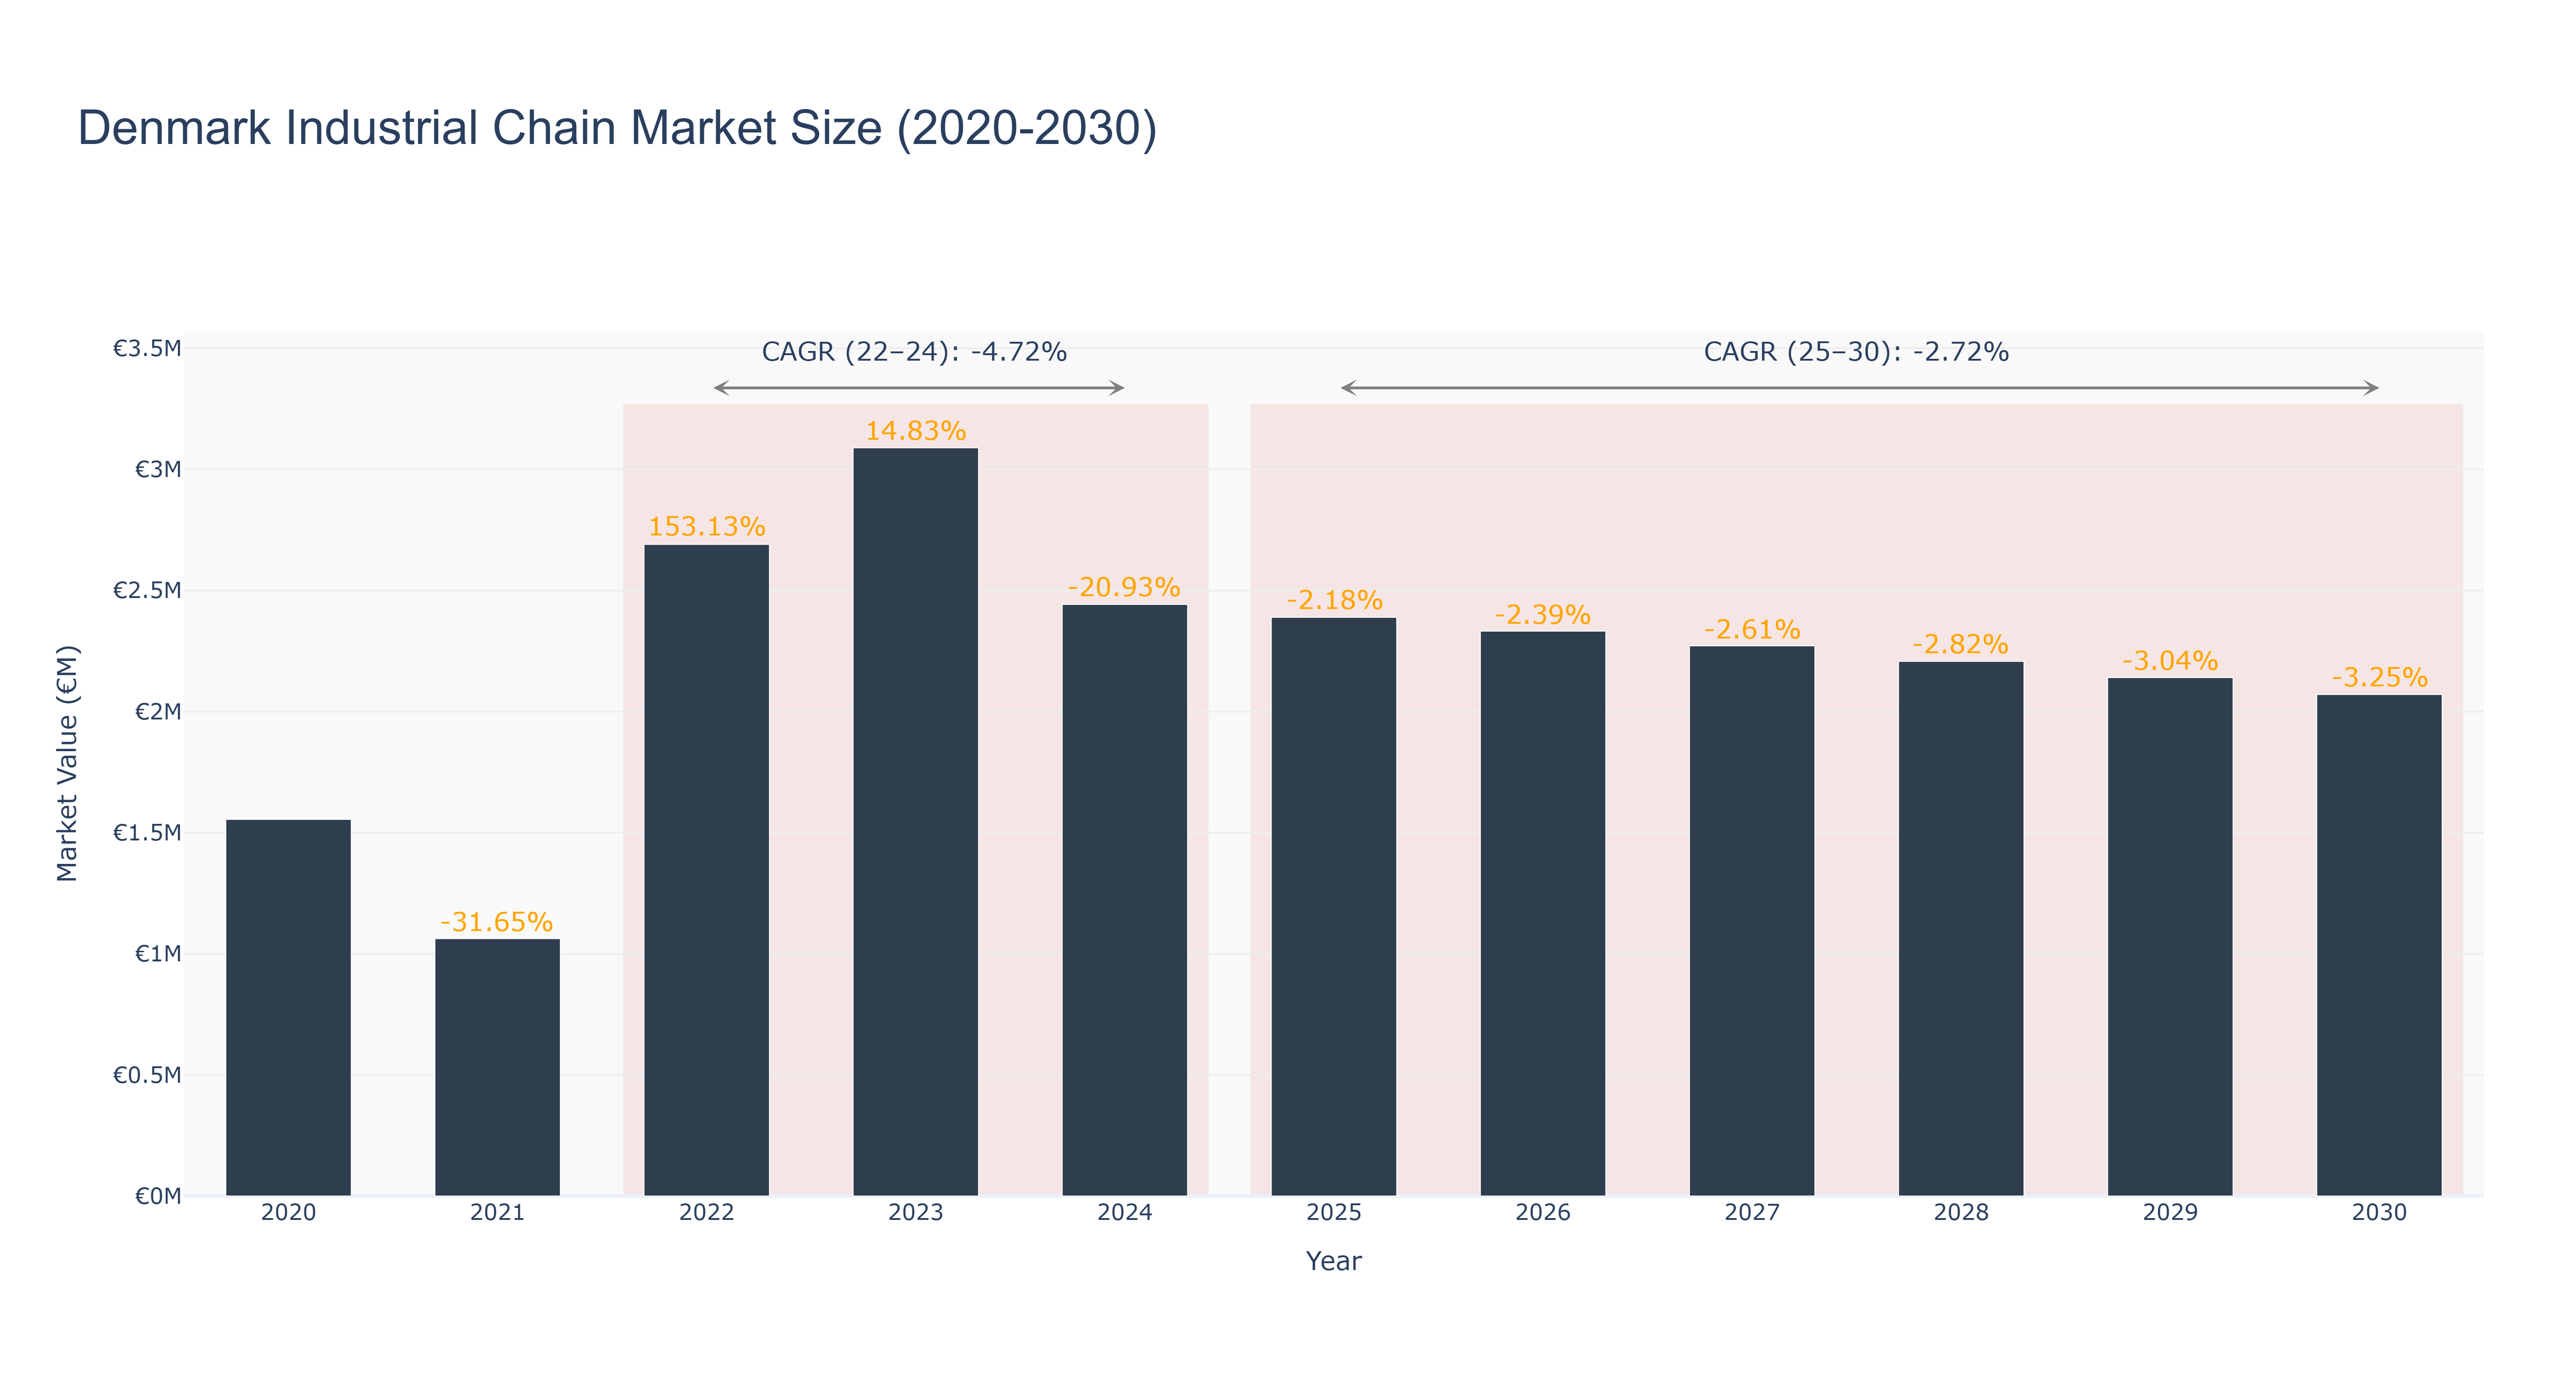
Denmark Industrial Chain Market has seen fluctuations in recent years. The market peaked at €3.09 million in 2023, with a subsequent decline to €2.44 million in 2024. The forecasted trend shows a continued decrease in market size, with an expected value of €2.07 million by 2030. The CAGR for the period 2022-24 is -4.72%, while for 2025-30 it stands at -2.72%. The downward trend can be attributed to factors such as economic uncertainty and changing consumer preferences. Industry drivers like sustainability initiatives and technological advancements may play a crucial role in shaping the future of the market. In the near future, Denmark is set to launch a national industrial strategy aimed at boosting innovation and competitiveness in key sectors, including industrial chains, which could potentially drive growth in the market.
Denmark Industrial Chain Market: Production & Trade Performance (2019-2025)
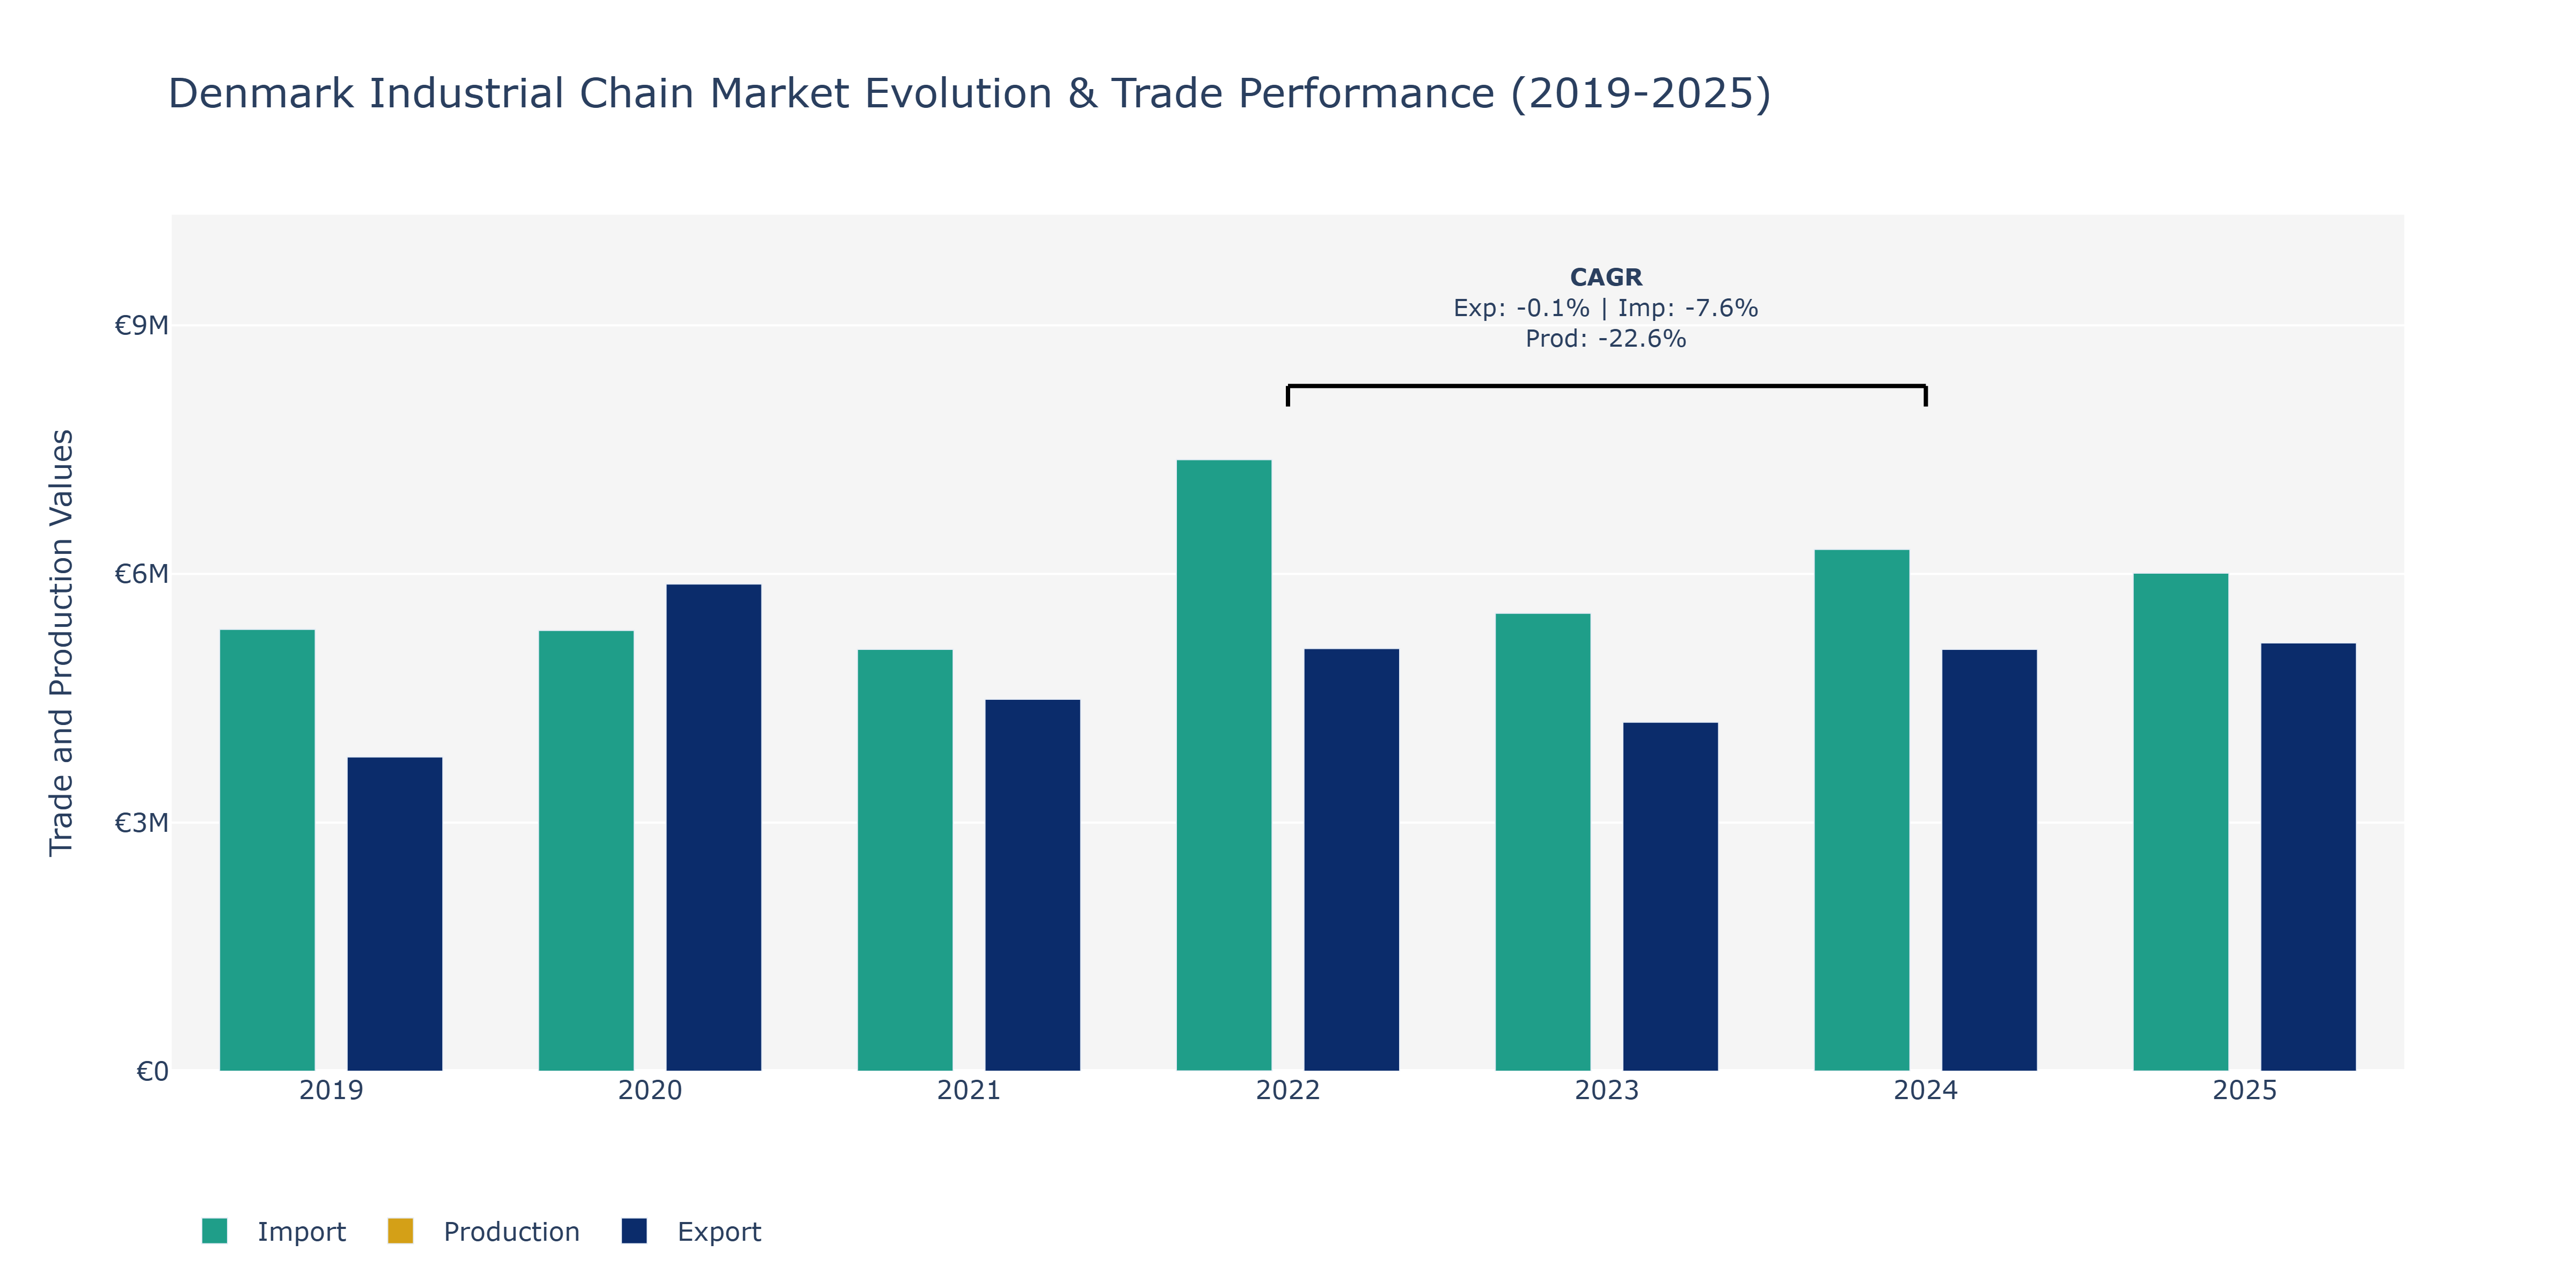
In the Denmark Industrial Chain Market, exports experienced fluctuations over the years, with a peak in 2020 at €5.88 million before declining to €4.21 million in 2023. The drop in exports in 2021 and 2023 could be attributed to global economic uncertainties impacting demand. Imports, on the other hand, remained relatively stable, ranging from €5.29 million to €7.38 million. The notable decrease in imports by 22.63% in 2024 compared to 2022 could be due to supply chain disruptions affecting the inflow of goods. Production levels showed a significant decline from 2688 units in 2022 to 1337 units in 2025, possibly indicating challenges in manufacturing processes or shifts in consumer preferences towards imported goods. These trends highlight the market's sensitivity to external factors and the need for businesses to adapt to changing market dynamics swiftly.
Key Highlights of the Report:
- Denmark Industrial Chain Market Outlook
- Market Size of Denmark Industrial Chain Market, 2025
- Forecast of Denmark Industrial Chain Market, 2032
- Historical Data and Forecast of Denmark Industrial Chain Revenues & Volume for the Period 2022 - 2032F
- Denmark Industrial Chain Market Trend Evolution
- Denmark Industrial Chain Market Drivers and Challenges
- Denmark Industrial Chain Price Trends
- Denmark Industrial Chain Porter's Five Forces
- Denmark Industrial Chain Industry Life Cycle
- Historical Data and Forecast of Denmark Industrial Chain Market Revenues & Volume By Chain Type for the Period 2022 - 2032F
- Historical Data and Forecast of Denmark Industrial Chain Market Revenues & Volume By Roller Chains for the Period 2022 - 2032F
- Historical Data and Forecast of Denmark Industrial Chain Market Revenues & Volume By Leaf Chains for the Period 2022 - 2032F
- Historical Data and Forecast of Denmark Industrial Chain Market Revenues & Volume By Silent Chains for the Period 2022 - 2032F
- Historical Data and Forecast of Denmark Industrial Chain Market Revenues & Volume By Engineered Chains for the Period 2022 - 2032F
- Historical Data and Forecast of Denmark Industrial Chain Market Revenues & Volume By Material Used for the Period 2022 - 2032F
- Historical Data and Forecast of Denmark Industrial Chain Market Revenues & Volume By Stainless Steel for the Period 2022 - 2032F
- Historical Data and Forecast of Denmark Industrial Chain Market Revenues & Volume By Carbon Steel for the Period 2022 - 2032F
- Historical Data and Forecast of Denmark Industrial Chain Market Revenues & Volume By Alloy Steel for the Period 2022 - 2032F
- Historical Data and Forecast of Denmark Industrial Chain Market Revenues & Volume By Nickel-Plated Steel for the Period 2022 - 2032F
- Historical Data and Forecast of Denmark Industrial Chain Market Revenues & Volume By Application for the Period 2022 - 2032F
- Historical Data and Forecast of Denmark Industrial Chain Market Revenues & Volume By Conveyor Systems for the Period 2022 - 2032F
- Historical Data and Forecast of Denmark Industrial Chain Market Revenues & Volume By Power Transmission for the Period 2022 - 2032F
- Historical Data and Forecast of Denmark Industrial Chain Market Revenues & Volume By Lifting Applications for the Period 2022 - 2032F
- Historical Data and Forecast of Denmark Industrial Chain Market Revenues & Volume By Mining & Drilling for the Period 2022 - 2032F
- Historical Data and Forecast of Denmark Industrial Chain Market Revenues & Volume By End User for the Period 2022 - 2032F
- Historical Data and Forecast of Denmark Industrial Chain Market Revenues & Volume By Manufacturing for the Period 2022 - 2032F
- Historical Data and Forecast of Denmark Industrial Chain Market Revenues & Volume By Automotive for the Period 2022 - 2032F
- Historical Data and Forecast of Denmark Industrial Chain Market Revenues & Volume By Construction for the Period 2022 - 2032F
- Historical Data and Forecast of Denmark Industrial Chain Market Revenues & Volume By Oil & Gas for the Period 2022 - 2032F
- Historical Data and Forecast of Denmark Industrial Chain Market Revenues & Volume By Sales Model for the Period 2022 - 2032F
- Historical Data and Forecast of Denmark Industrial Chain Market Revenues & Volume By Direct Sales for the Period 2022 - 2032F
- Historical Data and Forecast of Denmark Industrial Chain Market Revenues & Volume By Distributors for the Period 2022 - 2032F
- Historical Data and Forecast of Denmark Industrial Chain Market Revenues & Volume By Online Suppliers for the Period 2022 - 2032F
- Historical Data and Forecast of Denmark Industrial Chain Market Revenues & Volume By Industrial Suppliers for the Period 2022 - 2032F
- Denmark Industrial Chain Import Export Trade Statistics
- Market Opportunity Assessment By Chain Type
- Market Opportunity Assessment By Material Used
- Market Opportunity Assessment By Application
- Market Opportunity Assessment By End User
- Market Opportunity Assessment By Sales Model
- Denmark Industrial Chain Top Companies Market Share
- Denmark Industrial Chain Competitive Benchmarking By Technical and Operational Parameters
- Denmark Industrial Chain Company Profiles
- Denmark Industrial Chain Key Strategic Recommendations
Frequently Asked Questions About the Market Study (FAQs):
6Wresearch actively monitors the Denmark Industrial Chain Market and publishes its comprehensive annual report, highlighting emerging trends, growth drivers, revenue analysis, and forecast outlook. Our insights help businesses to make data-backed strategic decisions with ongoing market dynamics. Our analysts track relevent industries related to the Denmark Industrial Chain Market, allowing our clients with actionable intelligence and reliable forecasts tailored to emerging regional needs.
Yes, we provide customisation as per your requirements. To learn more, feel free to contact us on sales@6wresearch.com
1 Executive Summary |
2 Introduction |
2.1 Key Highlights of the Report |
2.2 Report Description |
2.3 Market Scope & Segmentation |
2.4 Research Methodology |
2.5 Assumptions |
3 Denmark Industrial Chain Market Overview |
3.1 Denmark Country Macro Economic Indicators |
3.2 Denmark Industrial Chain Market Revenues & Volume, 2022 & 2032F |
3.3 Denmark Industrial Chain Market - Industry Life Cycle |
3.4 Denmark Industrial Chain Market - Porter's Five Forces |
3.5 Denmark Industrial Chain Market Revenues & Volume Share, By Chain Type, 2022 & 2032F |
3.6 Denmark Industrial Chain Market Revenues & Volume Share, By Material Used, 2022 & 2032F |
3.7 Denmark Industrial Chain Market Revenues & Volume Share, By Application, 2022 & 2032F |
3.8 Denmark Industrial Chain Market Revenues & Volume Share, By End User, 2022 & 2032F |
3.9 Denmark Industrial Chain Market Revenues & Volume Share, By Sales Model, 2022 & 2032F |
4 Denmark Industrial Chain Market Dynamics |
4.1 Impact Analysis |
4.2 Market Drivers |
4.2.1 Increasing demand for industrial chains in Denmark due to growth in manufacturing and construction sectors |
4.2.2 Adoption of automation and Industry 4.0 technologies driving the need for advanced industrial chains |
4.2.3 Government initiatives promoting sustainable practices and energy-efficient solutions in industries |
4.3 Market Restraints |
4.3.1 Fluctuating raw material prices impacting the cost of production for industrial chains |
4.3.2 Intense competition from international manufacturers affecting the market share of local industrial chain suppliers |
4.3.3 Economic uncertainties leading to fluctuations in investments in industrial infrastructure |
5 Denmark Industrial Chain Market Trends |
6 Denmark Industrial Chain Market, By Types |
6.1 Denmark Industrial Chain Market, By Chain Type |
6.1.1 Overview and Analysis |
6.1.2 Denmark Industrial Chain Market Revenues & Volume, By Chain Type, 2022 - 2032F |
6.1.3 Denmark Industrial Chain Market Revenues & Volume, By Roller Chains, 2022 - 2032F |
6.1.4 Denmark Industrial Chain Market Revenues & Volume, By Leaf Chains, 2022 - 2032F |
6.1.5 Denmark Industrial Chain Market Revenues & Volume, By Silent Chains, 2022 - 2032F |
6.1.6 Denmark Industrial Chain Market Revenues & Volume, By Engineered Chains, 2022 - 2032F |
6.2 Denmark Industrial Chain Market, By Material Used |
6.2.1 Overview and Analysis |
6.2.2 Denmark Industrial Chain Market Revenues & Volume, By Stainless Steel, 2022 - 2032F |
6.2.3 Denmark Industrial Chain Market Revenues & Volume, By Carbon Steel, 2022 - 2032F |
6.2.4 Denmark Industrial Chain Market Revenues & Volume, By Alloy Steel, 2022 - 2032F |
6.2.5 Denmark Industrial Chain Market Revenues & Volume, By Nickel-Plated Steel, 2022 - 2032F |
6.3 Denmark Industrial Chain Market, By Application |
6.3.1 Overview and Analysis |
6.3.2 Denmark Industrial Chain Market Revenues & Volume, By Conveyor Systems, 2022 - 2032F |
6.3.3 Denmark Industrial Chain Market Revenues & Volume, By Power Transmission, 2022 - 2032F |
6.3.4 Denmark Industrial Chain Market Revenues & Volume, By Lifting Applications, 2022 - 2032F |
6.3.5 Denmark Industrial Chain Market Revenues & Volume, By Mining & Drilling, 2022 - 2032F |
6.4 Denmark Industrial Chain Market, By End User |
6.4.1 Overview and Analysis |
6.4.2 Denmark Industrial Chain Market Revenues & Volume, By Manufacturing, 2022 - 2032F |
6.4.3 Denmark Industrial Chain Market Revenues & Volume, By Automotive, 2022 - 2032F |
6.4.4 Denmark Industrial Chain Market Revenues & Volume, By Construction, 2022 - 2032F |
6.4.5 Denmark Industrial Chain Market Revenues & Volume, By Oil & Gas, 2022 - 2032F |
6.5 Denmark Industrial Chain Market, By Sales Model |
6.5.1 Overview and Analysis |
6.5.2 Denmark Industrial Chain Market Revenues & Volume, By Direct Sales, 2022 - 2032F |
6.5.3 Denmark Industrial Chain Market Revenues & Volume, By Distributors, 2022 - 2032F |
6.5.4 Denmark Industrial Chain Market Revenues & Volume, By Online Suppliers, 2022 - 2032F |
6.5.5 Denmark Industrial Chain Market Revenues & Volume, By Industrial Suppliers, 2022 - 2032F |
7 Denmark Industrial Chain Market Import-Export Trade Statistics |
7.1 Denmark Industrial Chain Market Export to Major Countries |
7.2 Denmark Industrial Chain Market Imports from Major Countries |
8 Denmark Industrial Chain Market Key Performance Indicators |
8.1 Number of new industrial projects initiated in Denmark |
8.2 Adoption rate of automation technologies in the manufacturing sector |
8.3 Percentage of industrial chains in use that are environmentally sustainable and energy-efficient |
8.4 Research and development expenditure focused on innovative industrial chain solutions |
8.5 Percentage of industrial chain suppliers with ISO certification for quality management |
9 Denmark Industrial Chain Market - Opportunity Assessment |
9.1 Denmark Industrial Chain Market Opportunity Assessment, By Chain Type, 2022 & 2032F |
9.2 Denmark Industrial Chain Market Opportunity Assessment, By Material Used, 2022 & 2032F |
9.3 Denmark Industrial Chain Market Opportunity Assessment, By Application, 2022 & 2032F |
9.4 Denmark Industrial Chain Market Opportunity Assessment, By End User, 2022 & 2032F |
9.5 Denmark Industrial Chain Market Opportunity Assessment, By Sales Model, 2022 & 2032F |
10 Denmark Industrial Chain Market - Competitive Landscape |
10.1 Denmark Industrial Chain Market Revenue Share, By Companies, 2025 |
10.2 Denmark Industrial Chain Market Competitive Benchmarking, By Operating and Technical Parameters |
11 Company Profiles |
12 Recommendations |
13 Disclaimer |
Global Go To Market Strategy - 2030
Export potential enables firms to identify high-growth global markets with greater confidence by combining advanced trade intelligence with a structured quantitative methodology. The framework analyzes emerging demand trends and country-level import patterns while integrating macroeconomic and trade datasets such as GDP and population forecasts, bilateral import–export flows, tariff structures, elasticity differentials between developed and developing economies, geographic distance, and import demand projections. Using weighted trade values from 2020–2024 as the base period to project country-to-country export potential for 2030, these inputs are operationalized through calculated drivers such as gravity model parameters, tariff impact factors, and projected GDP per-capita growth. Through an analysis of hidden potentials, demand hotspots, and market conditions that are most favorable to success, this method enables firms to focus on target countries, maximize returns, and global expansion with data, backed by accuracy.
By factoring in the projected importer demand gap that is currently unmet and could be potential opportunity, it identifies the potential for the Exporter (Country) among 190 countries, against the general trade analysis, which identifies the biggest importer or exporter.
To discover high-growth global markets and optimize your business strategy:
Click Here
Pricing
- Single User License$ 1,995
- Department License$ 2,400
- Site License$ 3,120
- Global License$ 3,795

Leadership Perspectives from Industry Events
Search
Thought Leadership and Analyst Meet


Our Clients
6WResearch In News
- Doha a strategic location for EV manufacturing hub: IPA Qatar
- Demand for luxury TVs surging in the GCC, says Samsung
- Empowering Growth: The Thriving Journey of Bangladesh’s Cable Industry
- Demand for luxury TVs surging in the GCC, says Samsung
- Video call with a traditional healer? Once unthinkable, it’s now common in South Africa
- Intelligent Buildings To Smooth GCC’s Path To Net Zero
Latest Reports
- Taiwan Airport Wireless Infrastructure Market (2026-2032)
- Vietnam Airport Wireless Infrastructure Market (2026-2032)
- Thailand Airport Wireless Infrastructure Market (2026-2032)
- South Korea Airport Wireless Infrastructure Market (2026-2032)
- Romania Airport Wireless Infrastructure Market (2026-2032)
- Qatar Airport Wireless Infrastructure Market (2026-2032)
- Philippines Airport Wireless Infrastructure Market (2026-2032)
- Japan Airport Wireless Infrastructure Market (2026-2032)
- Taiwan Airport Winter Services Market (2026-2032)
- Vietnam Airport Winter Services Market (2026-2032)
Industry Events and Analyst Meet

HIMTEX 2026

India Refining Summit 2026

India EV Show 2026

EV tech India Expo 2026

Auto Tech Asia 2026
Whitepaper
- Middle East & Africa Commercial Security Market Click here to view more.
- Middle East & Africa Fire Safety Systems & Equipment Market Click here to view more.
- GCC Drone Market Click here to view more.
- Middle East Lighting Fixture Market Click here to view more.
- GCC Physical & Perimeter Security Market Click here to view more.