Denmark Motorcycle Drive Chain Market (2026-2032) | Growth, Forecast, Outlook, Companies, Trends, Value, Competitive Landscape, Industry, Share, Segmentation, Analysis, Size & Revenue
Market Forecast By Types (Standard, Cruiser, Sports, Off-Road), By Chain type (Standard Rolling Chain, O Ring Chain, X Ring Chain), By Engine Capacity (Up to 150 CC, 151-300 CC, 301-500 CC, Above 500 CC), By Material Type (Mild Steel, Cast Steel, Cast Iron), By Distribution Channel (Online, Offline) And Competitive Landscape
| Product Code: ETC6964296 | Publication Date: Sep 2024 | Updated Date: Apr 2026 | Product Type: Market Research Report | |
| Publisher: 6Wresearch | Author: Dhaval Chaurasia | No. of Pages: 75 | No. of Figures: 35 | No. of Tables: 20 |
Denmark Motorcycle Drive Chain Market Size (2020-2030)
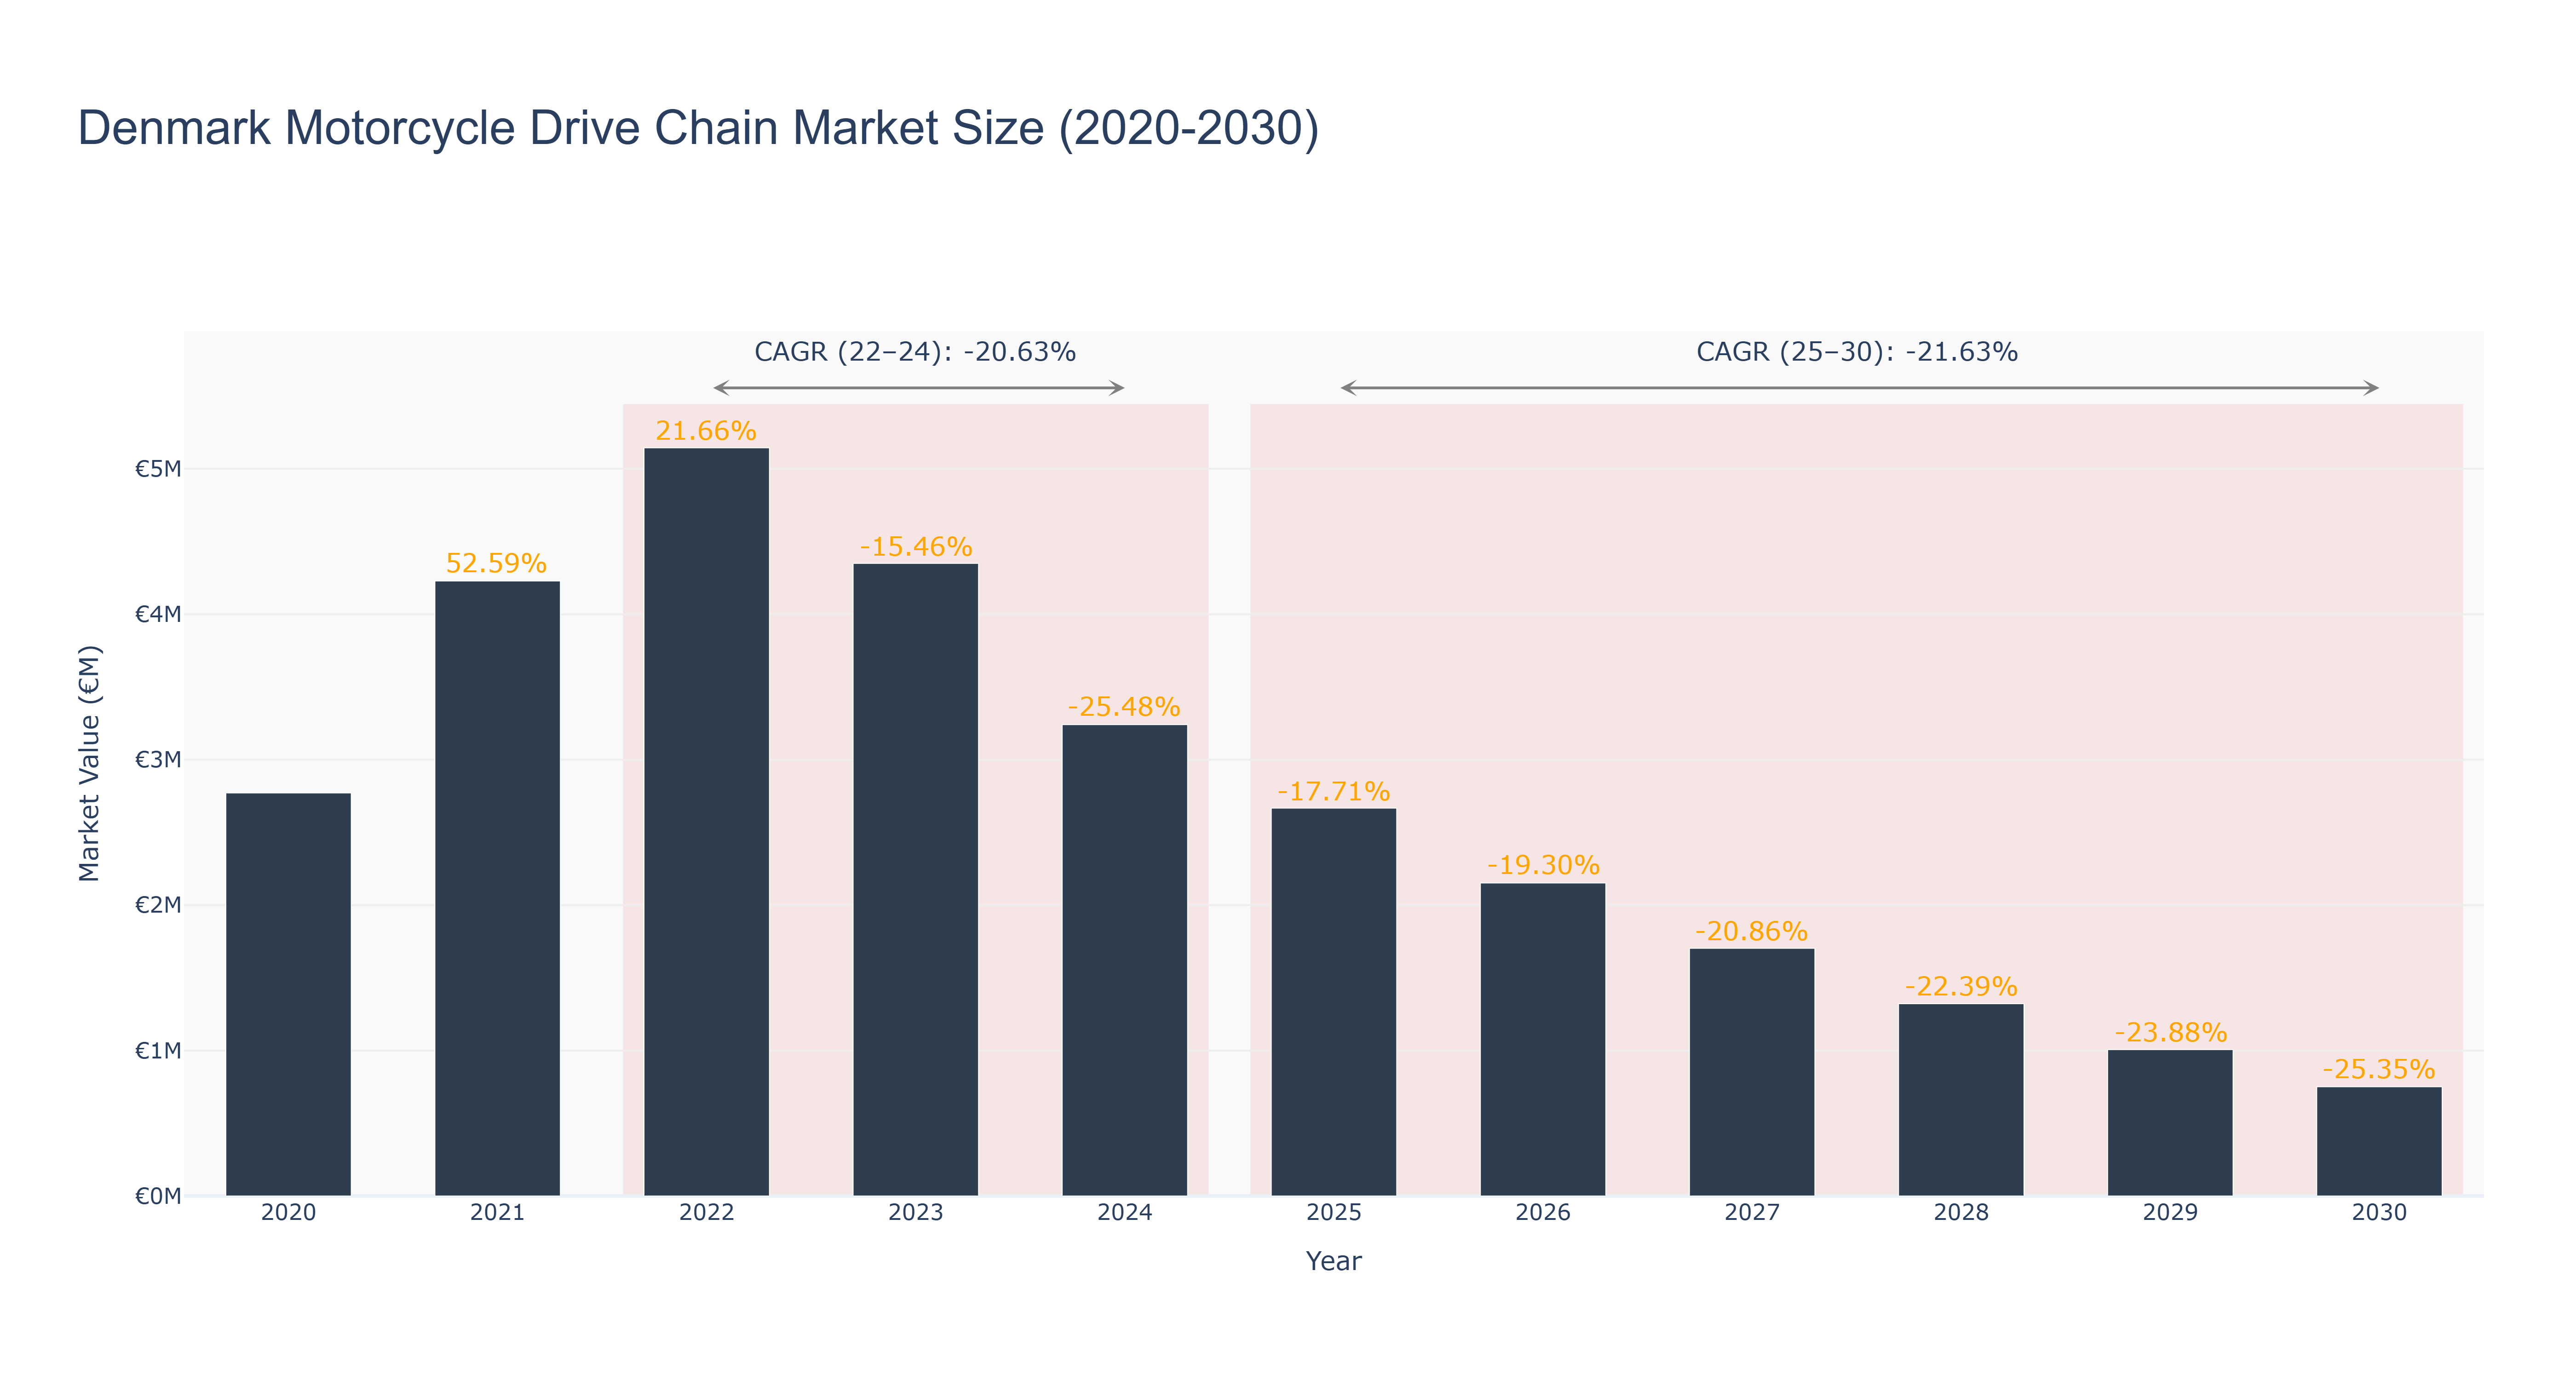
Denmark Motorcycle Drive Chain Market has witnessed a notable decline in market size over the years. The peak market size of €5.14 million was recorded in 2022, followed by a steady decrease to €2.15 million in 2026. The market is forecasted to further decrease to €0.75 million by 2030, with a CAGR of -21.63% from 2025 to 2030. The industry drivers for this downward trend could include evolving consumer preferences towards alternative transportation modes and advancements in electric vehicle technology. In light of these market dynamics, future developments in Denmark may focus on sustainability initiatives and innovation in motorcycle drive chain technologies to adapt to changing market demands.
Denmark Motorcycle Drive Chain Market: Production & Trade Performance (2019-2025)
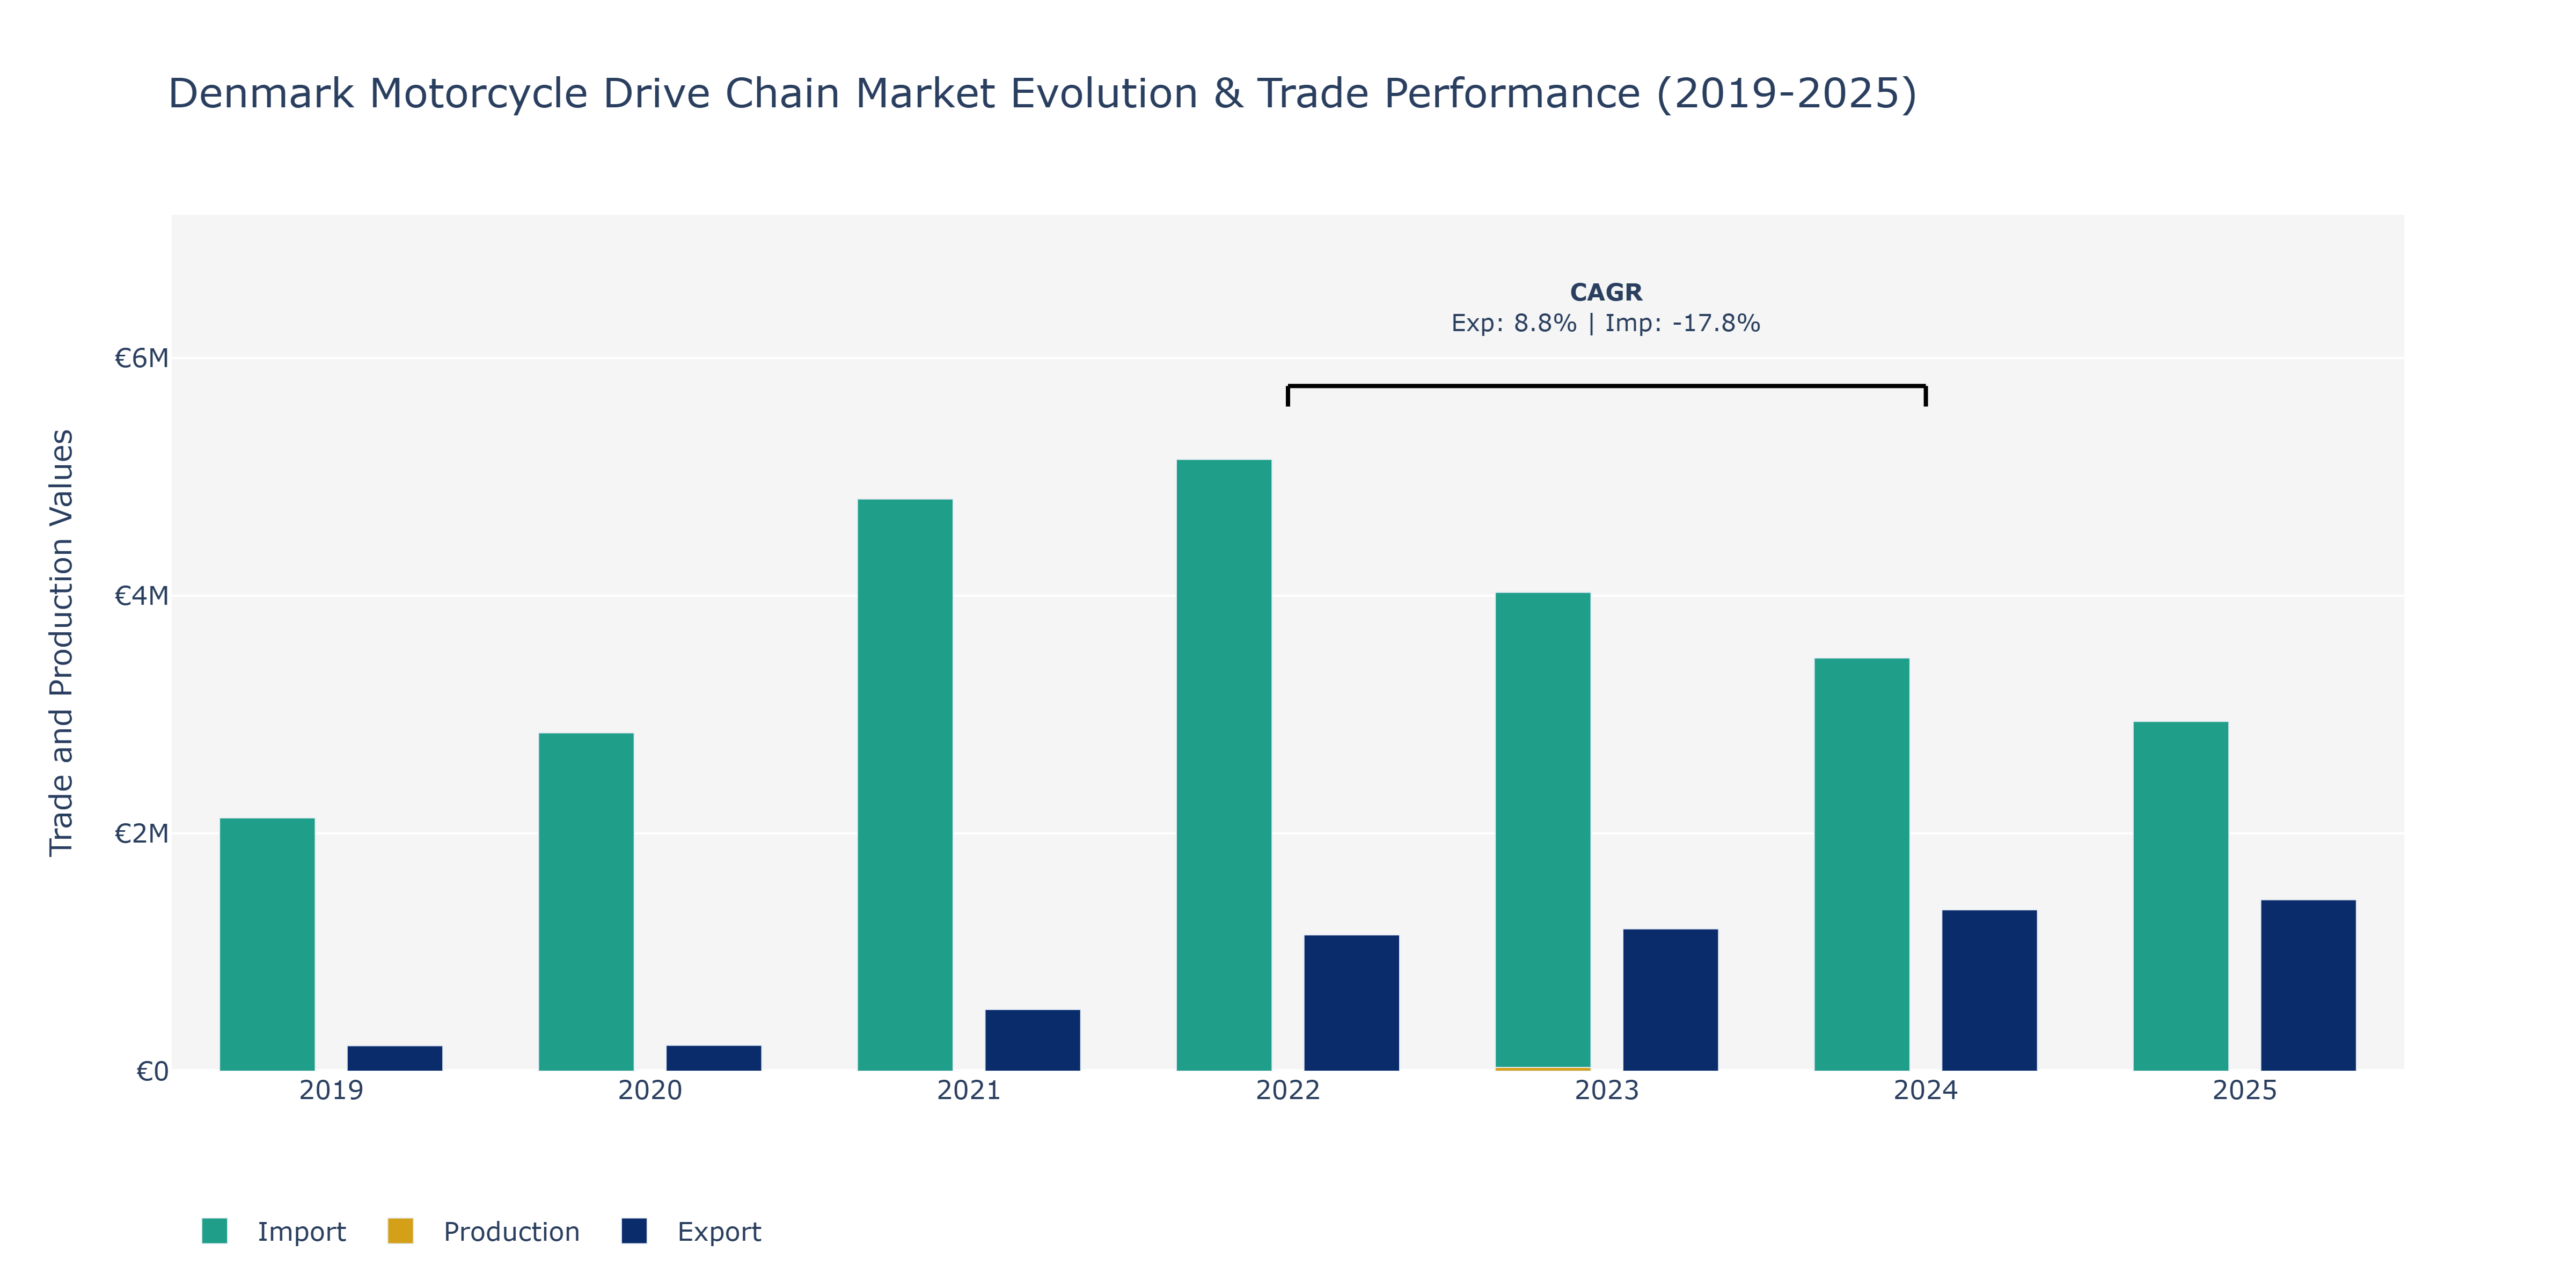
In the Denmark Motorcycle Drive Chain Market, exports showcased a steady growth from 2019 to 2025, increasing from €213.99 thousand in 2019 to around €1.44 million in 2025. Imports, on the other hand, experienced fluctuations during the period, climbing to €2.85 million in 2020 before declining to approximately €2.94 million in 2025. The surge in exports can be attributed to the rising demand for motorcycles and the country's strong manufacturing capabilities. Fluctuations in imports could be influenced by global economic conditions affecting trade flows and supply chain disruptions. Companies in the market may need to focus on optimizing supply chains and exploring new markets to navigate such fluctuations effectively.
Key Highlights of the Report:
- Denmark Motorcycle Drive Chain Market Outlook
- Market Size of Denmark Motorcycle Drive Chain Market, 2025
- Forecast of Denmark Motorcycle Drive Chain Market, 2032
- Historical Data and Forecast of Denmark Motorcycle Drive Chain Revenues & Volume for the Period 2022 - 2032
- Denmark Motorcycle Drive Chain Market Trend Evolution
- Denmark Motorcycle Drive Chain Market Drivers and Challenges
- Denmark Motorcycle Drive Chain Price Trends
- Denmark Motorcycle Drive Chain Porter's Five Forces
- Denmark Motorcycle Drive Chain Industry Life Cycle
- Historical Data and Forecast of Denmark Motorcycle Drive Chain Market Revenues & Volume By Types for the Period 2022 - 2032
- Historical Data and Forecast of Denmark Motorcycle Drive Chain Market Revenues & Volume By Standard for the Period 2022 - 2032
- Historical Data and Forecast of Denmark Motorcycle Drive Chain Market Revenues & Volume By Cruiser for the Period 2022 - 2032
- Historical Data and Forecast of Denmark Motorcycle Drive Chain Market Revenues & Volume By Sports for the Period 2022 - 2032
- Historical Data and Forecast of Denmark Motorcycle Drive Chain Market Revenues & Volume By Off-Road for the Period 2022 - 2032
- Historical Data and Forecast of Denmark Motorcycle Drive Chain Market Revenues & Volume By Chain type for the Period 2022 - 2032
- Historical Data and Forecast of Denmark Motorcycle Drive Chain Market Revenues & Volume By Standard Rolling Chain for the Period 2022 - 2032
- Historical Data and Forecast of Denmark Motorcycle Drive Chain Market Revenues & Volume By O Ring Chain for the Period 2022 - 2032
- Historical Data and Forecast of Denmark Motorcycle Drive Chain Market Revenues & Volume By X Ring Chain for the Period 2022 - 2032
- Historical Data and Forecast of Denmark Motorcycle Drive Chain Market Revenues & Volume By Engine Capacity for the Period 2022 - 2032
- Historical Data and Forecast of Denmark Motorcycle Drive Chain Market Revenues & Volume By Up to 150 CC for the Period 2022 - 2032
- Historical Data and Forecast of Denmark Motorcycle Drive Chain Market Revenues & Volume By 151-300 CC for the Period 2022 - 2032
- Historical Data and Forecast of Denmark Motorcycle Drive Chain Market Revenues & Volume By 301-500 CC for the Period 2022 - 2032
- Historical Data and Forecast of Denmark Motorcycle Drive Chain Market Revenues & Volume By Above 500 CC for the Period 2022 - 2032
- Historical Data and Forecast of Denmark Motorcycle Drive Chain Market Revenues & Volume By Material Type for the Period 2022 - 2032
- Historical Data and Forecast of Denmark Motorcycle Drive Chain Market Revenues & Volume By Mild Steel for the Period 2022 - 2032
- Historical Data and Forecast of Denmark Motorcycle Drive Chain Market Revenues & Volume By Cast Steel for the Period 2022 - 2032
- Historical Data and Forecast of Denmark Motorcycle Drive Chain Market Revenues & Volume By Cast Iron for the Period 2022 - 2032
- Historical Data and Forecast of Denmark Motorcycle Drive Chain Market Revenues & Volume By Distribution Channel for the Period 2022 - 2032
- Historical Data and Forecast of Denmark Motorcycle Drive Chain Market Revenues & Volume By Online for the Period 2022 - 2032
- Historical Data and Forecast of Denmark Motorcycle Drive Chain Market Revenues & Volume By Offline for the Period 2022 - 2032
- Denmark Motorcycle Drive Chain Import Export Trade Statistics
- Market Opportunity Assessment By Types
- Market Opportunity Assessment By Chain type
- Market Opportunity Assessment By Engine Capacity
- Market Opportunity Assessment By Material Type
- Market Opportunity Assessment By Distribution Channel
- Denmark Motorcycle Drive Chain Top Companies Market Share
- Denmark Motorcycle Drive Chain Competitive Benchmarking By Technical and Operational Parameters
- Denmark Motorcycle Drive Chain Company Profiles
- Denmark Motorcycle Drive Chain Key Strategic Recommendations
Frequently Asked Questions About the Market Study (FAQs):
6Wresearch actively monitors the Denmark Motorcycle Drive Chain Market and publishes its comprehensive annual report, highlighting emerging trends, growth drivers, revenue analysis, and forecast outlook. Our insights help businesses to make data-backed strategic decisions with ongoing market dynamics. Our analysts track relevent industries related to the Denmark Motorcycle Drive Chain Market, allowing our clients with actionable intelligence and reliable forecasts tailored to emerging regional needs.
Yes, we provide customisation as per your requirements. To learn more, feel free to contact us on sales@6wresearch.com
1 Executive Summary |
2 Introduction |
2.1 Key Highlights of the Report |
2.2 Report Description |
2.3 Market Scope & Segmentation |
2.4 Research Methodology |
2.5 Assumptions |
3 Denmark Motorcycle Drive Chain Market Overview |
3.1 Denmark Country Macro Economic Indicators |
3.2 Denmark Motorcycle Drive Chain Market Revenues & Volume, 2022 & 2032F |
3.3 Denmark Motorcycle Drive Chain Market - Industry Life Cycle |
3.4 Denmark Motorcycle Drive Chain Market - Porter's Five Forces |
3.5 Denmark Motorcycle Drive Chain Market Revenues & Volume Share, By Types, 2022 & 2032F |
3.6 Denmark Motorcycle Drive Chain Market Revenues & Volume Share, By Chain type, 2022 & 2032F |
3.7 Denmark Motorcycle Drive Chain Market Revenues & Volume Share, By Engine Capacity, 2022 & 2032F |
3.8 Denmark Motorcycle Drive Chain Market Revenues & Volume Share, By Material Type, 2022 & 2032F |
3.9 Denmark Motorcycle Drive Chain Market Revenues & Volume Share, By Distribution Channel, 2022 & 2032F |
4 Denmark Motorcycle Drive Chain Market Dynamics |
4.1 Impact Analysis |
4.2 Market Drivers |
4.2.1 Increasing demand for motorcycles in Denmark |
4.2.2 Growth in motorcycle tourism and recreational activities |
4.2.3 Technological advancements in drive chain materials and manufacturing processes |
4.3 Market Restraints |
4.3.1 High initial cost of premium motorcycle drive chains |
4.3.2 Impact of economic downturn on consumer purchasing power |
4.3.3 Environmental regulations and concerns influencing material choices |
5 Denmark Motorcycle Drive Chain Market Trends |
6 Denmark Motorcycle Drive Chain Market, By Types |
6.1 Denmark Motorcycle Drive Chain Market, By Types |
6.1.1 Overview and Analysis |
6.1.2 Denmark Motorcycle Drive Chain Market Revenues & Volume, By Types, 2022 - 2032F |
6.1.3 Denmark Motorcycle Drive Chain Market Revenues & Volume, By Standard, 2022 - 2032F |
6.1.4 Denmark Motorcycle Drive Chain Market Revenues & Volume, By Cruiser, 2022 - 2032F |
6.1.5 Denmark Motorcycle Drive Chain Market Revenues & Volume, By Sports, 2022 - 2032F |
6.1.6 Denmark Motorcycle Drive Chain Market Revenues & Volume, By Off-Road, 2022 - 2032F |
6.2 Denmark Motorcycle Drive Chain Market, By Chain type |
6.2.1 Overview and Analysis |
6.2.2 Denmark Motorcycle Drive Chain Market Revenues & Volume, By Standard Rolling Chain, 2022 - 2032F |
6.2.3 Denmark Motorcycle Drive Chain Market Revenues & Volume, By O Ring Chain, 2022 - 2032F |
6.2.4 Denmark Motorcycle Drive Chain Market Revenues & Volume, By X Ring Chain, 2022 - 2032F |
6.3 Denmark Motorcycle Drive Chain Market, By Engine Capacity |
6.3.1 Overview and Analysis |
6.3.2 Denmark Motorcycle Drive Chain Market Revenues & Volume, By Up to 150 CC, 2022 - 2032F |
6.3.3 Denmark Motorcycle Drive Chain Market Revenues & Volume, By 151-300 CC, 2022 - 2032F |
6.3.4 Denmark Motorcycle Drive Chain Market Revenues & Volume, By 301-500 CC, 2022 - 2032F |
6.3.5 Denmark Motorcycle Drive Chain Market Revenues & Volume, By Above 500 CC, 2022 - 2032F |
6.4 Denmark Motorcycle Drive Chain Market, By Material Type |
6.4.1 Overview and Analysis |
6.4.2 Denmark Motorcycle Drive Chain Market Revenues & Volume, By Mild Steel, 2022 - 2032F |
6.4.3 Denmark Motorcycle Drive Chain Market Revenues & Volume, By Cast Steel, 2022 - 2032F |
6.4.4 Denmark Motorcycle Drive Chain Market Revenues & Volume, By Cast Iron, 2022 - 2032F |
6.5 Denmark Motorcycle Drive Chain Market, By Distribution Channel |
6.5.1 Overview and Analysis |
6.5.2 Denmark Motorcycle Drive Chain Market Revenues & Volume, By Online, 2022 - 2032F |
6.5.3 Denmark Motorcycle Drive Chain Market Revenues & Volume, By Offline, 2022 - 2032F |
7 Denmark Motorcycle Drive Chain Market Import-Export Trade Statistics |
7.1 Denmark Motorcycle Drive Chain Market Export to Major Countries |
7.2 Denmark Motorcycle Drive Chain Market Imports from Major Countries |
8 Denmark Motorcycle Drive Chain Market Key Performance Indicators |
8.1 Average age of motorcycles in Denmark |
8.2 Number of motorcycle events and tours organized in the country |
8.3 Adoption rate of eco-friendly drive chain technologies |
9 Denmark Motorcycle Drive Chain Market - Opportunity Assessment |
9.1 Denmark Motorcycle Drive Chain Market Opportunity Assessment, By Types, 2022 & 2032F |
9.2 Denmark Motorcycle Drive Chain Market Opportunity Assessment, By Chain type, 2022 & 2032F |
9.3 Denmark Motorcycle Drive Chain Market Opportunity Assessment, By Engine Capacity, 2022 & 2032F |
9.4 Denmark Motorcycle Drive Chain Market Opportunity Assessment, By Material Type, 2022 & 2032F |
9.5 Denmark Motorcycle Drive Chain Market Opportunity Assessment, By Distribution Channel, 2022 & 2032F |
10 Denmark Motorcycle Drive Chain Market - Competitive Landscape |
10.1 Denmark Motorcycle Drive Chain Market Revenue Share, By Companies, 2025 |
10.2 Denmark Motorcycle Drive Chain Market Competitive Benchmarking, By Operating and Technical Parameters |
11 Company Profiles |
12 Recommendations |
13 Disclaimer |
Global Go To Market Strategy - 2030
Export potential enables firms to identify high-growth global markets with greater confidence by combining advanced trade intelligence with a structured quantitative methodology. The framework analyzes emerging demand trends and country-level import patterns while integrating macroeconomic and trade datasets such as GDP and population forecasts, bilateral import–export flows, tariff structures, elasticity differentials between developed and developing economies, geographic distance, and import demand projections. Using weighted trade values from 2020–2024 as the base period to project country-to-country export potential for 2030, these inputs are operationalized through calculated drivers such as gravity model parameters, tariff impact factors, and projected GDP per-capita growth. Through an analysis of hidden potentials, demand hotspots, and market conditions that are most favorable to success, this method enables firms to focus on target countries, maximize returns, and global expansion with data, backed by accuracy.
By factoring in the projected importer demand gap that is currently unmet and could be potential opportunity, it identifies the potential for the Exporter (Country) among 190 countries, against the general trade analysis, which identifies the biggest importer or exporter.
To discover high-growth global markets and optimize your business strategy:
Click Here
Pricing
- Single User License$ 1,995
- Department License$ 2,400
- Site License$ 3,120
- Global License$ 3,795

Leadership Perspectives from Industry Events
Search
Thought Leadership and Analyst Meet


Our Clients
6WResearch In News
- Doha a strategic location for EV manufacturing hub: IPA Qatar
- Demand for luxury TVs surging in the GCC, says Samsung
- Empowering Growth: The Thriving Journey of Bangladesh’s Cable Industry
- Demand for luxury TVs surging in the GCC, says Samsung
- Video call with a traditional healer? Once unthinkable, it’s now common in South Africa
- Intelligent Buildings To Smooth GCC’s Path To Net Zero
Latest Reports
- Taiwan Airport Wireless Infrastructure Market (2026-2032)
- Vietnam Airport Wireless Infrastructure Market (2026-2032)
- Thailand Airport Wireless Infrastructure Market (2026-2032)
- South Korea Airport Wireless Infrastructure Market (2026-2032)
- Romania Airport Wireless Infrastructure Market (2026-2032)
- Qatar Airport Wireless Infrastructure Market (2026-2032)
- Philippines Airport Wireless Infrastructure Market (2026-2032)
- Japan Airport Wireless Infrastructure Market (2026-2032)
- Taiwan Airport Winter Services Market (2026-2032)
- Vietnam Airport Winter Services Market (2026-2032)
Industry Events and Analyst Meet

HIMTEX 2026

India Refining Summit 2026

India EV Show 2026

EV tech India Expo 2026

Auto Tech Asia 2026
Whitepaper
- Middle East & Africa Commercial Security Market Click here to view more.
- Middle East & Africa Fire Safety Systems & Equipment Market Click here to view more.
- GCC Drone Market Click here to view more.
- Middle East Lighting Fixture Market Click here to view more.
- GCC Physical & Perimeter Security Market Click here to view more.