Belgium Motorcycle Drive Chain Market (2026-2032) | Share, Competitive Landscape, Analysis, Industry, Size & Revenue, Growth, Forecast, Outlook, Companies, Value, Trends, Segmentation
Market Forecast By Types (Standard, Cruiser, Sports, Off-Road), By Chain type (Standard Rolling Chain, O Ring Chain, X Ring Chain), By Engine Capacity (Up to 150 CC, 151-300 CC, 301-500 CC, Above 500 CC), By Material Type (Mild Steel, Cast Steel, Cast Iron), By Distribution Channel (Online, Offline) And Competitive Landscape
| Product Code: ETC6358656 | Publication Date: Sep 2024 | Updated Date: Apr 2026 | Product Type: Market Research Report | |
| Publisher: 6Wresearch | Author: Dhaval Chaurasia | No. of Pages: 75 | No. of Figures: 35 | No. of Tables: 20 |
Belgium Motorcycle Drive Chain Market Size (2020-2030)
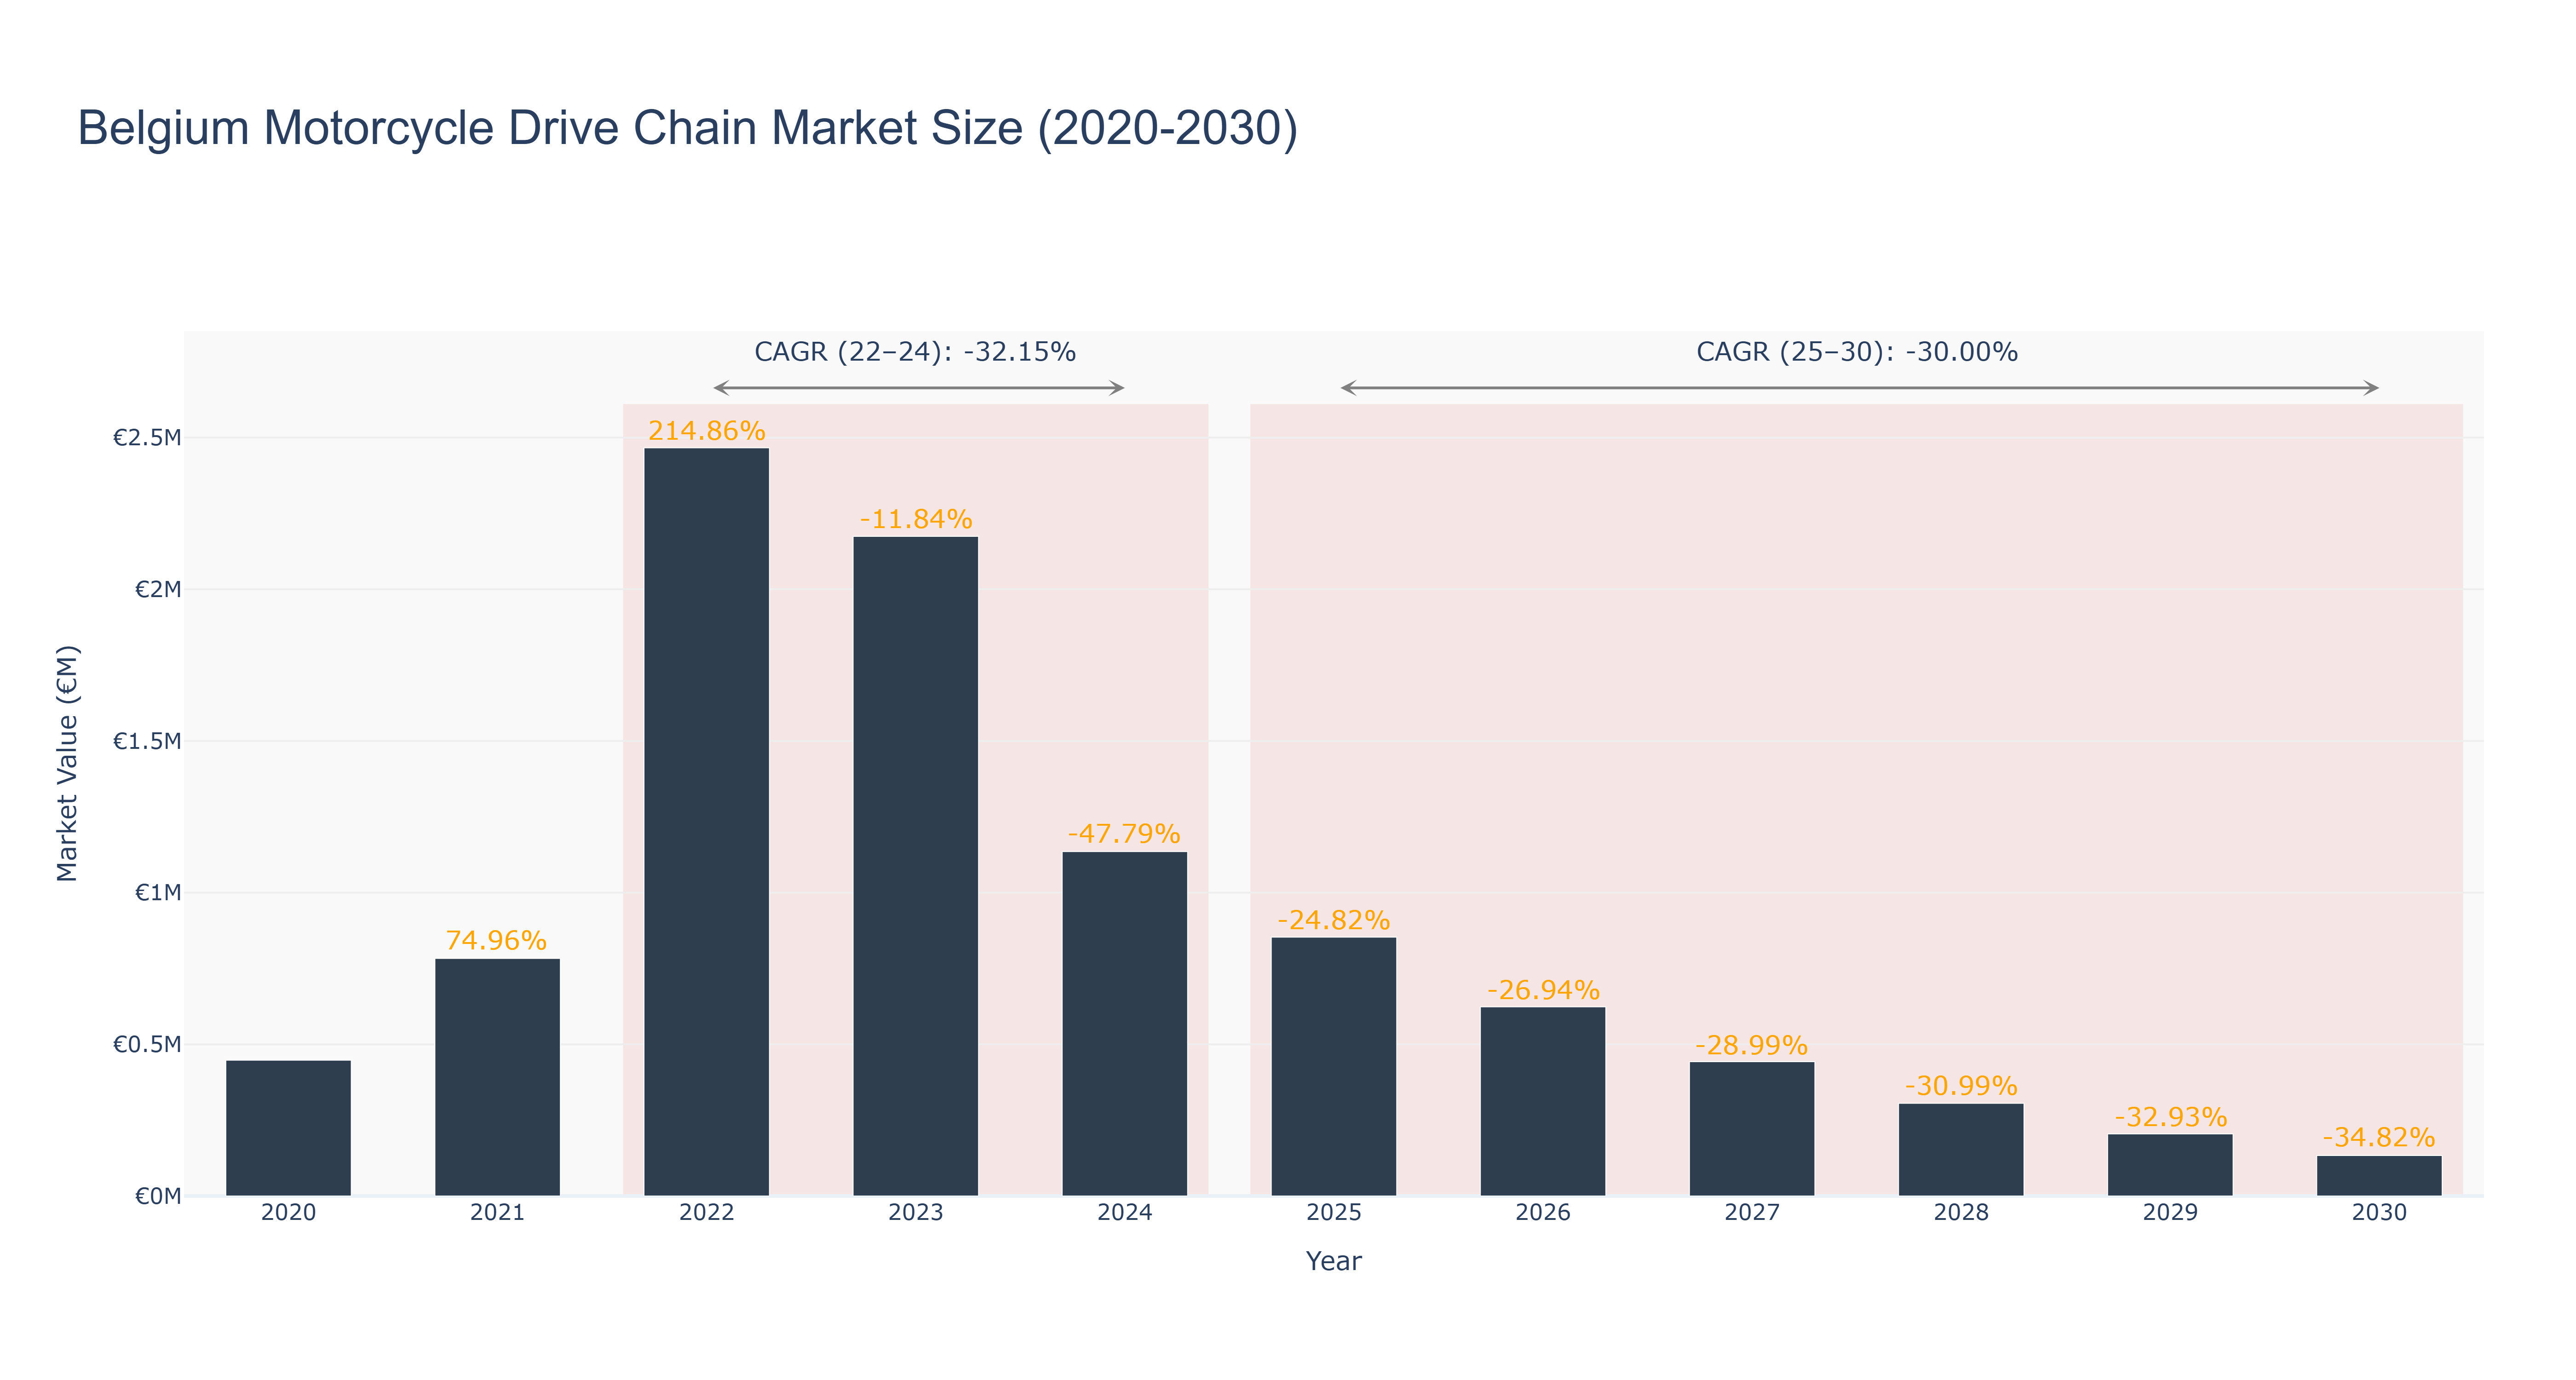
Belgium Motorcycle Drive Chain Market has witnessed fluctuating trends in recent years. The market peaked at €2.47 million in 2022, followed by a sharp decline to €1.14 million in 2024. The forecasted market size is expected to continue decreasing from €0.85 million in 2025 to €0.13 million in 2030, with a CAGR of -30.0% from 2025 to 2030. The market's downfall can be attributed to various factors such as economic uncertainties, changing consumer preferences, and technological advancements in alternative transportation modes. Despite the challenging market conditions, there are upcoming projects in Belgium focusing on sustainable mobility initiatives, including the integration of electric motorcycles powered by innovative drive chain technologies. These developments aim to drive growth opportunities in the motorcycle drive chain market amidst evolving industry drivers like environmental regulations and sustainability goals.
Belgium Motorcycle Drive Chain Market: Production & Trade Performance (2019-2025)
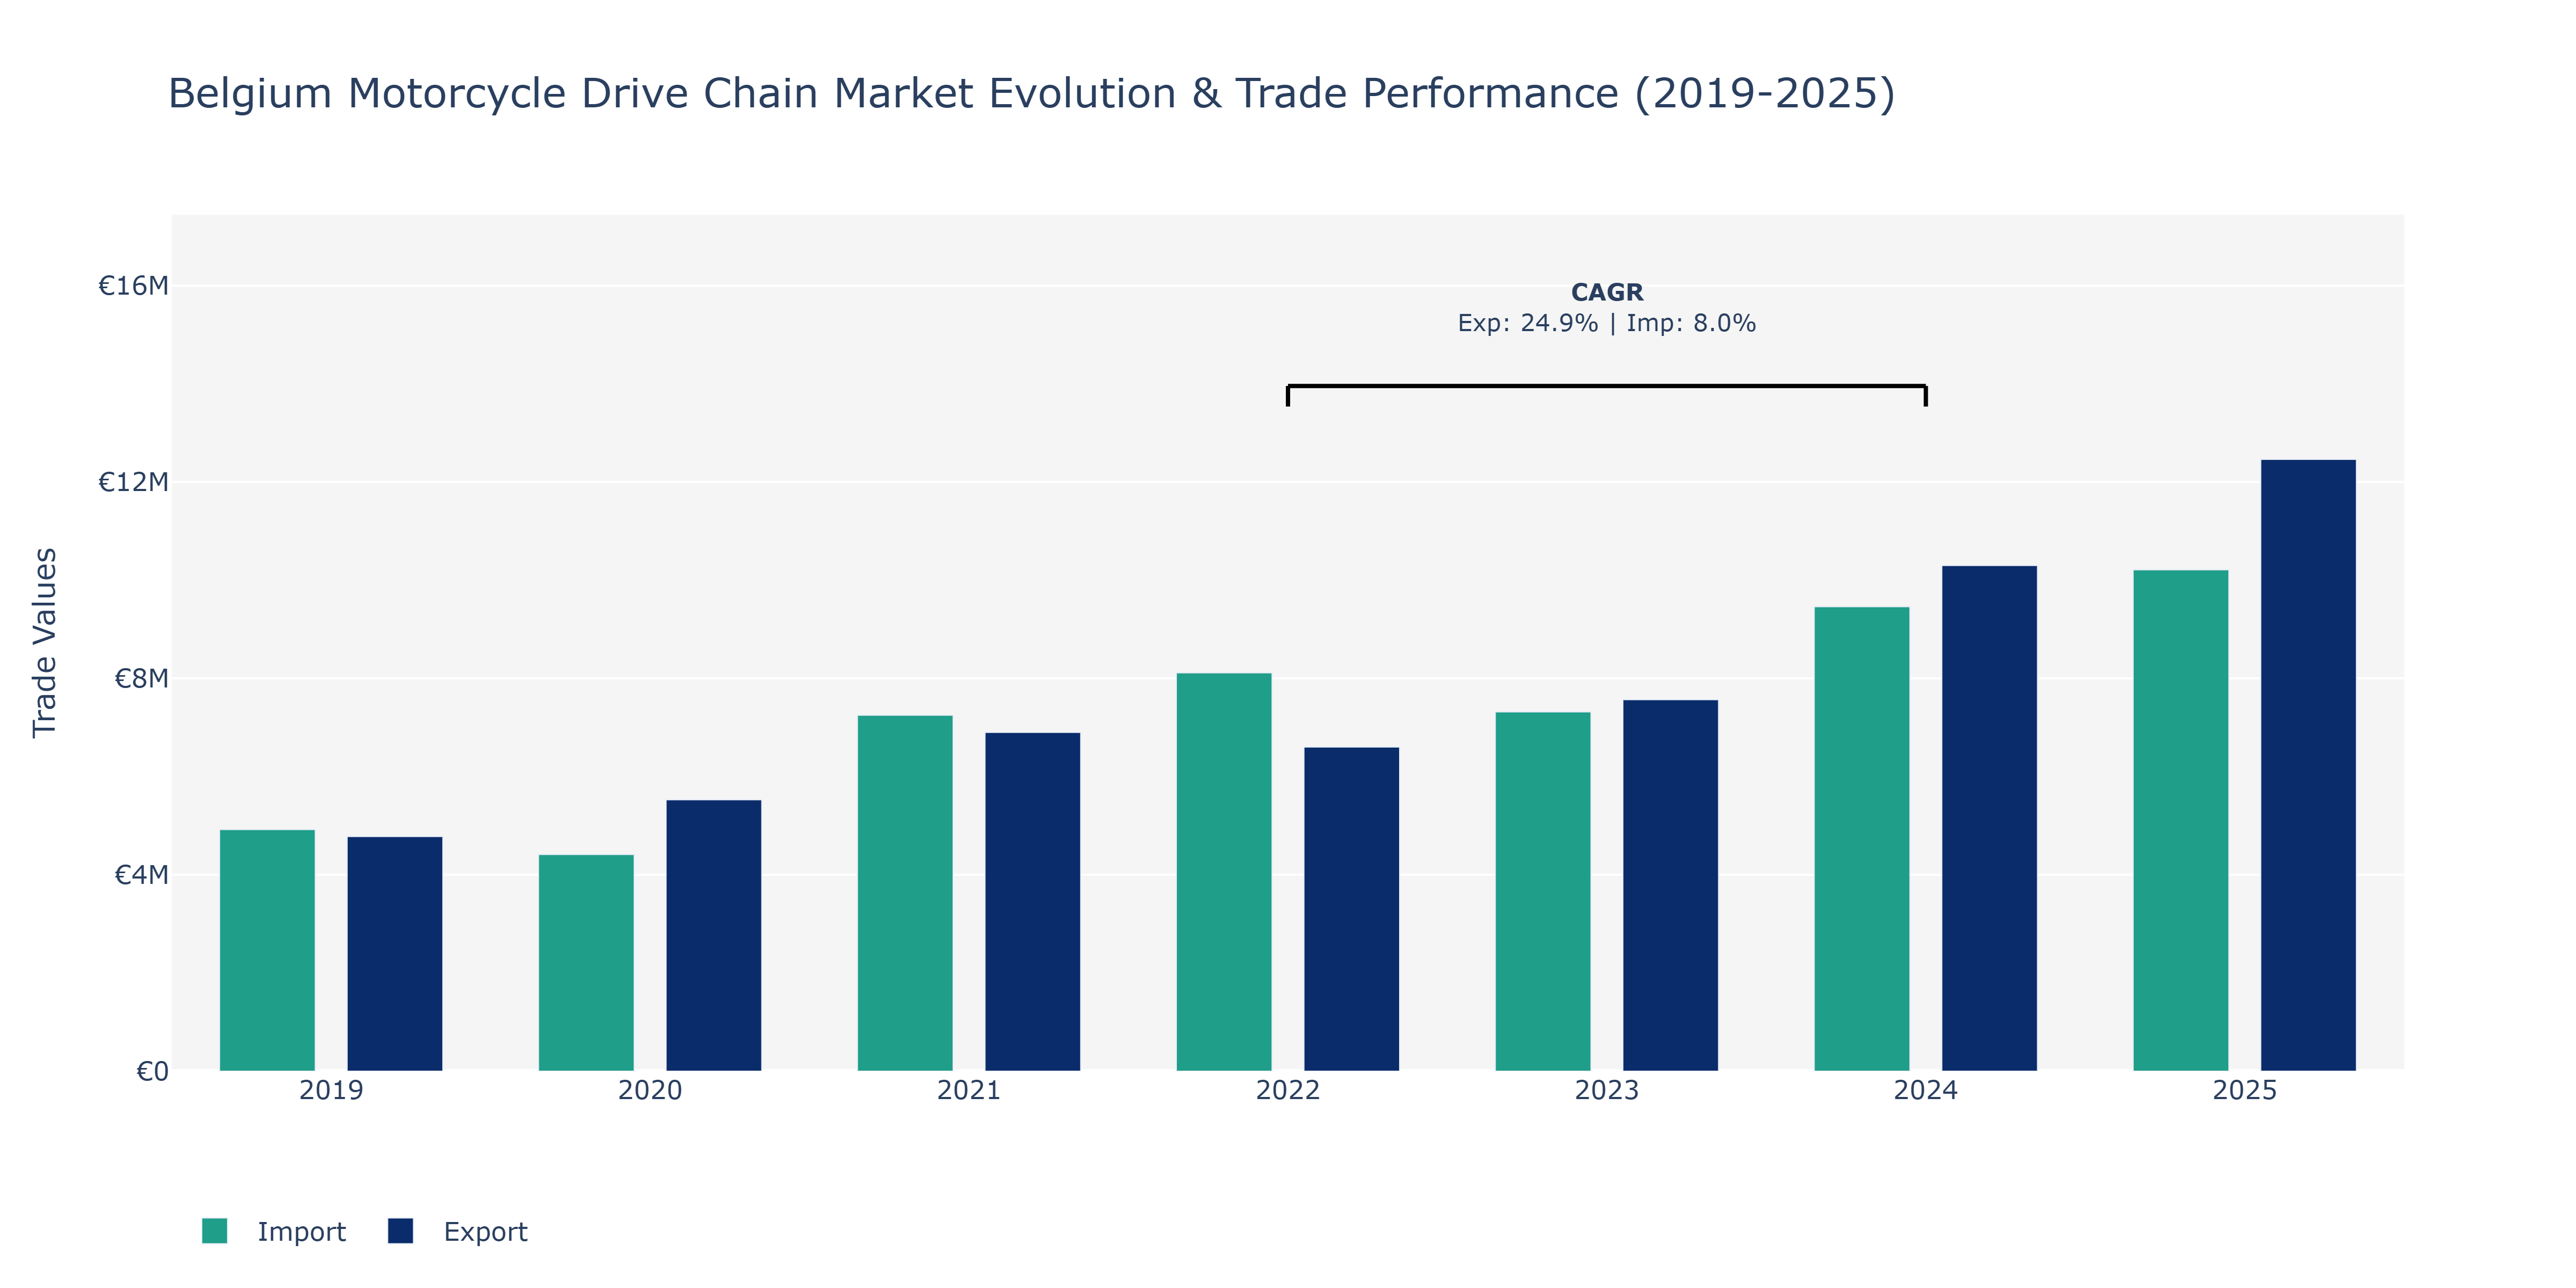
Between 2019 and 2025, Belgium's Motorcycle Drive Chain Market witnessed notable fluctuations in both exports and imports. Exports surged from €4.78 million in 2019 to €12.46 million in 2025, demonstrating a consistent upward trajectory with significant growth year on year. Conversely, imports displayed a more erratic pattern, peaking at €9.46 million in 2024 after a slight decline in 2023. This increase in imports could be attributed to the growing demand for motorcycle drive chains in Belgium's automotive industry, potentially indicating a shift towards higher-quality or specialized imports. The fluctuations in both export and import values are likely influenced by global economic conditions, technological advancements in the motorcycle sector, and changes in consumer preferences towards more durable and efficient motorcycle components. As the market continues to evolve, stakeholders may need to adapt their strategies to remain competitive in this dynamic landscape.
Key Highlights of the Report:
- Belgium Motorcycle Drive Chain Market Outlook
- Market Size of Belgium Motorcycle Drive Chain Market, 2025
- Forecast of Belgium Motorcycle Drive Chain Market, 2032
- Historical Data and Forecast of Belgium Motorcycle Drive Chain Revenues & Volume for the Period 2022 - 2032
- Belgium Motorcycle Drive Chain Market Trend Evolution
- Belgium Motorcycle Drive Chain Market Drivers and Challenges
- Belgium Motorcycle Drive Chain Price Trends
- Belgium Motorcycle Drive Chain Porter's Five Forces
- Belgium Motorcycle Drive Chain Industry Life Cycle
- Historical Data and Forecast of Belgium Motorcycle Drive Chain Market Revenues & Volume By Types for the Period 2022 - 2032
- Historical Data and Forecast of Belgium Motorcycle Drive Chain Market Revenues & Volume By Standard for the Period 2022 - 2032
- Historical Data and Forecast of Belgium Motorcycle Drive Chain Market Revenues & Volume By Cruiser for the Period 2022 - 2032
- Historical Data and Forecast of Belgium Motorcycle Drive Chain Market Revenues & Volume By Sports for the Period 2022 - 2032
- Historical Data and Forecast of Belgium Motorcycle Drive Chain Market Revenues & Volume By Off-Road for the Period 2022 - 2032
- Historical Data and Forecast of Belgium Motorcycle Drive Chain Market Revenues & Volume By Chain type for the Period 2022 - 2032
- Historical Data and Forecast of Belgium Motorcycle Drive Chain Market Revenues & Volume By Standard Rolling Chain for the Period 2022 - 2032
- Historical Data and Forecast of Belgium Motorcycle Drive Chain Market Revenues & Volume By O Ring Chain for the Period 2022 - 2032
- Historical Data and Forecast of Belgium Motorcycle Drive Chain Market Revenues & Volume By X Ring Chain for the Period 2022 - 2032
- Historical Data and Forecast of Belgium Motorcycle Drive Chain Market Revenues & Volume By Engine Capacity for the Period 2022 - 2032
- Historical Data and Forecast of Belgium Motorcycle Drive Chain Market Revenues & Volume By Up to 150 CC for the Period 2022 - 2032
- Historical Data and Forecast of Belgium Motorcycle Drive Chain Market Revenues & Volume By 151-300 CC for the Period 2022 - 2032
- Historical Data and Forecast of Belgium Motorcycle Drive Chain Market Revenues & Volume By 301-500 CC for the Period 2022 - 2032
- Historical Data and Forecast of Belgium Motorcycle Drive Chain Market Revenues & Volume By Above 500 CC for the Period 2022 - 2032
- Historical Data and Forecast of Belgium Motorcycle Drive Chain Market Revenues & Volume By Material Type for the Period 2022 - 2032
- Historical Data and Forecast of Belgium Motorcycle Drive Chain Market Revenues & Volume By Mild Steel for the Period 2022 - 2032
- Historical Data and Forecast of Belgium Motorcycle Drive Chain Market Revenues & Volume By Cast Steel for the Period 2022 - 2032
- Historical Data and Forecast of Belgium Motorcycle Drive Chain Market Revenues & Volume By Cast Iron for the Period 2022 - 2032
- Historical Data and Forecast of Belgium Motorcycle Drive Chain Market Revenues & Volume By Distribution Channel for the Period 2022 - 2032
- Historical Data and Forecast of Belgium Motorcycle Drive Chain Market Revenues & Volume By Online for the Period 2022 - 2032
- Historical Data and Forecast of Belgium Motorcycle Drive Chain Market Revenues & Volume By Offline for the Period 2022 - 2032
- Belgium Motorcycle Drive Chain Import Export Trade Statistics
- Market Opportunity Assessment By Types
- Market Opportunity Assessment By Chain type
- Market Opportunity Assessment By Engine Capacity
- Market Opportunity Assessment By Material Type
- Market Opportunity Assessment By Distribution Channel
- Belgium Motorcycle Drive Chain Top Companies Market Share
- Belgium Motorcycle Drive Chain Competitive Benchmarking By Technical and Operational Parameters
- Belgium Motorcycle Drive Chain Company Profiles
- Belgium Motorcycle Drive Chain Key Strategic Recommendations
Frequently Asked Questions About the Market Study (FAQs):
6Wresearch actively monitors the Belgium Motorcycle Drive Chain Market and publishes its comprehensive annual report, highlighting emerging trends, growth drivers, revenue analysis, and forecast outlook. Our insights help businesses to make data-backed strategic decisions with ongoing market dynamics. Our analysts track relevent industries related to the Belgium Motorcycle Drive Chain Market, allowing our clients with actionable intelligence and reliable forecasts tailored to emerging regional needs.
Yes, we provide customisation as per your requirements. To learn more, feel free to contact us on sales@6wresearch.com
1 Executive Summary |
2 Introduction |
2.1 Key Highlights of the Report |
2.2 Report Description |
2.3 Market Scope & Segmentation |
2.4 Research Methodology |
2.5 Assumptions |
3 Belgium Motorcycle Drive Chain Market Overview |
3.1 Belgium Country Macro Economic Indicators |
3.2 Belgium Motorcycle Drive Chain Market Revenues & Volume, 2022 & 2032F |
3.3 Belgium Motorcycle Drive Chain Market - Industry Life Cycle |
3.4 Belgium Motorcycle Drive Chain Market - Porter's Five Forces |
3.5 Belgium Motorcycle Drive Chain Market Revenues & Volume Share, By Types, 2022 & 2032F |
3.6 Belgium Motorcycle Drive Chain Market Revenues & Volume Share, By Chain type, 2022 & 2032F |
3.7 Belgium Motorcycle Drive Chain Market Revenues & Volume Share, By Engine Capacity, 2022 & 2032F |
3.8 Belgium Motorcycle Drive Chain Market Revenues & Volume Share, By Material Type, 2022 & 2032F |
3.9 Belgium Motorcycle Drive Chain Market Revenues & Volume Share, By Distribution Channel, 2022 & 2032F |
4 Belgium Motorcycle Drive Chain Market Dynamics |
4.1 Impact Analysis |
4.2 Market Drivers |
4.2.1 Increasing demand for motorcycles in Belgium |
4.2.2 Growth in the motorbike tourism industry |
4.2.3 Technological advancements leading to higher quality drive chains |
4.3 Market Restraints |
4.3.1 Economic uncertainty impacting consumer spending |
4.3.2 Competition from alternative transportation options |
4.3.3 Environmental regulations affecting motorcycle sales |
5 Belgium Motorcycle Drive Chain Market Trends |
6 Belgium Motorcycle Drive Chain Market, By Types |
6.1 Belgium Motorcycle Drive Chain Market, By Types |
6.1.1 Overview and Analysis |
6.1.2 Belgium Motorcycle Drive Chain Market Revenues & Volume, By Types, 2022 - 2032F |
6.1.3 Belgium Motorcycle Drive Chain Market Revenues & Volume, By Standard, 2022 - 2032F |
6.1.4 Belgium Motorcycle Drive Chain Market Revenues & Volume, By Cruiser, 2022 - 2032F |
6.1.5 Belgium Motorcycle Drive Chain Market Revenues & Volume, By Sports, 2022 - 2032F |
6.1.6 Belgium Motorcycle Drive Chain Market Revenues & Volume, By Off-Road, 2022 - 2032F |
6.2 Belgium Motorcycle Drive Chain Market, By Chain type |
6.2.1 Overview and Analysis |
6.2.2 Belgium Motorcycle Drive Chain Market Revenues & Volume, By Standard Rolling Chain, 2022 - 2032F |
6.2.3 Belgium Motorcycle Drive Chain Market Revenues & Volume, By O Ring Chain, 2022 - 2032F |
6.2.4 Belgium Motorcycle Drive Chain Market Revenues & Volume, By X Ring Chain, 2022 - 2032F |
6.3 Belgium Motorcycle Drive Chain Market, By Engine Capacity |
6.3.1 Overview and Analysis |
6.3.2 Belgium Motorcycle Drive Chain Market Revenues & Volume, By Up to 150 CC, 2022 - 2032F |
6.3.3 Belgium Motorcycle Drive Chain Market Revenues & Volume, By 151-300 CC, 2022 - 2032F |
6.3.4 Belgium Motorcycle Drive Chain Market Revenues & Volume, By 301-500 CC, 2022 - 2032F |
6.3.5 Belgium Motorcycle Drive Chain Market Revenues & Volume, By Above 500 CC, 2022 - 2032F |
6.4 Belgium Motorcycle Drive Chain Market, By Material Type |
6.4.1 Overview and Analysis |
6.4.2 Belgium Motorcycle Drive Chain Market Revenues & Volume, By Mild Steel, 2022 - 2032F |
6.4.3 Belgium Motorcycle Drive Chain Market Revenues & Volume, By Cast Steel, 2022 - 2032F |
6.4.4 Belgium Motorcycle Drive Chain Market Revenues & Volume, By Cast Iron, 2022 - 2032F |
6.5 Belgium Motorcycle Drive Chain Market, By Distribution Channel |
6.5.1 Overview and Analysis |
6.5.2 Belgium Motorcycle Drive Chain Market Revenues & Volume, By Online, 2022 - 2032F |
6.5.3 Belgium Motorcycle Drive Chain Market Revenues & Volume, By Offline, 2022 - 2032F |
7 Belgium Motorcycle Drive Chain Market Import-Export Trade Statistics |
7.1 Belgium Motorcycle Drive Chain Market Export to Major Countries |
7.2 Belgium Motorcycle Drive Chain Market Imports from Major Countries |
8 Belgium Motorcycle Drive Chain Market Key Performance Indicators |
8.1 Average age of motorcycles in Belgium |
8.2 Number of motorcycle registrations in Belgium |
8.3 Adoption rate of maintenance-free drive chains in the market |
9 Belgium Motorcycle Drive Chain Market - Opportunity Assessment |
9.1 Belgium Motorcycle Drive Chain Market Opportunity Assessment, By Types, 2022 & 2032F |
9.2 Belgium Motorcycle Drive Chain Market Opportunity Assessment, By Chain type, 2022 & 2032F |
9.3 Belgium Motorcycle Drive Chain Market Opportunity Assessment, By Engine Capacity, 2022 & 2032F |
9.4 Belgium Motorcycle Drive Chain Market Opportunity Assessment, By Material Type, 2022 & 2032F |
9.5 Belgium Motorcycle Drive Chain Market Opportunity Assessment, By Distribution Channel, 2022 & 2032F |
10 Belgium Motorcycle Drive Chain Market - Competitive Landscape |
10.1 Belgium Motorcycle Drive Chain Market Revenue Share, By Companies, 2025 |
10.2 Belgium Motorcycle Drive Chain Market Competitive Benchmarking, By Operating and Technical Parameters |
11 Company Profiles |
12 Recommendations |
13 Disclaimer |
Export potential assessment - trade Analytics for 2030
Export potential enables firms to identify high-growth global markets with greater confidence by combining advanced trade intelligence with a structured quantitative methodology. The framework analyzes emerging demand trends and country-level import patterns while integrating macroeconomic and trade datasets such as GDP and population forecasts, bilateral import–export flows, tariff structures, elasticity differentials between developed and developing economies, geographic distance, and import demand projections. Using weighted trade values from 2020–2024 as the base period to project country-to-country export potential for 2030, these inputs are operationalized through calculated drivers such as gravity model parameters, tariff impact factors, and projected GDP per-capita growth. Through an analysis of hidden potentials, demand hotspots, and market conditions that are most favorable to success, this method enables firms to focus on target countries, maximize returns, and global expansion with data, backed by accuracy.
By factoring in the projected importer demand gap that is currently unmet and could be potential opportunity, it identifies the potential for the Exporter (Country) among 190 countries, against the general trade analysis, which identifies the biggest importer or exporter.
To discover high-growth global markets and optimize your business strategy:
Click Here
Pricing
- Single User License$ 1,995
- Department License$ 2,400
- Site License$ 3,120
- Global License$ 3,795

Search
Thought Leadership and Analyst Meet


Our Clients
Latest Reports
- India Ultrasonic Smart Water Meter Market (2026-2032) | Outlook, Competition, Drivers, Trends, Demand, Competitive, Strategic Insights, Companies, Challenges, Strategy, Consumer Insights, Analysis, Opportunities, Growth, Size, Share, Industry, Revenue, Segments, Value, Segmentation, Supply, Forecast, Restraints,
- India Electromagnetic Bulk Flow Meter Market (2026-2032) | Analysis, Challenges, Strategic Insights, Supply, Forecast, Growth, Share, Consumer Insights, Competitive, Value, Outlook, Size & Demand,
- India Battery Powered Bulk Flow Meter Market (2026-2032) | Outlook, Analysis, Competitive Landscape, Growth, Size, Trends, Value, Revenue, Companies, Segmentation, Share & Forecast
- Bosnia and Herzegovina Fuel-Efficient Winglets Market (2026-2032) | Growth, Competition, Strategy, Restraints, Trends, Challenges, segmentation, Value, Outlook, Investment Opportunities, Analysis, Revenue, Companies, Insights, Pricing, Size, Drivers, Demand, Share, Forecast
- Canada Cloud CFD Market (2026-2032) | Size & Revenue, Industry, Growth, Competitive Landscape, Forecast, Segmentation, Value, Outlook, Trends, Share, Analysis, Companies
- Taiwan Food Delivery Platform Market (2026-2032) | Companies, Outlook, Analysis, Trends, Value, Revenue, Segmentation, Share, Forecast, Competitive Landscape, Growth, Size & Forecast
- United Kingdom (UK) Long-term Care Insurance Market (2026-2032) | Growth, Share, Consumer Insights, Drivers, Opportunities, Competition, Pricing Analysis, Segments, Restraints, Companies, Competitive, Value, Outlook, Size, Demand, Analysis, Challenges, Strategic Insights, Investment Trends, Revenue, Trends, Supply, Forecast
- United Kingdom (UK) Long Term Care Market (2026-2032) | Companies, Outlook, Analysis, Trends, Value, Revenue, Segmentation, Share, Forecast, Competitive Landscape, Growth, Size & Forecast
- Iraq Insulation and Waterproofing Market (2026-2032) | Outlook, Drivers, Growth, Size, Share, Industry, Revenue, Trends, Demand, Competitive, Strategic Insights, Opportunities, Segments, Companies, Challenges, Strategy, Consumer Insights, Analysis, Investment Trends, Value, Segmentation, Forecast, Restraints
- India Switchgear Market Outlook (2026-2032) | Size, Share, Trends, Growth, Revenue, Forecast, Analysis, Value, Outlook
Industry Events and Analyst Meet

HIMTEX 2026

India Refining Summit 2026

India EV Show 2026

EV tech India Expo 2026

Auto Tech Asia 2026
Whitepaper
- Middle East & Africa Commercial Security Market Click here to view more.
- Middle East & Africa Fire Safety Systems & Equipment Market Click here to view more.
- GCC Drone Market Click here to view more.
- Middle East Lighting Fixture Market Click here to view more.
- GCC Physical & Perimeter Security Market Click here to view more.
6WResearch In News
- Doha a strategic location for EV manufacturing hub: IPA Qatar
- Demand for luxury TVs surging in the GCC, says Samsung
- Empowering Growth: The Thriving Journey of Bangladesh’s Cable Industry
- Demand for luxury TVs surging in the GCC, says Samsung
- Video call with a traditional healer? Once unthinkable, it’s now common in South Africa
- Intelligent Buildings To Smooth GCC’s Path To Net Zero