Denmark Plastic Dispensing Caps Market (2026-2032) | Industry, Size & Revenue, Value, Segmentation, Trends, Companies, Share, Analysis, Outlook, Growth, Forecast, Competitive Landscape
Market Forecast By Products (Screw-on Caps, Dispensing Caps), By Technology (Injection Molding, Compression Molding, Post-mold TE Band), By Materials (PET, PP, HDPE, LDPE, Other), By End-User (Beverage, Pharmaceutical, Cosmetics, Others) And Competitive Landscape
| Product Code: ETC6967162 | Publication Date: Sep 2024 | Updated Date: Apr 2026 | Product Type: Market Research Report | |
| Publisher: 6Wresearch | Author: Summon Dutta | No. of Pages: 75 | No. of Figures: 35 | No. of Tables: 20 |
Denmark Plastic Dispensing Caps Market Size (2020-2030)
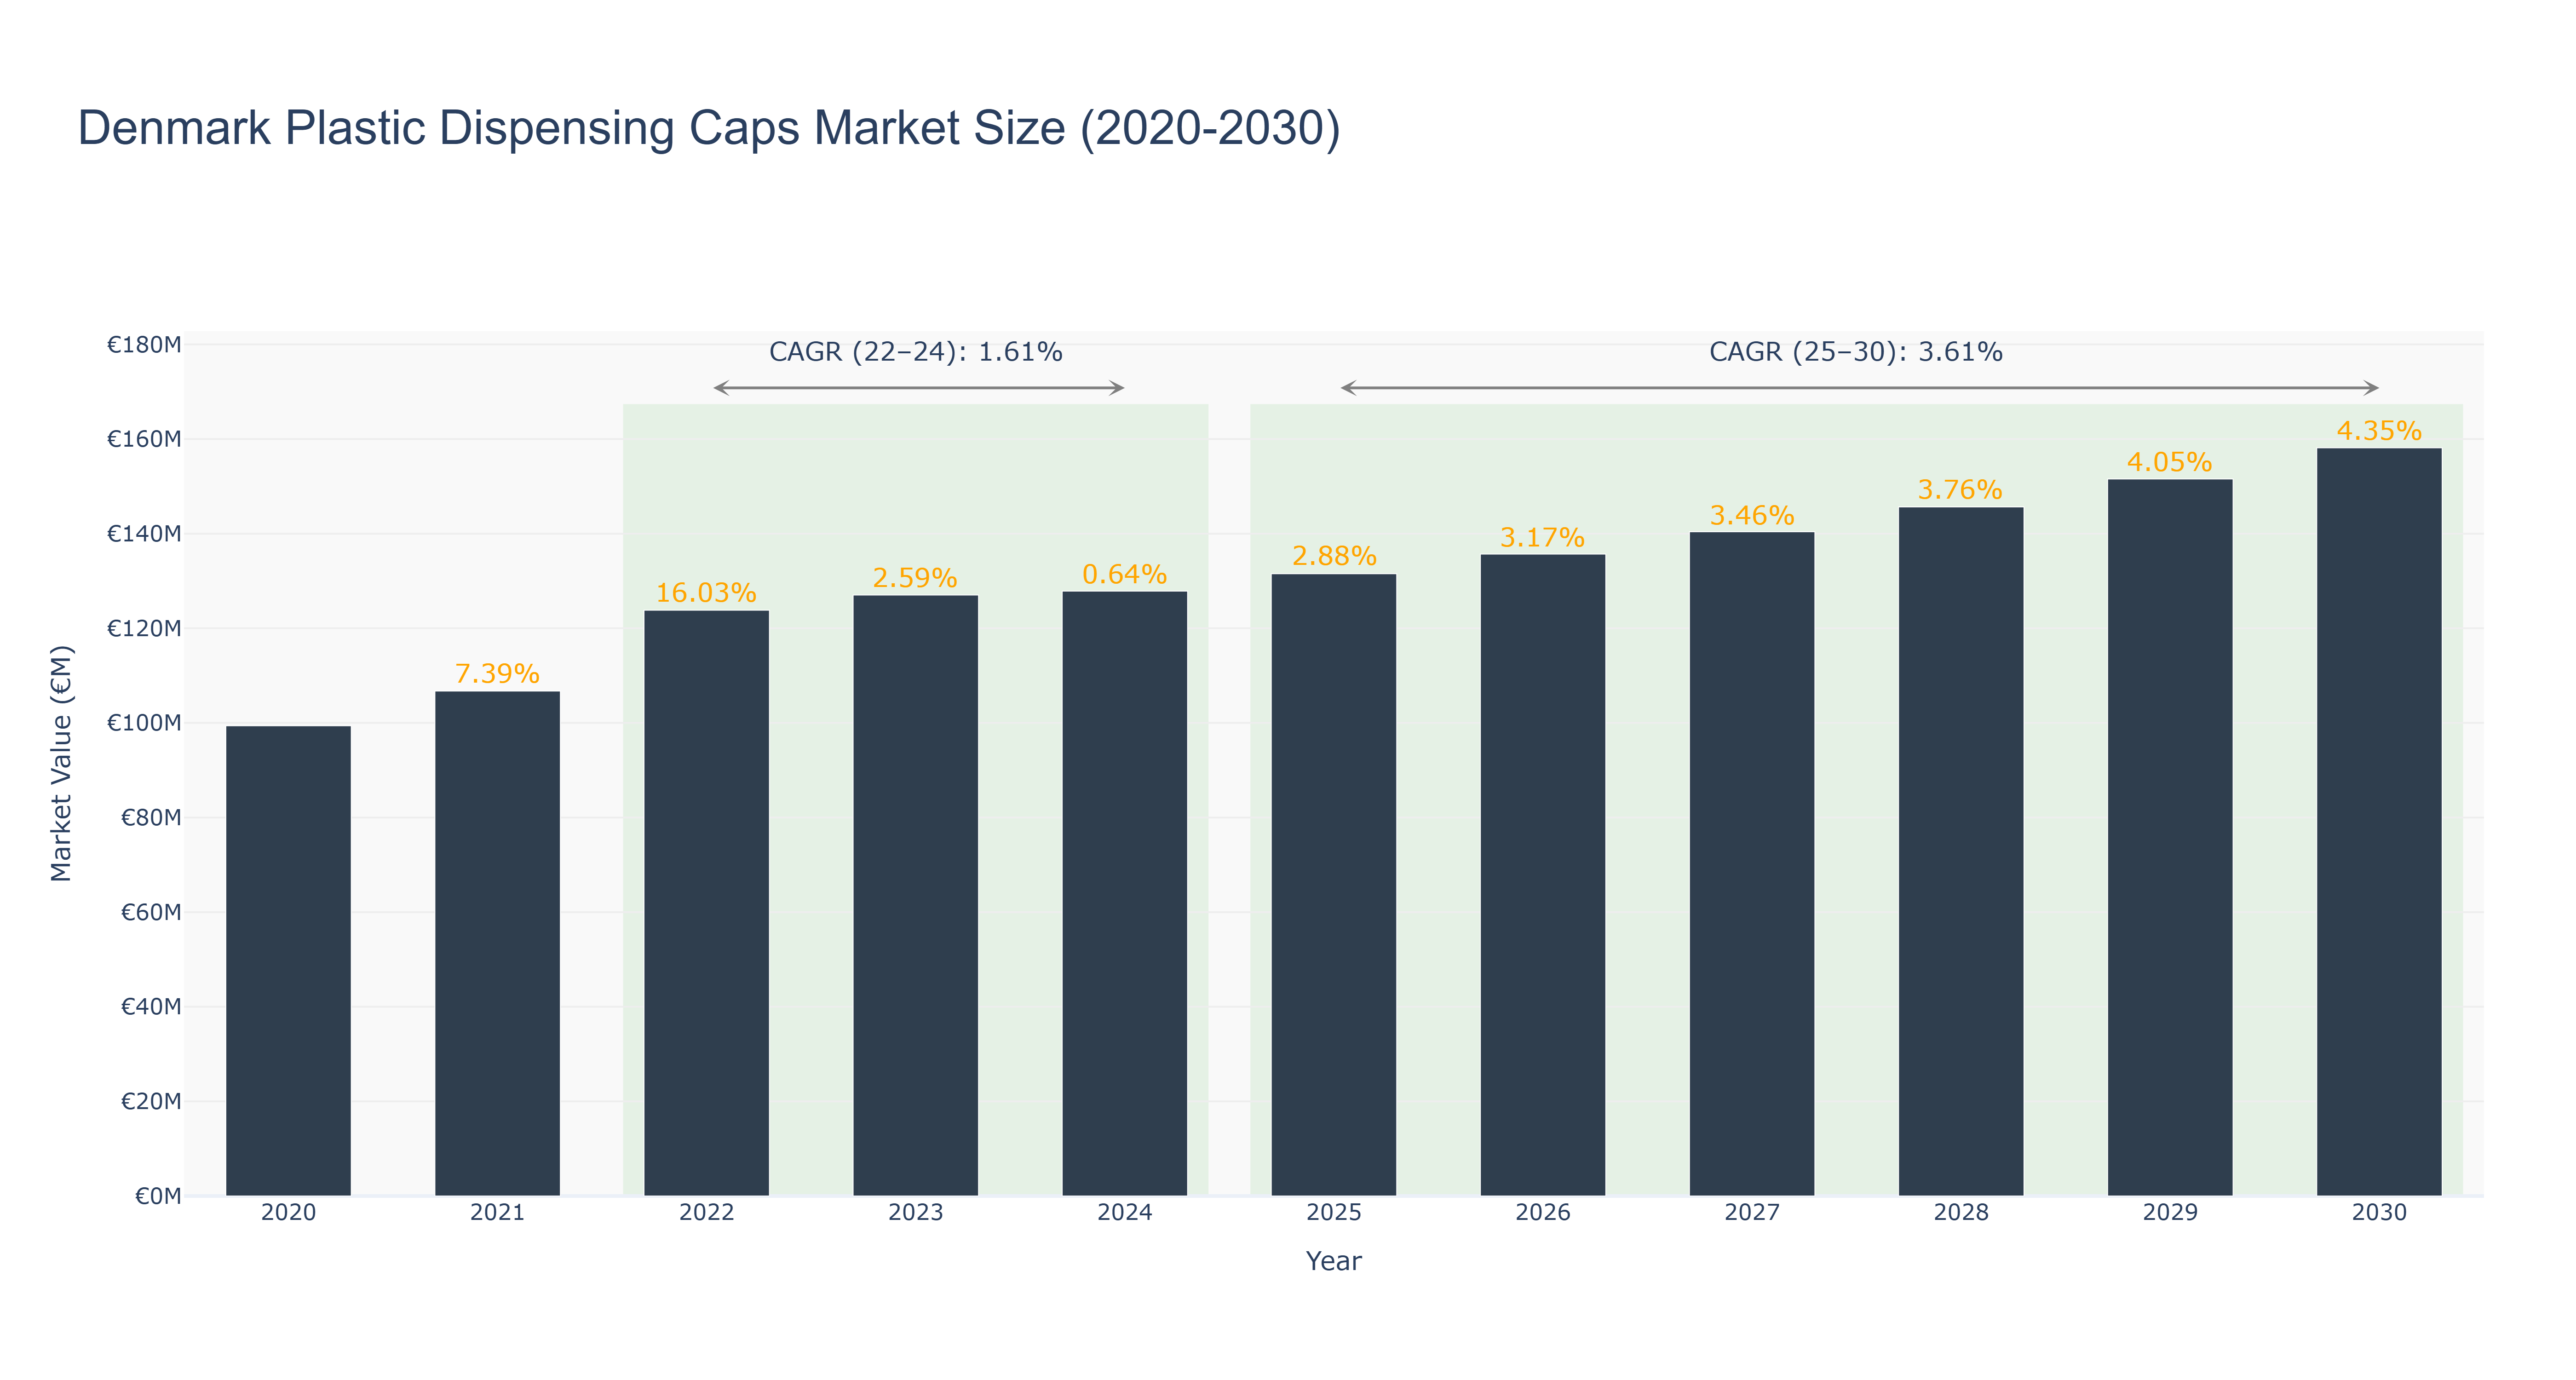
Denmark Plastic Dispensing Caps Market has shown a steady growth trajectory over the years. The peak market size of €158.15 million is forecasted for 2030. From 2020 to 2024, the market experienced an incremental rise from €99.39 million to €127.85 million. The growth is expected to accelerate from 2025 to 2030, with a CAGR of 3.61%, surpassing the historical CAGR of 1.61%. The market's growth can be attributed to increasing demand for sustainable packaging solutions and technological advancements in dispensing cap designs. Recent developments in Denmark's packaging industry, such as investments in eco-friendly materials and automation in manufacturing processes, are expected to further boost the market's growth in the coming years.
Denmark Plastic Dispensing Caps Market: Production & Trade Performance (2019-2025)
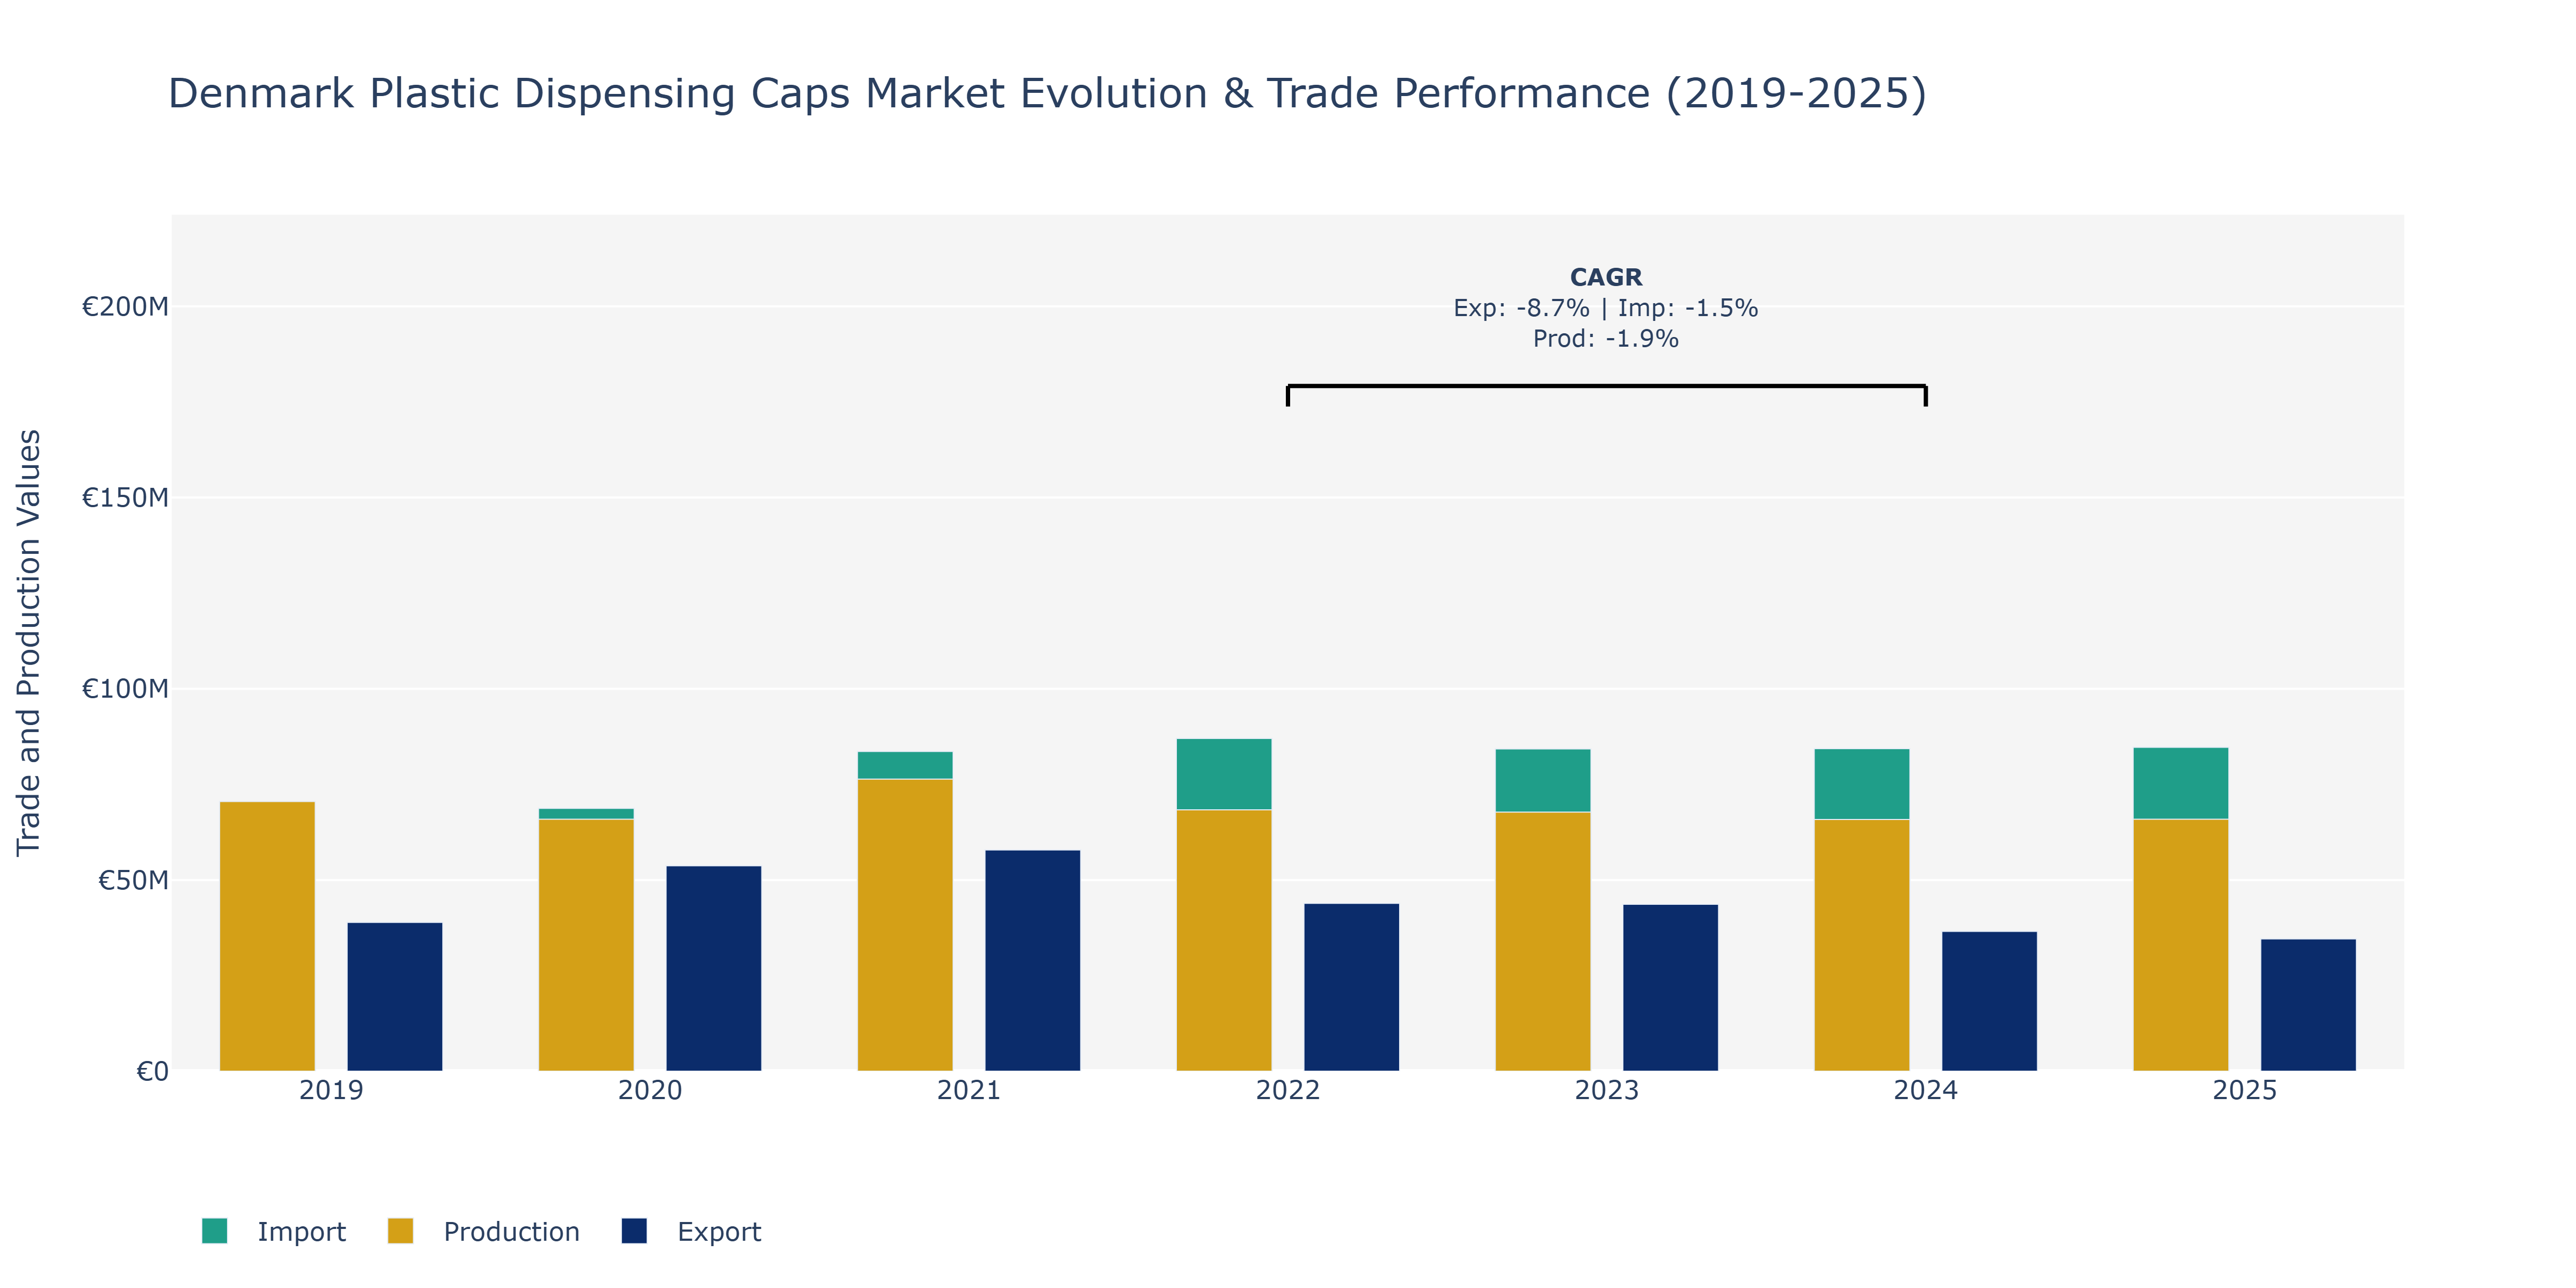
In the Denmark Plastic Dispensing Caps Market, from 2019 to 2025, there were notable fluctuations in exports, imports, and production. In 2019, production reached €70.5 billion, the highest in the period, but showed a downward trend in the subsequent years, dropping to €65.9 billion by 2025. Exports peaked in 2021 at €57.9 billion, followed by a gradual decline to €34.6 billion in 2025. Conversely, imports steadily increased year over year, with the highest value of €84.7 billion recorded in 2025. The fluctuations in production may be attributed to shifts in demand for plastic dispensing caps in various industries, leading to changes in manufacturing volumes. The decline in exports could be influenced by competitive pricing strategies or changes in global market demand. The consistent rise in imports suggests a growing need for foreign-made plastic dispensing caps due to specific quality requirements or cost considerations, reflecting the market's evolving dynamics.
Key Highlights of the Report:
- Denmark Plastic Dispensing Caps Market Outlook
- Market Size of Denmark Plastic Dispensing Caps Market, 2025
- Forecast of Denmark Plastic Dispensing Caps Market, 2032
- Historical Data and Forecast of Denmark Plastic Dispensing Caps Revenues & Volume for the Period 2022 - 2032
- Denmark Plastic Dispensing Caps Market Trend Evolution
- Denmark Plastic Dispensing Caps Market Drivers and Challenges
- Denmark Plastic Dispensing Caps Price Trends
- Denmark Plastic Dispensing Caps Porter's Five Forces
- Denmark Plastic Dispensing Caps Industry Life Cycle
- Historical Data and Forecast of Denmark Plastic Dispensing Caps Market Revenues & Volume By Products for the Period 2022 - 2032
- Historical Data and Forecast of Denmark Plastic Dispensing Caps Market Revenues & Volume By Screw-on Caps for the Period 2022 - 2032
- Historical Data and Forecast of Denmark Plastic Dispensing Caps Market Revenues & Volume By Dispensing Caps for the Period 2022 - 2032
- Historical Data and Forecast of Denmark Plastic Dispensing Caps Market Revenues & Volume By Technology for the Period 2022 - 2032
- Historical Data and Forecast of Denmark Plastic Dispensing Caps Market Revenues & Volume By Injection Molding for the Period 2022 - 2032
- Historical Data and Forecast of Denmark Plastic Dispensing Caps Market Revenues & Volume By Compression Molding for the Period 2022 - 2032
- Historical Data and Forecast of Denmark Plastic Dispensing Caps Market Revenues & Volume By Post-mold TE Band for the Period 2022 - 2032
- Historical Data and Forecast of Denmark Plastic Dispensing Caps Market Revenues & Volume By Materials for the Period 2022 - 2032
- Historical Data and Forecast of Denmark Plastic Dispensing Caps Market Revenues & Volume By PET for the Period 2022 - 2032
- Historical Data and Forecast of Denmark Plastic Dispensing Caps Market Revenues & Volume By PP for the Period 2022 - 2032
- Historical Data and Forecast of Denmark Plastic Dispensing Caps Market Revenues & Volume By HDPE for the Period 2022 - 2032
- Historical Data and Forecast of Denmark Plastic Dispensing Caps Market Revenues & Volume By LDPE for the Period 2022 - 2032
- Historical Data and Forecast of Denmark Plastic Dispensing Caps Market Revenues & Volume By Other for the Period 2022 - 2032
- Historical Data and Forecast of Denmark Plastic Dispensing Caps Market Revenues & Volume By End-User for the Period 2022 - 2032
- Historical Data and Forecast of Denmark Plastic Dispensing Caps Market Revenues & Volume By Beverage for the Period 2022 - 2032
- Historical Data and Forecast of Denmark Plastic Dispensing Caps Market Revenues & Volume By Pharmaceutical for the Period 2022 - 2032
- Historical Data and Forecast of Denmark Plastic Dispensing Caps Market Revenues & Volume By Cosmetics for the Period 2022 - 2032
- Historical Data and Forecast of Denmark Plastic Dispensing Caps Market Revenues & Volume By Others for the Period 2022 - 2032
- Denmark Plastic Dispensing Caps Import Export Trade Statistics
- Market Opportunity Assessment By Products
- Market Opportunity Assessment By Technology
- Market Opportunity Assessment By Materials
- Market Opportunity Assessment By End-User
- Denmark Plastic Dispensing Caps Top Companies Market Share
- Denmark Plastic Dispensing Caps Competitive Benchmarking By Technical and Operational Parameters
- Denmark Plastic Dispensing Caps Company Profiles
- Denmark Plastic Dispensing Caps Key Strategic Recommendations
Frequently Asked Questions About the Market Study (FAQs):
6Wresearch actively monitors the Denmark Plastic Dispensing Caps Market and publishes its comprehensive annual report, highlighting emerging trends, growth drivers, revenue analysis, and forecast outlook. Our insights help businesses to make data-backed strategic decisions with ongoing market dynamics. Our analysts track relevent industries related to the Denmark Plastic Dispensing Caps Market, allowing our clients with actionable intelligence and reliable forecasts tailored to emerging regional needs.
Yes, we provide customisation as per your requirements. To learn more, feel free to contact us on sales@6wresearch.com
1 Executive Summary |
2 Introduction |
2.1 Key Highlights of the Report |
2.2 Report Description |
2.3 Market Scope & Segmentation |
2.4 Research Methodology |
2.5 Assumptions |
3 Denmark Plastic Dispensing Caps Market Overview |
3.1 Denmark Country Macro Economic Indicators |
3.2 Denmark Plastic Dispensing Caps Market Revenues & Volume, 2022 & 2032F |
3.3 Denmark Plastic Dispensing Caps Market - Industry Life Cycle |
3.4 Denmark Plastic Dispensing Caps Market - Porter's Five Forces |
3.5 Denmark Plastic Dispensing Caps Market Revenues & Volume Share, By Products, 2022 & 2032F |
3.6 Denmark Plastic Dispensing Caps Market Revenues & Volume Share, By Technology, 2022 & 2032F |
3.7 Denmark Plastic Dispensing Caps Market Revenues & Volume Share, By Materials, 2022 & 2032F |
3.8 Denmark Plastic Dispensing Caps Market Revenues & Volume Share, By End-User, 2022 & 2032F |
4 Denmark Plastic Dispensing Caps Market Dynamics |
4.1 Impact Analysis |
4.2 Market Drivers |
4.2.1 Increasing demand for convenient and user-friendly packaging solutions in various industries. |
4.2.2 Growing awareness about the importance of sustainability and recyclability in packaging materials. |
4.2.3 Technological advancements leading to the development of innovative dispensing cap designs. |
4.3 Market Restraints |
4.3.1 Fluctuating prices of raw materials used in the manufacturing of plastic dispensing caps. |
4.3.2 Stringent regulations regarding the use of plastic materials and environmental concerns. |
4.3.3 Competition from alternative packaging solutions such as glass or metal dispensing caps. |
5 Denmark Plastic Dispensing Caps Market Trends |
6 Denmark Plastic Dispensing Caps Market, By Types |
6.1 Denmark Plastic Dispensing Caps Market, By Products |
6.1.1 Overview and Analysis |
6.1.2 Denmark Plastic Dispensing Caps Market Revenues & Volume, By Products, 2022 - 2032F |
6.1.3 Denmark Plastic Dispensing Caps Market Revenues & Volume, By Screw-on Caps, 2022 - 2032F |
6.1.4 Denmark Plastic Dispensing Caps Market Revenues & Volume, By Dispensing Caps, 2022 - 2032F |
6.2 Denmark Plastic Dispensing Caps Market, By Technology |
6.2.1 Overview and Analysis |
6.2.2 Denmark Plastic Dispensing Caps Market Revenues & Volume, By Injection Molding, 2022 - 2032F |
6.2.3 Denmark Plastic Dispensing Caps Market Revenues & Volume, By Compression Molding, 2022 - 2032F |
6.2.4 Denmark Plastic Dispensing Caps Market Revenues & Volume, By Post-mold TE Band, 2022 - 2032F |
6.3 Denmark Plastic Dispensing Caps Market, By Materials |
6.3.1 Overview and Analysis |
6.3.2 Denmark Plastic Dispensing Caps Market Revenues & Volume, By PET, 2022 - 2032F |
6.3.3 Denmark Plastic Dispensing Caps Market Revenues & Volume, By PP, 2022 - 2032F |
6.3.4 Denmark Plastic Dispensing Caps Market Revenues & Volume, By HDPE, 2022 - 2032F |
6.3.5 Denmark Plastic Dispensing Caps Market Revenues & Volume, By LDPE, 2022 - 2032F |
6.3.6 Denmark Plastic Dispensing Caps Market Revenues & Volume, By Other, 2022 - 2032F |
6.4 Denmark Plastic Dispensing Caps Market, By End-User |
6.4.1 Overview and Analysis |
6.4.2 Denmark Plastic Dispensing Caps Market Revenues & Volume, By Beverage, 2022 - 2032F |
6.4.3 Denmark Plastic Dispensing Caps Market Revenues & Volume, By Pharmaceutical, 2022 - 2032F |
6.4.4 Denmark Plastic Dispensing Caps Market Revenues & Volume, By Cosmetics, 2022 - 2032F |
6.4.5 Denmark Plastic Dispensing Caps Market Revenues & Volume, By Others, 2022 - 2032F |
7 Denmark Plastic Dispensing Caps Market Import-Export Trade Statistics |
7.1 Denmark Plastic Dispensing Caps Market Export to Major Countries |
7.2 Denmark Plastic Dispensing Caps Market Imports from Major Countries |
8 Denmark Plastic Dispensing Caps Market Key Performance Indicators |
8.1 Percentage of plastic dispensing caps made from recycled materials. |
8.2 Number of new product launches and innovations in plastic dispensing cap designs. |
8.3 Customer satisfaction ratings and feedback on the usability and functionality of plastic dispensing caps. |
9 Denmark Plastic Dispensing Caps Market - Opportunity Assessment |
9.1 Denmark Plastic Dispensing Caps Market Opportunity Assessment, By Products, 2022 & 2032F |
9.2 Denmark Plastic Dispensing Caps Market Opportunity Assessment, By Technology, 2022 & 2032F |
9.3 Denmark Plastic Dispensing Caps Market Opportunity Assessment, By Materials, 2022 & 2032F |
9.4 Denmark Plastic Dispensing Caps Market Opportunity Assessment, By End-User, 2022 & 2032F |
10 Denmark Plastic Dispensing Caps Market - Competitive Landscape |
10.1 Denmark Plastic Dispensing Caps Market Revenue Share, By Companies, 2025 |
10.2 Denmark Plastic Dispensing Caps Market Competitive Benchmarking, By Operating and Technical Parameters |
11 Company Profiles |
12 Recommendations |
13 Disclaimer |
Export potential assessment - trade Analytics for 2030
Export potential enables firms to identify high-growth global markets with greater confidence by combining advanced trade intelligence with a structured quantitative methodology. The framework analyzes emerging demand trends and country-level import patterns while integrating macroeconomic and trade datasets such as GDP and population forecasts, bilateral import–export flows, tariff structures, elasticity differentials between developed and developing economies, geographic distance, and import demand projections. Using weighted trade values from 2020–2024 as the base period to project country-to-country export potential for 2030, these inputs are operationalized through calculated drivers such as gravity model parameters, tariff impact factors, and projected GDP per-capita growth. Through an analysis of hidden potentials, demand hotspots, and market conditions that are most favorable to success, this method enables firms to focus on target countries, maximize returns, and global expansion with data, backed by accuracy.
By factoring in the projected importer demand gap that is currently unmet and could be potential opportunity, it identifies the potential for the Exporter (Country) among 190 countries, against the general trade analysis, which identifies the biggest importer or exporter.
To discover high-growth global markets and optimize your business strategy:
Click Here
Pricing
- Single User License$ 1,995
- Department License$ 2,400
- Site License$ 3,120
- Global License$ 3,795

Search
Thought Leadership and Analyst Meet


Our Clients
Latest Reports
- Philippines Polyhydroxybutyrate-co-Hydroxyvalerate Market (2026-2032) | Trends, Insights, Challenges, Restraints, Competition, Size, Value, Forecast, Pricing, Share, Outlook, Revenue, Investment Opportunities, Strategy, Drivers, Demand, Growth, segmentation, Analysis, Companies
- Peru Polyhydroxybutyrate-co-Hydroxyvalerate Market (2026-2032) | Growth, Demand, Challenges, Share, Trends, Analysis, Pricing, Investment Opportunities, Drivers, Value, Forecast, Competition, Size, Companies, Insights, Outlook, Restraints, segmentation, Revenue, Strategy
- Pakistan Polyhydroxybutyrate-co-Hydroxyvalerate Market (2026-2032) | Restraints, segmentation, Pricing, Forecast, Share, Strategy, Competition, Trends, Insights, Drivers, Challenges, Growth, Revenue, Outlook, Value, Investment Opportunities, Companies, Size, Analysis, Demand
- Oman Polyhydroxybutyrate-co-Hydroxyvalerate Market (2026-2032) | Drivers, segmentation, Insights, Competition, Pricing, Outlook, Size, Revenue, Challenges, Forecast, Analysis, Growth, Value, Share, Trends, Investment Opportunities, Strategy, Restraints, Companies, Demand
- Nigeria Polyhydroxybutyrate-co-Hydroxyvalerate Market (2026-2032) | Value, Investment Opportunities, Analysis, Revenue, Restraints, Pricing, Outlook, Competition, Demand, Growth, Forecast, Companies, Trends, Challenges, segmentation, Drivers, Insights, Share, Size, Strategy
- Nepal Polyhydroxybutyrate-co-Hydroxyvalerate Market (2026-2032) | Insights, Analysis, Drivers, Share, Revenue, Demand, segmentation, Investment Opportunities, Competition, Forecast, Growth, Pricing, Companies, Strategy, Trends, Restraints, Challenges, Outlook, Size, Value
- Myanmar Polyhydroxybutyrate-co-Hydroxyvalerate Market (2026-2032) | Outlook, Revenue, Strategy, Restraints, Drivers, segmentation, Share, Forecast, Competition, Insights, Growth, Pricing, Size, Demand, Value, Companies, Trends, Challenges, Investment Opportunities, Analysis
- Morocco Polyhydroxybutyrate-co-Hydroxyvalerate Market (2026-2032) | Outlook, Investment Opportunities, Restraints, Strategy, Forecast, Challenges, Drivers, Growth, Companies, segmentation, Trends, Size, Competition, Revenue, Demand, Insights, Share, Analysis, Value, Pricing
- Mexico Polyhydroxybutyrate-co-Hydroxyvalerate Market (2026-2032) | Size, Drivers, Outlook, Share, Strategy, Growth, Pricing, Challenges, Companies, Demand, Value, Investment Opportunities, Restraints, Trends, Forecast, segmentation, Analysis, Insights, Competition, Revenue
- Malaysia Polyhydroxybutyrate-co-Hydroxyvalerate Market (2026-2032) | Share, segmentation, Size, Companies, Analysis, Insights, Forecast, Value, Revenue, Drivers, Restraints, Challenges, Investment Opportunities, Trends, Competition, Strategy, Demand, Growth, Outlook, Pricing
Industry Events and Analyst Meet

HIMTEX 2026

India Refining Summit 2026

India EV Show 2026

EV tech India Expo 2026

Auto Tech Asia 2026
Whitepaper
- Middle East & Africa Commercial Security Market Click here to view more.
- Middle East & Africa Fire Safety Systems & Equipment Market Click here to view more.
- GCC Drone Market Click here to view more.
- Middle East Lighting Fixture Market Click here to view more.
- GCC Physical & Perimeter Security Market Click here to view more.
6WResearch In News
- Doha a strategic location for EV manufacturing hub: IPA Qatar
- Demand for luxury TVs surging in the GCC, says Samsung
- Empowering Growth: The Thriving Journey of Bangladesh’s Cable Industry
- Demand for luxury TVs surging in the GCC, says Samsung
- Video call with a traditional healer? Once unthinkable, it’s now common in South Africa
- Intelligent Buildings To Smooth GCC’s Path To Net Zero