Denmark Silver Market (2026-2032) | Industry, Segmentation, Revenue, Outlook, Value, Share, Analysis, Trends, Forecast, Companies, Size & Growth
Market Forecast By Type (Sterling Silver, German Silver, Coin Silver, Britannia Silver, Mexican Silver, Russian Silver, Oxidized Silver, Others), By Application (Silverware, Industrial, Jewelry, Investment, Photographic , Films, Electrical And Electronics, Pharmaceuticals) And Competitive Landscape
| Product Code: ETC5214290 | Publication Date: Nov 2023 | Updated Date: Apr 2026 | Product Type: Market Research Report | |
| Publisher: 6Wresearch | Author: Shubham Padhi | No. of Pages: 60 | No. of Figures: 30 | No. of Tables: 5 |
Denmark Silver Market Size (2020-2030)
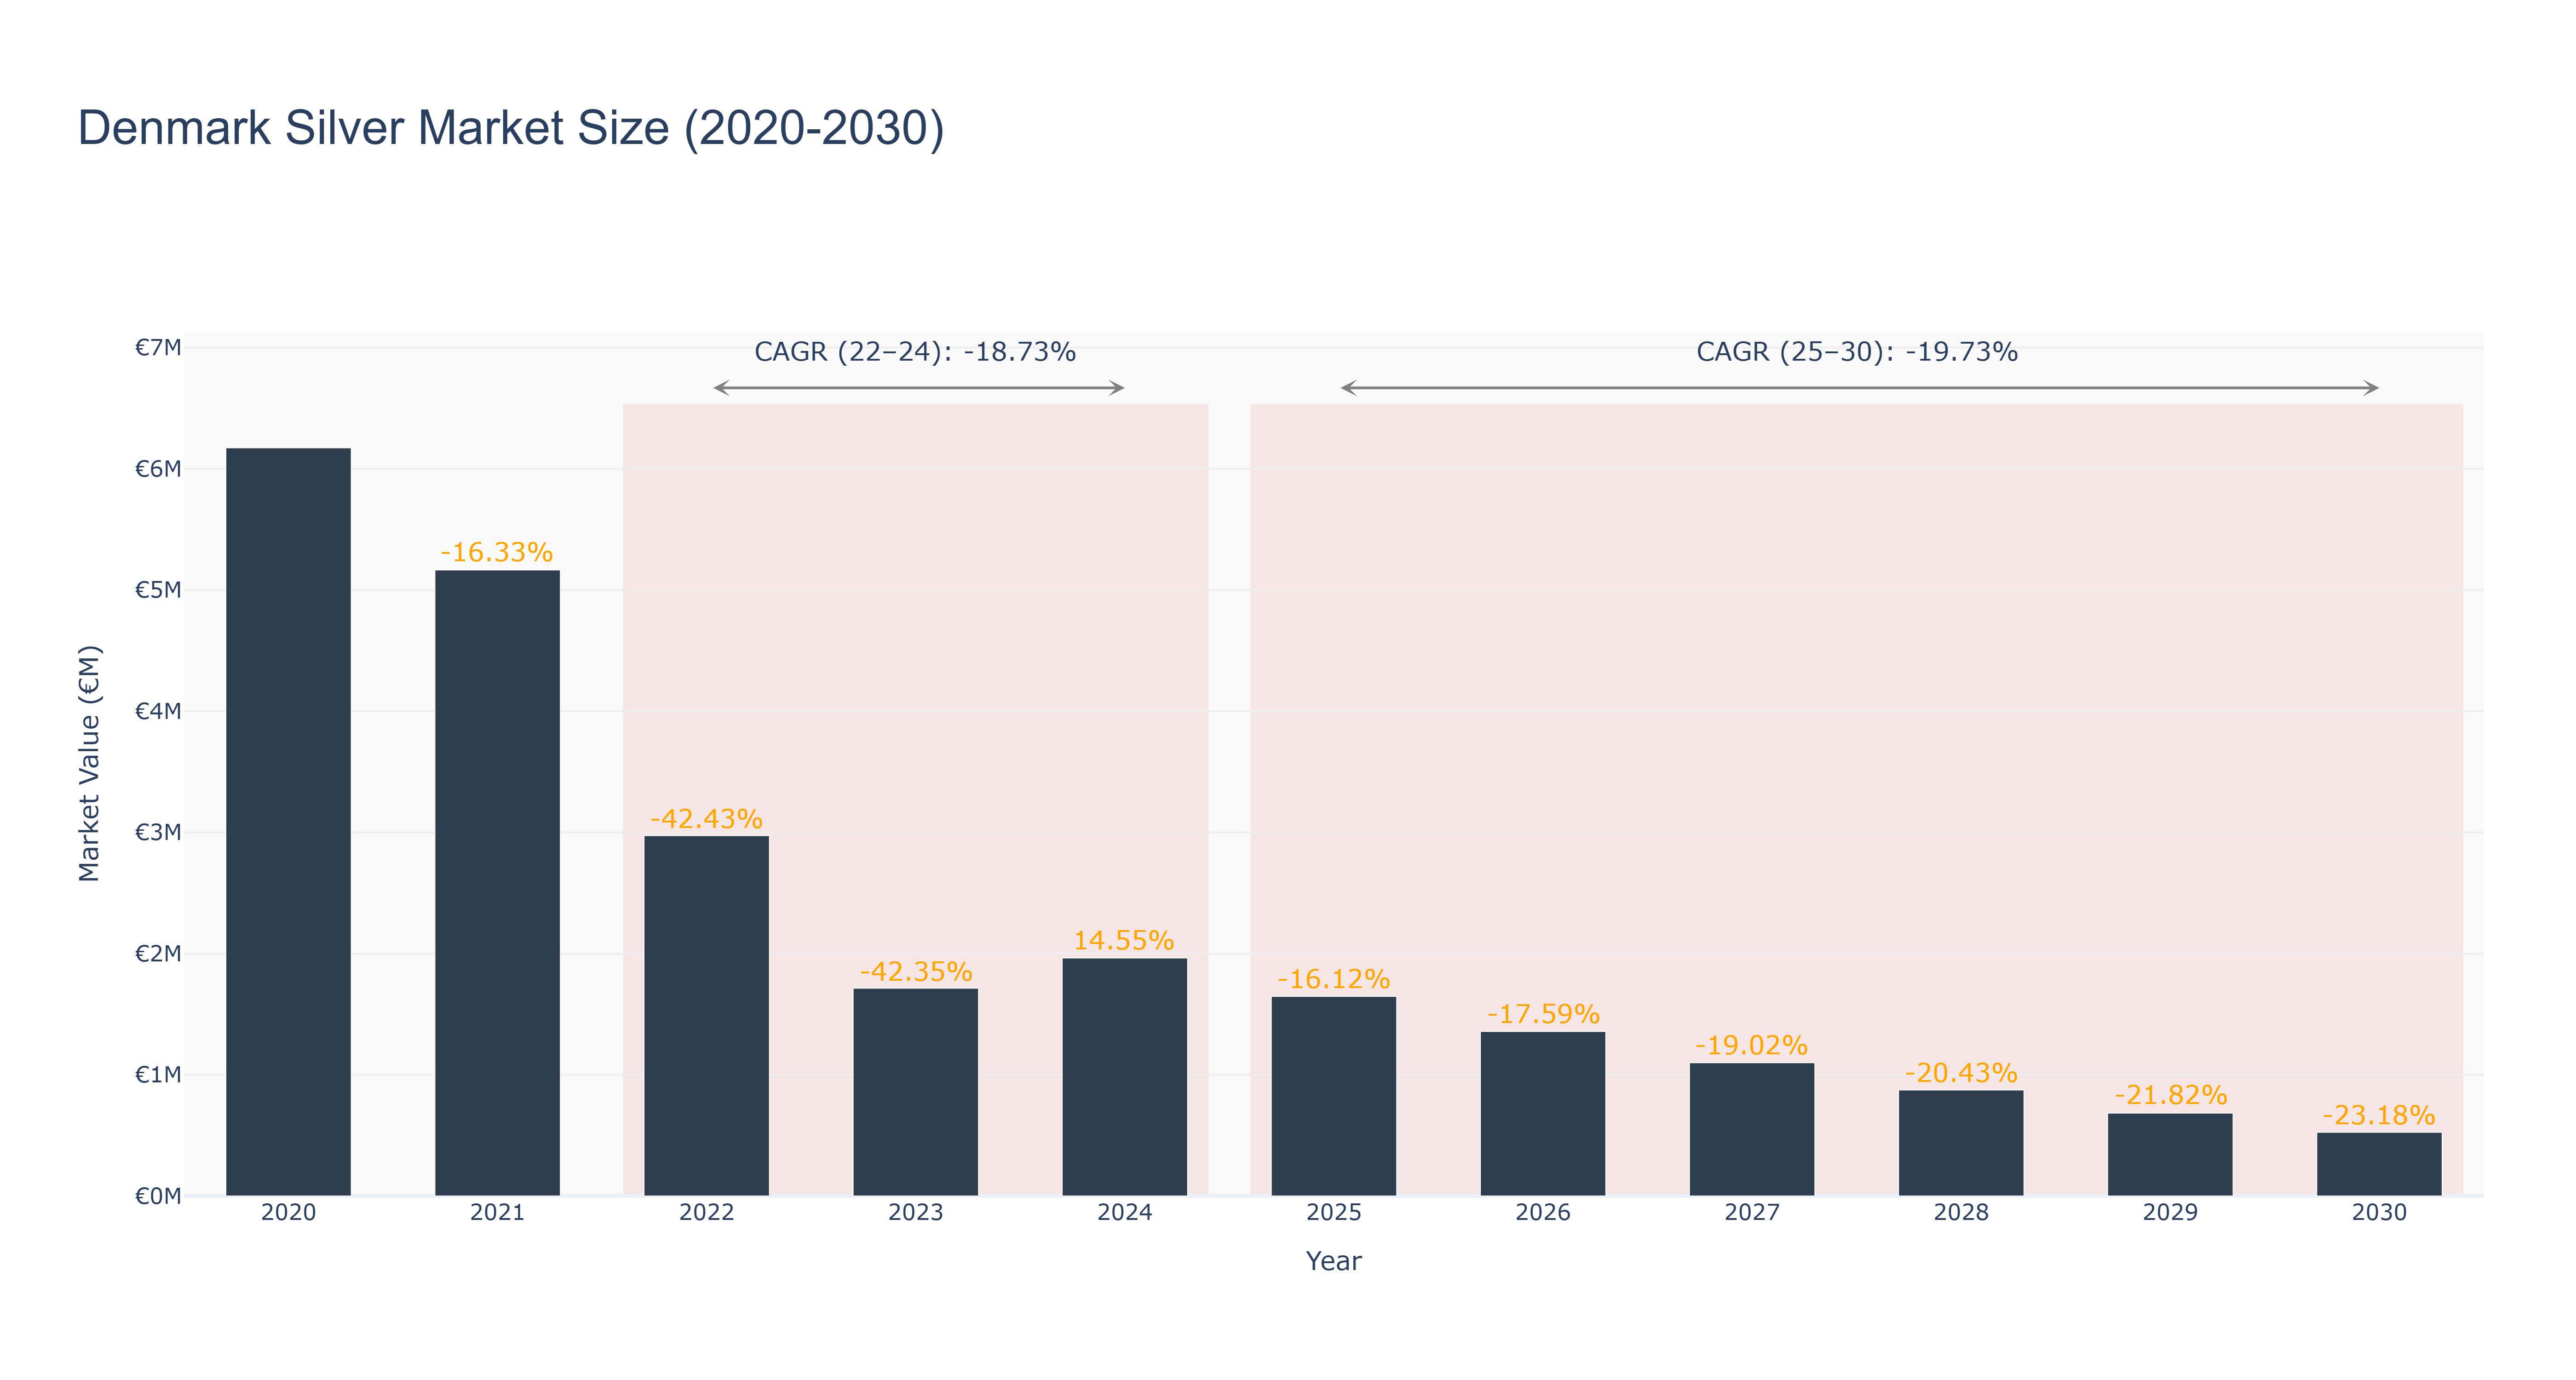
Denmark Silver Market has experienced a significant decline in market size over the past decade. The peak market size of €6.17 million was recorded in 2020, followed by a steady decrease to €0.53 million in 2030. The market saw a sharp decline from 2020 to 2024, with the market size falling to €1.96 million in 2024, before further decreasing to the current value. The CAGR from 2022 to 2024 was -18.73%, while the CAGR from 2025 to 2030 is projected at -19.73%. This downward trend can be attributed to various factors such as changing consumer preferences, economic uncertainties, and technological advancements in alternative materials. Looking ahead, Denmark is set to implement sustainability initiatives in the silver market, focusing on eco-friendly production methods and ethical sourcing practices to revitalize the industry.
Denmark Silver Market: Production & Trade Performance (2019-2025)
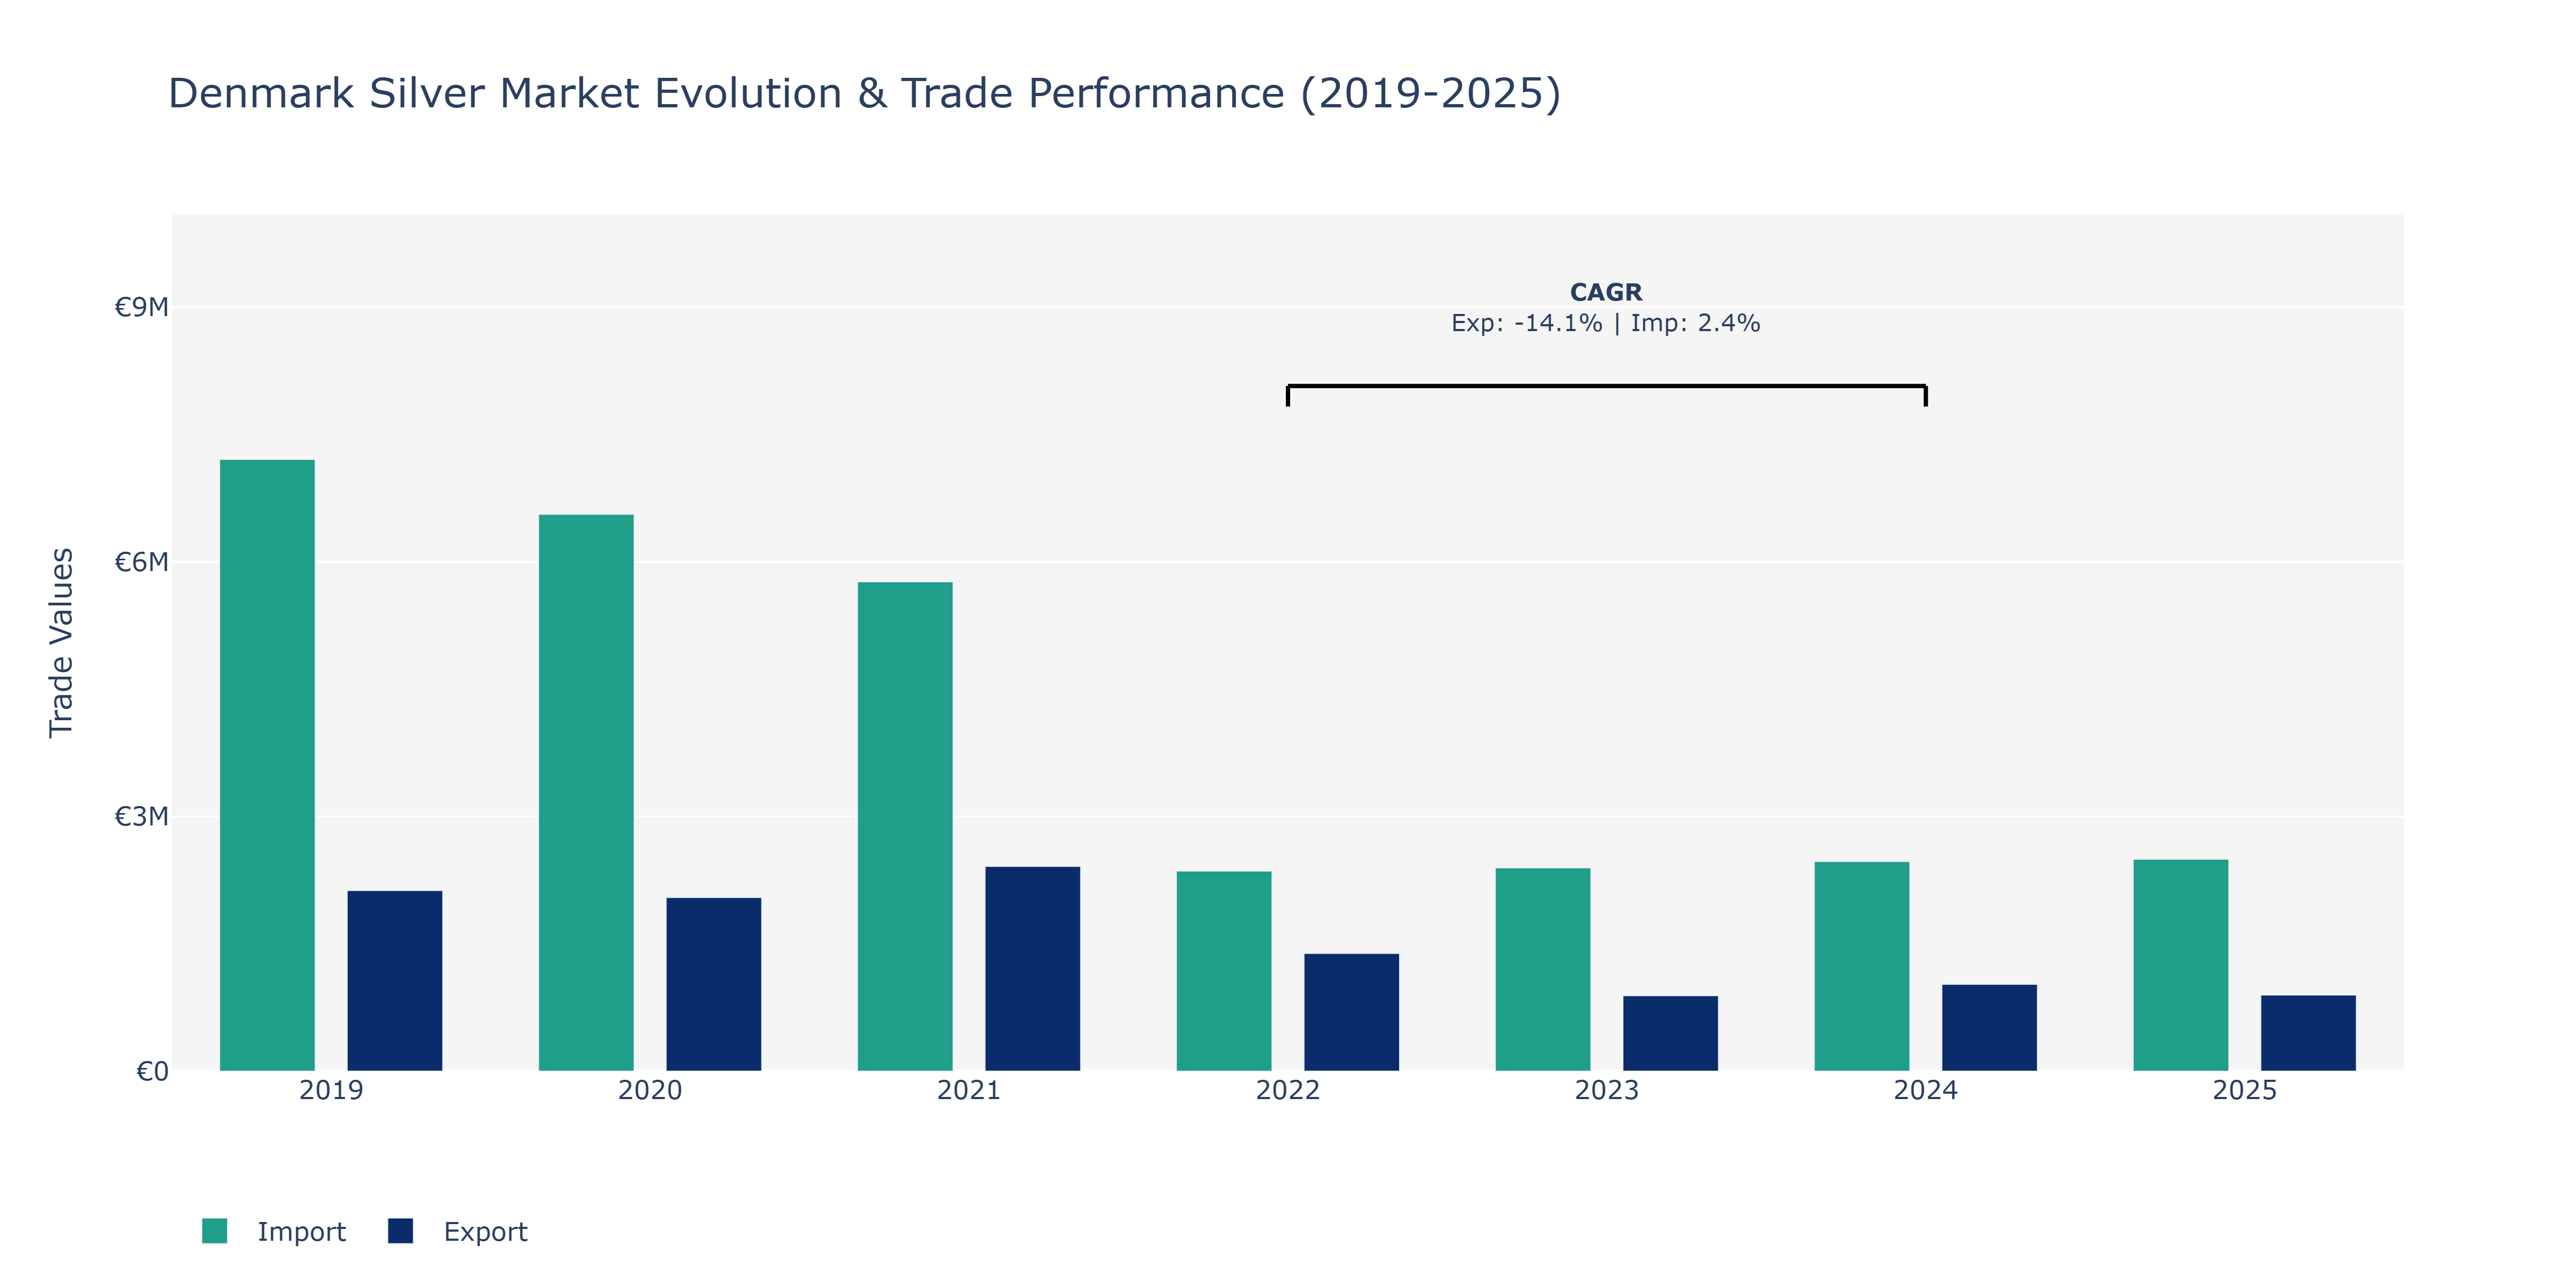
In the Denmark Silver Market, exports experienced a decline from €2.13 million in 2019 to €890.09 thousand in 2023 before showing a slight recovery to €1.02 million in 2024 and then further increasing to €897.81 thousand in 2025. This fluctuation can be attributed to global economic uncertainties impacting consumer demand for luxury goods like silver, leading to varying export volumes. On the other hand, imports followed a different trajectory, decreasing from €7.21 million in 2019 to €2.36 million in 2022, possibly due to supply chain disruptions and changing trade policies. The subsequent rise to €2.5 million in 2025 suggests a gradual recovery and stabilization of imports. The market may have adjusted to new trading conditions, showing resilience and adaptability in the face of market challenges, potentially due to strategic sourcing diversification efforts by market players to mitigate risks and ensure a stable supply chain in the volatile global economic landscape.
Key Highlights of the Report:
- Denmark Silver Market Outlook
- Market Size of Denmark Silver Market, 2025
- Forecast of Denmark Silver Market, 2032
- Historical Data and Forecast of Denmark Silver Revenues & Volume for the Period 2022 - 2032F
- Denmark Silver Market Trend Evolution
- Denmark Silver Market Drivers and Challenges
- Denmark Silver Price Trends
- Denmark Silver Porter`s Five Forces
- Denmark Silver Industry Life Cycle
- Historical Data and Forecast of Denmark Silver Market Revenues & Volume By Type for the Period 2022 - 2032F
- Historical Data and Forecast of Denmark Silver Market Revenues & Volume By Sterling Silver for the Period 2022 - 2032F
- Historical Data and Forecast of Denmark Silver Market Revenues & Volume By German Silver for the Period 2022 - 2032F
- Historical Data and Forecast of Denmark Silver Market Revenues & Volume By Coin Silver for the Period 2022 - 2032F
- Historical Data and Forecast of Denmark Silver Market Revenues & Volume By Britannia Silver for the Period 2022 - 2032F
- Historical Data and Forecast of Denmark Silver Market Revenues & Volume By Mexican Silver for the Period 2022 - 2032F
- Historical Data and Forecast of Denmark Silver Market Revenues & Volume By Russian Silver for the Period 2022 - 2032F
- Historical Data and Forecast of Denmark Silver Market Revenues & Volume By Oxidized Silver for the Period 2022 - 2032F
- Historical Data and Forecast of Denmark Sterling Silver Silver Market Revenues & Volume By Others for the Period 2022 - 2032F
- Historical Data and Forecast of Denmark Silver Market Revenues & Volume By Application for the Period 2022 - 2032F
- Historical Data and Forecast of Denmark Silver Market Revenues & Volume By Silverware for the Period 2022 - 2032F
- Historical Data and Forecast of Denmark Silver Market Revenues & Volume By Industrial for the Period 2022 - 2032F
- Historical Data and Forecast of Denmark Silver Market Revenues & Volume By Jewelry for the Period 2022 - 2032F
- Historical Data and Forecast of Denmark Silver Market Revenues & Volume By Investment for the Period 2022 - 2032F
- Historical Data and Forecast of Denmark Silver Market Revenues & Volume By Photographic for the Period 2022 - 2032F
- Historical Data and Forecast of Denmark Silver Market Revenues & Volume By Films for the Period 2022 - 2032F
- Historical Data and Forecast of Denmark Silver Market Revenues & Volume By Electrical And Electronics for the Period 2022 - 2032F
- Historical Data and Forecast of Denmark Silver Market Revenues & Volume By Pharmaceuticals for the Period 2022 - 2032F
- Denmark Silver Import Export Trade Statistics
- Market Opportunity Assessment By Type
- Market Opportunity Assessment By Application
- Denmark Silver Top Companies Market Share
- Denmark Silver Competitive Benchmarking By Technical and Operational Parameters
- Denmark Silver Company Profiles
- Denmark Silver Key Strategic Recommendations
Frequently Asked Questions About the Market Study (FAQs):
6Wresearch actively monitors the Denmark Silver Market and publishes its comprehensive annual report, highlighting emerging trends, growth drivers, revenue analysis, and forecast outlook. Our insights help businesses to make data-backed strategic decisions with ongoing market dynamics. Our analysts track relevent industries related to the Denmark Silver Market, allowing our clients with actionable intelligence and reliable forecasts tailored to emerging regional needs.
Yes, we provide customisation as per your requirements. To learn more, feel free to contact us on sales@6wresearch.com
1 Executive Summary |
2 Introduction |
2.1 Key Highlights of the Report |
2.2 Report Description |
2.3 Market Scope & Segmentation |
2.4 Research Methodology |
2.5 Assumptions |
3 Denmark Silver Market Overview |
3.1 Denmark Country Macro Economic Indicators |
3.2 Denmark Silver Market Revenues & Volume, 2022 & 2032F |
3.3 Denmark Silver Market - Industry Life Cycle |
3.4 Denmark Silver Market - Porter's Five Forces |
3.5 Denmark Silver Market Revenues & Volume Share, By Type, 2022 & 2032F |
3.6 Denmark Silver Market Revenues & Volume Share, By Application, 2022 & 2032F |
4 Denmark Silver Market Dynamics |
4.1 Impact Analysis |
4.2 Market Drivers |
4.2.1 Increasing disposable income levels in Denmark leading to higher spending on luxury items like silver products |
4.2.2 Growing awareness and preference for sustainable and ethically sourced silver products among Danish consumers |
4.2.3 Rising popularity of silver jewelry and accessories as fashion trends evolve |
4.3 Market Restraints |
4.3.1 Fluctuating silver prices in the global market affecting the cost of production and pricing of silver products in Denmark |
4.3.2 Competition from alternative materials like stainless steel or imitation silver impacting the demand for pure silver products |
4.3.3 Economic uncertainties and fluctuations in consumer spending patterns due to factors such as Brexit or global trade tensions |
5 Denmark Silver Market Trends |
6 Denmark Silver Market Segmentations |
6.1 Denmark Silver Market, By Type |
6.1.1 Overview and Analysis |
6.1.2 Denmark Silver Market Revenues & Volume, By Sterling Silver, 2022 - 2032F |
6.1.3 Denmark Silver Market Revenues & Volume, By German Silver, 2022 - 2032F |
6.1.4 Denmark Silver Market Revenues & Volume, By Coin Silver, 2022 - 2032F |
6.1.5 Denmark Silver Market Revenues & Volume, By Britannia Silver, 2022 - 2032F |
6.1.6 Denmark Silver Market Revenues & Volume, By Mexican Silver, 2022 - 2032F |
6.1.7 Denmark Silver Market Revenues & Volume, By Russian Silver, 2022 - 2032F |
6.1.9 Denmark Silver Market Revenues & Volume, By Others, 2022 - 2032F |
6.1.10 Denmark Silver Market Revenues & Volume, By Others, 2022 - 2032F |
6.2 Denmark Silver Market, By Application |
6.2.1 Overview and Analysis |
6.2.2 Denmark Silver Market Revenues & Volume, By Silverware, 2022 - 2032F |
6.2.3 Denmark Silver Market Revenues & Volume, By Industrial, 2022 - 2032F |
6.2.4 Denmark Silver Market Revenues & Volume, By Jewelry, 2022 - 2032F |
6.2.5 Denmark Silver Market Revenues & Volume, By Investment, 2022 - 2032F |
6.2.6 Denmark Silver Market Revenues & Volume, By Photographic , 2022 - 2032F |
6.2.7 Denmark Silver Market Revenues & Volume, By Films, 2022 - 2032F |
6.2.8 Denmark Silver Market Revenues & Volume, By Pharmaceuticals, 2022 - 2032F |
6.2.9 Denmark Silver Market Revenues & Volume, By Pharmaceuticals, 2022 - 2032F |
7 Denmark Silver Market Import-Export Trade Statistics |
7.1 Denmark Silver Market Export to Major Countries |
7.2 Denmark Silver Market Imports from Major Countries |
8 Denmark Silver Market Key Performance Indicators |
8.1 Average order value per customer for silver products |
8.2 Percentage of repeat customers purchasing silver items |
8.3 Number of new product launches or innovations in the silver market in Denmark |
8.4 Customer satisfaction ratings for silver products and services |
8.5 Percentage of revenue generated from eco-friendly or sustainable silver products |
9 Denmark Silver Market - Opportunity Assessment |
9.1 Denmark Silver Market Opportunity Assessment, By Type, 2022 & 2032F |
9.2 Denmark Silver Market Opportunity Assessment, By Application, 2022 & 2032F |
10 Denmark Silver Market - Competitive Landscape |
10.1 Denmark Silver Market Revenue Share, By Companies, 2025 |
10.2 Denmark Silver Market Competitive Benchmarking, By Operating and Technical Parameters |
11 Company Profiles |
12 Recommendations | 13 Disclaimer |
Global Go To Market Strategy - 2030
Export potential enables firms to identify high-growth global markets with greater confidence by combining advanced trade intelligence with a structured quantitative methodology. The framework analyzes emerging demand trends and country-level import patterns while integrating macroeconomic and trade datasets such as GDP and population forecasts, bilateral import–export flows, tariff structures, elasticity differentials between developed and developing economies, geographic distance, and import demand projections. Using weighted trade values from 2020–2024 as the base period to project country-to-country export potential for 2030, these inputs are operationalized through calculated drivers such as gravity model parameters, tariff impact factors, and projected GDP per-capita growth. Through an analysis of hidden potentials, demand hotspots, and market conditions that are most favorable to success, this method enables firms to focus on target countries, maximize returns, and global expansion with data, backed by accuracy.
By factoring in the projected importer demand gap that is currently unmet and could be potential opportunity, it identifies the potential for the Exporter (Country) among 190 countries, against the general trade analysis, which identifies the biggest importer or exporter.
To discover high-growth global markets and optimize your business strategy:
Click Here
Pricing
- Single User License$ 1,995
- Department License$ 2,400
- Site License$ 3,120
- Global License$ 3,795

Leadership Perspectives from Industry Events
Search
Thought Leadership and Analyst Meet


Our Clients
6WResearch In News
- India Export Attractiveness Tracker 2026
- India Air Conditioner Market Set for Strong Rebound in 2026 After Weather-Led Correction and GST-Driven Recovery: 6Wresearch
- ADAS in India: How Automatic Emergency Braking, Blind Spot Detection & Driver Monitoring are Transforming Road Safety
- Doha a strategic location for EV manufacturing hub: IPA Qatar
- Demand for luxury TVs surging in the GCC, says Samsung
- Empowering Growth: The Thriving Journey of Bangladesh’s Cable Industry
Latest Reports
- Nicaragua RPG Gaming Market (2026-2032)
- New Zealand RPG Gaming Market (2026-2032)
- Netherlands RPG Gaming Market (2026-2032)
- Nauru RPG Gaming Market (2026-2032)
- Namibia RPG Gaming Market (2026-2032)
- Mozambique RPG Gaming Market (2026-2032)
- Montenegro RPG Gaming Market (2026-2032)
- Mongolia RPG Gaming Market (2026-2032)
- Monaco RPG Gaming Market (2026-2032)
- Micronesia RPG Gaming Market (2026-2032)
Industry Events and Analyst Meet

EV India Expo 2026

HIMTEX 2026

India Refining Summit 2026

India EV Show 2026

EV tech India Expo 2026
Whitepaper
- Middle East & Africa Commercial Security Market Click here to view more.
- Middle East & Africa Fire Safety Systems & Equipment Market Click here to view more.
- GCC Drone Market Click here to view more.
- Middle East Lighting Fixture Market Click here to view more.
- GCC Physical & Perimeter Security Market Click here to view more.