Denmark Table linen Market (2026-2032) | Forecast, Value, Industry, Outlook, Analysis, Trends, Revenue, Size, Share, Segmentation, Growth & Companies
Market Forecast By Material (Cotton, Artificial Fibers, Linen Silk, Others), By Application (Residential, Commercial), By Distribution Channel (Hypermarket/Supermarket, Specialty Stores, Online) And Competitive Landscape
| Product Code: ETC5524161 | Publication Date: Nov 2023 | Updated Date: Apr 2026 | Product Type: Market Research Report | |
| Publisher: 6Wresearch | Author: Ravi Bhandari | No. of Pages: 60 | No. of Figures: 30 | No. of Tables: 5 |
Denmark Table Linen Market Size (2020-2030)
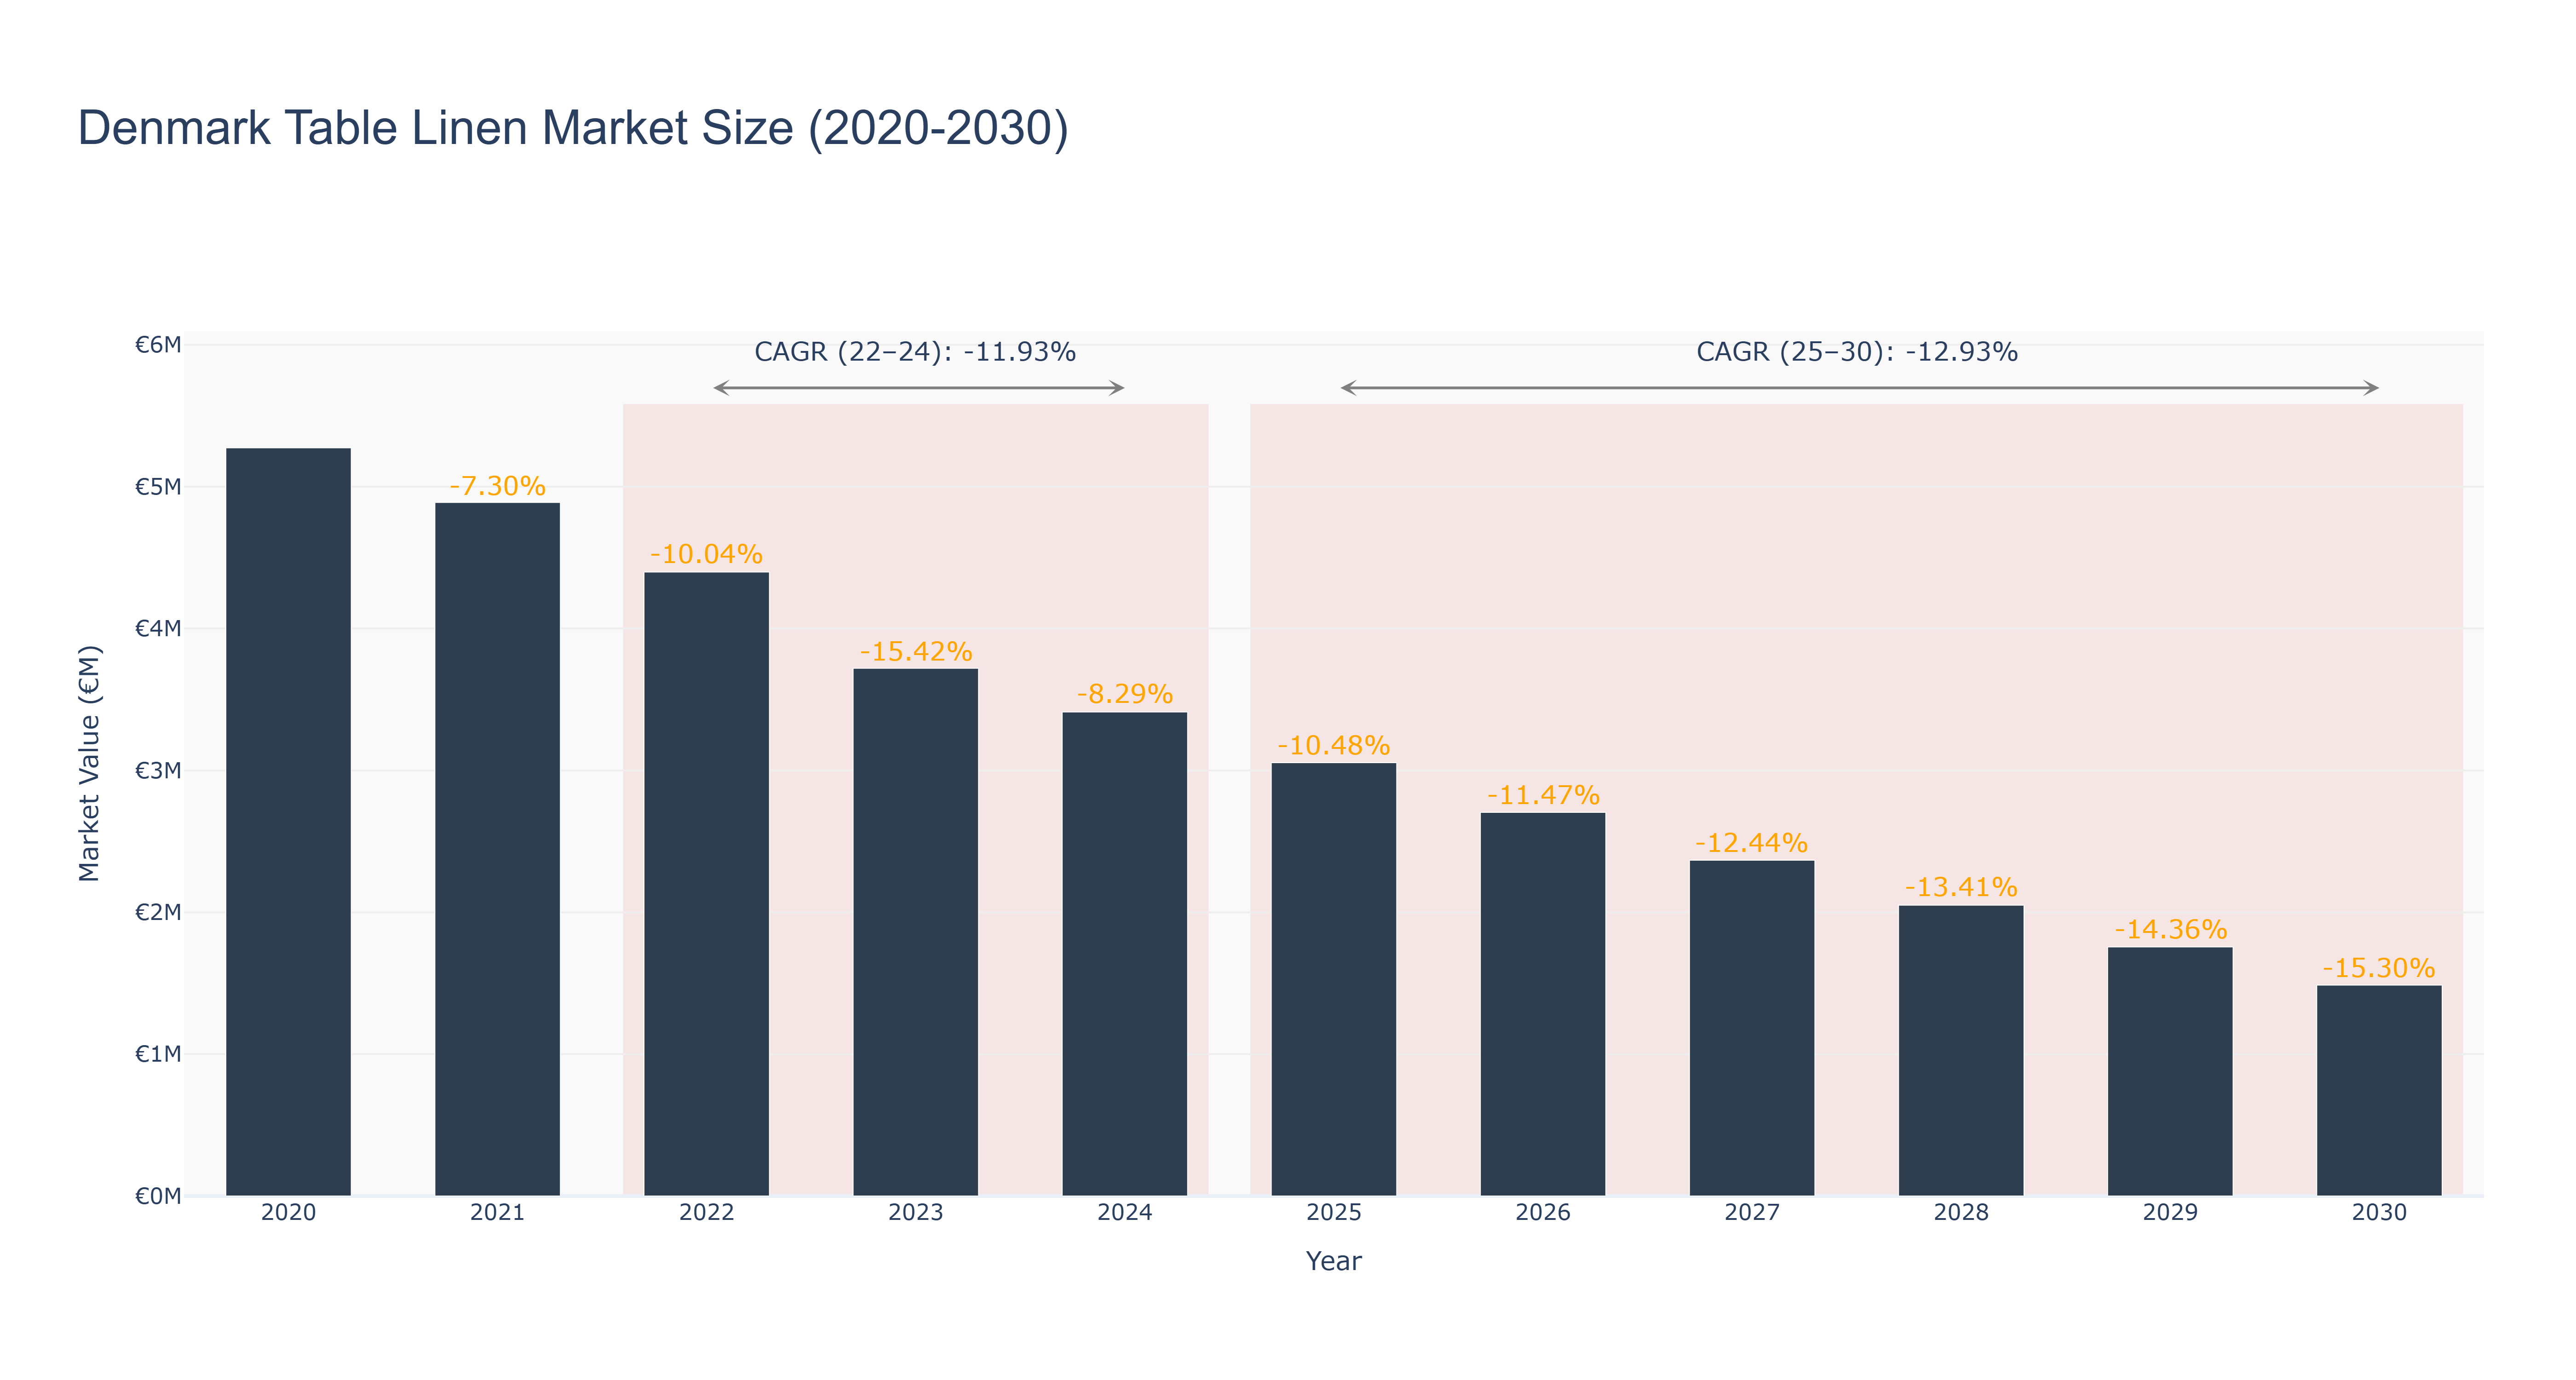
The Denmark Table Linen Market has experienced a significant decline in market size over the past decade. The peak market size of €5.27 million was recorded in 2020, followed by a steady decrease to €1.49 million in 2030. The market saw a sharp decline from 2020 to 2024, with actual market sizes decreasing from €5.27 million to €3.41 million. Forecasted market sizes from 2025 to 2030 show a continued downward trend. The CAGR values reflect this downward trajectory, with -11.93% from 2022 to 2024 and -12.93% from 2025 to 2030. Industry drivers such as changing consumer preferences and economic conditions may have contributed to this decline. Looking ahead, upcoming sustainability initiatives in the textile industry are expected to impact the market positively, fostering growth opportunities in eco-friendly table linen products.
Denmark Table Linen Market: Production & Trade Performance (2019-2025)
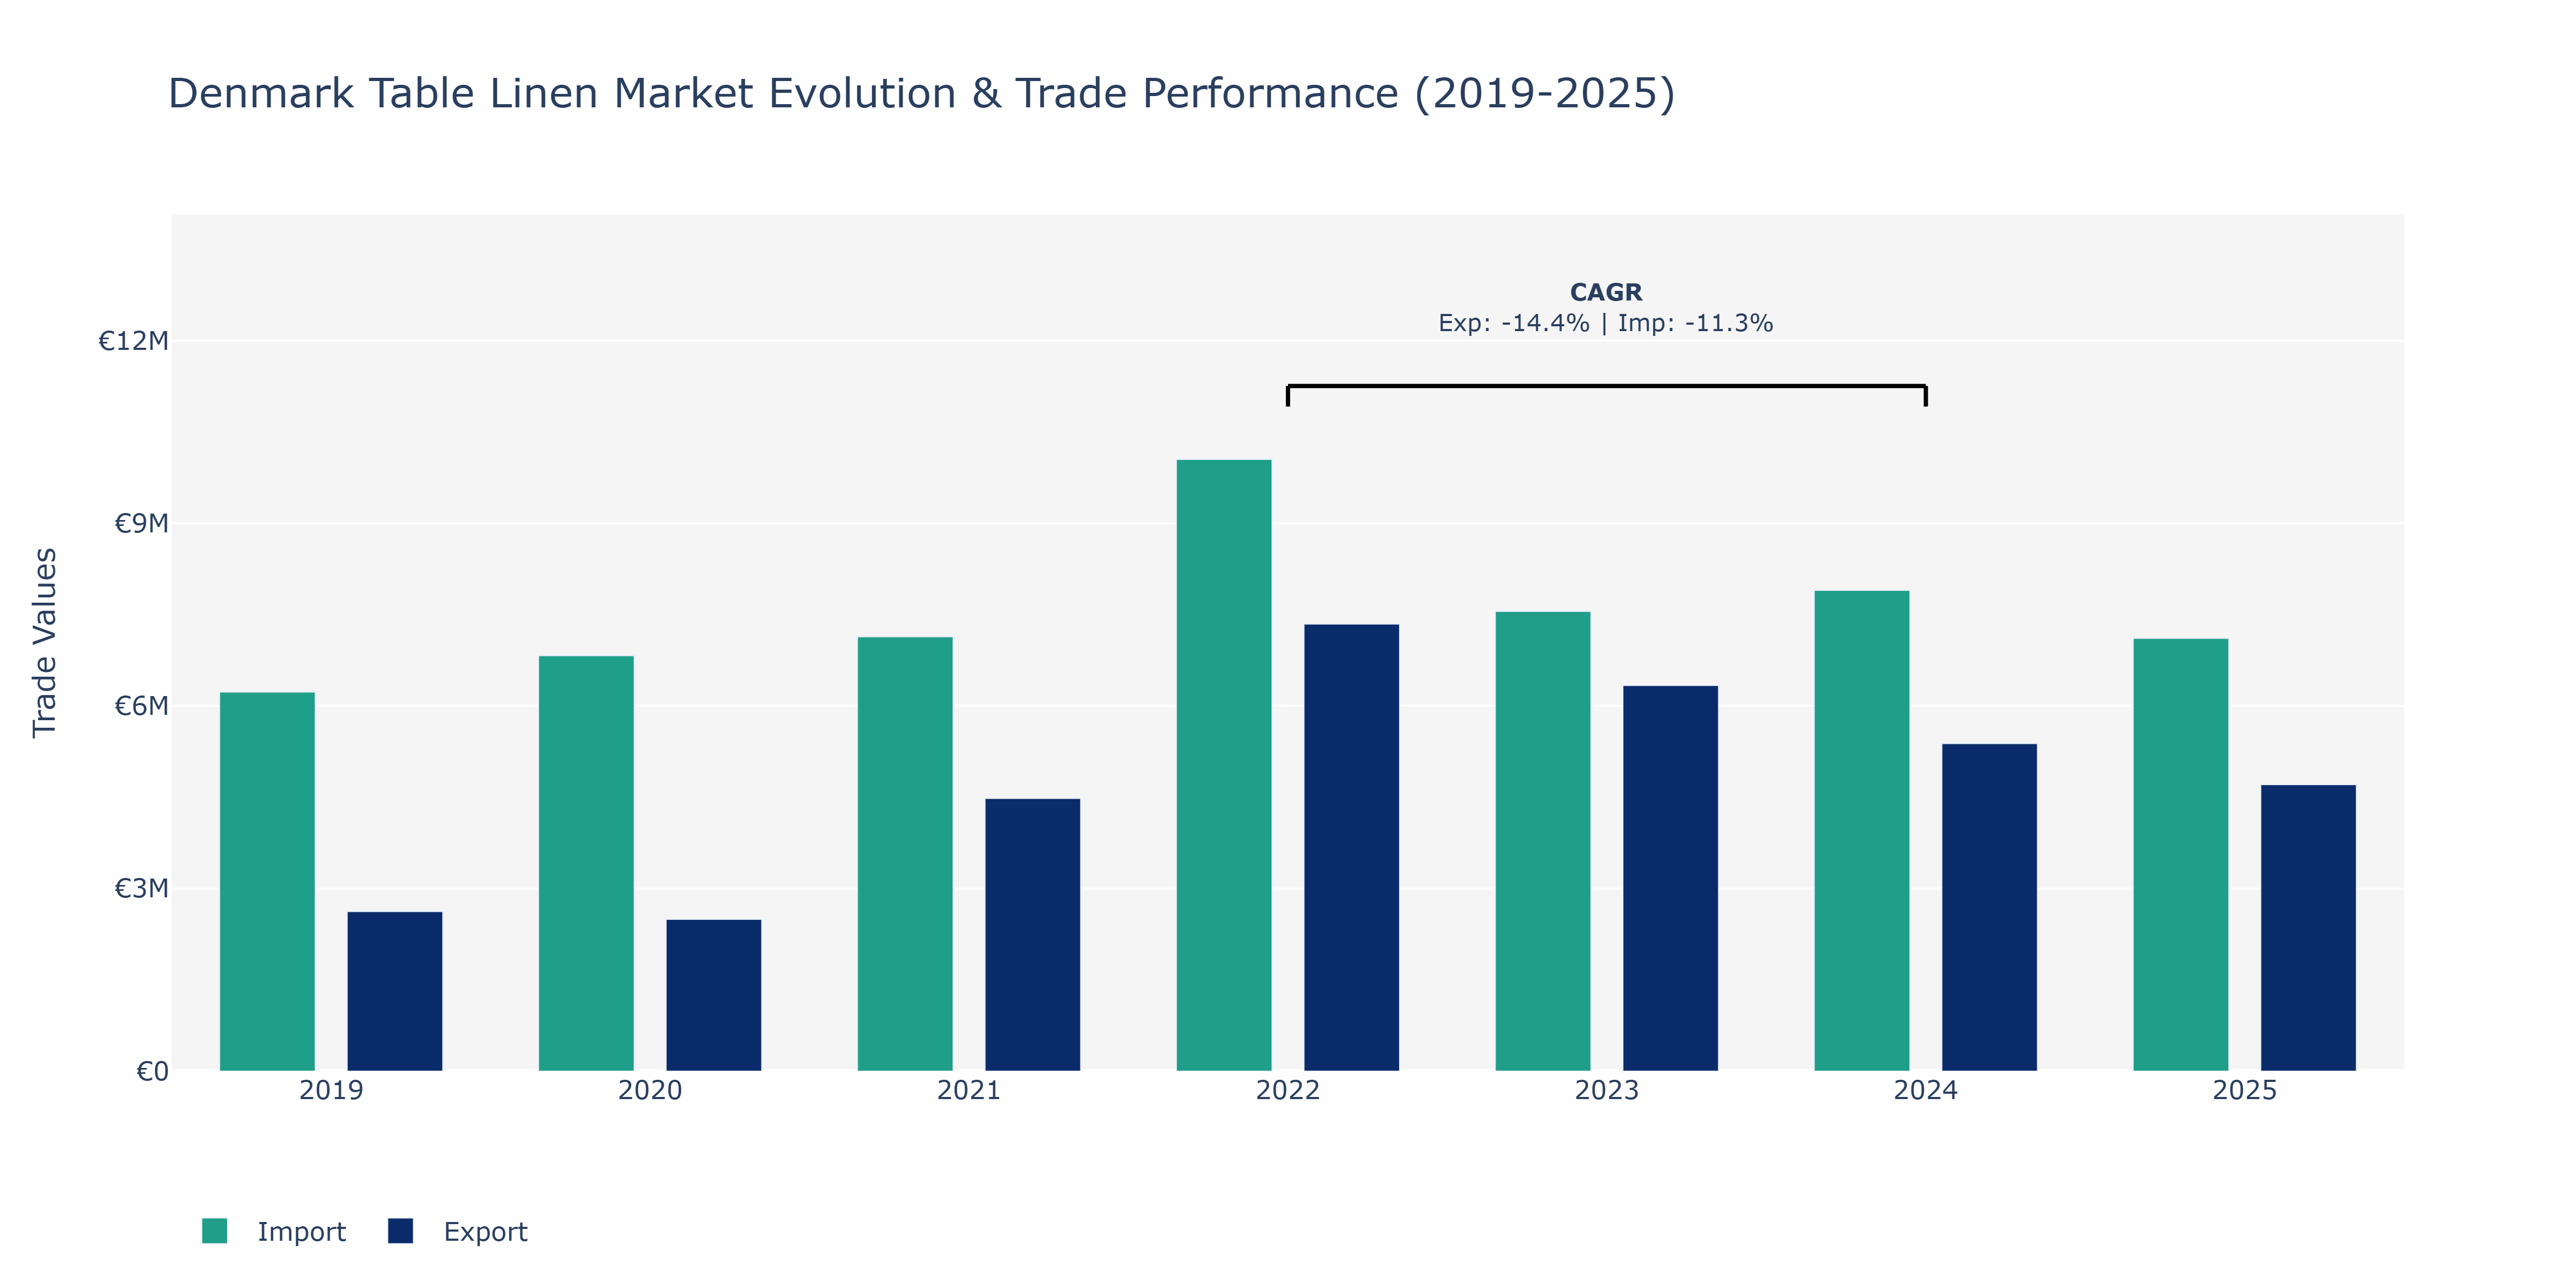
Between 2019 and 2025, Denmark's Table Linen Market saw fluctuations in both Exports and Imports. Exports started at €2.62 million in 2019, dipped to €2.5 million in 2020, then surged to a peak of €7.35 million in 2022, before gradually declining to €4.71 million in 2025. Conversely, Imports began at €6.23 million in 2019, increased to €7.14 million in 2021, peaked at €10.05 million in 2022, and then decreased to €7.11 million by 2025. The notable rise in exports in 2022 could be attributed to increased international demand for Danish table linen products due to their high quality and unique designs. Conversely, the fluctuations in imports might reflect changes in global supply chain dynamics, such as trade agreements affecting the import costs of raw materials for table linen production. The decrease in both exports and imports post-2022 may suggest a market correction or a shift in consumer preferences towards alternative products.
Key Highlights of the Report:
- Denmark Table linen Market Outlook
- Market Size of Denmark Table linen Market, 2025
- Forecast of Denmark Table linen Market, 2032
- Historical Data and Forecast of Denmark Table linen Revenues & Volume for the Period 2022 - 2032F
- Denmark Table linen Market Trend Evolution
- Denmark Table linen Market Drivers and Challenges
- Denmark Table linen Price Trends
- Denmark Table linen Porter`s Five Forces
- Denmark Table linen Industry Life Cycle
- Historical Data and Forecast of Denmark Table linen Market Revenues & Volume By Material for the Period 2022 - 2032F
- Historical Data and Forecast of Denmark Table linen Market Revenues & Volume By Cotton for the Period 2022 - 2032F
- Historical Data and Forecast of Denmark Table linen Market Revenues & Volume By Artificial Fibers for the Period 2022 - 2032F
- Historical Data and Forecast of Denmark Table linen Market Revenues & Volume By Linen Silk for the Period 2022 - 2032F
- Historical Data and Forecast of Denmark Table linen Market Revenues & Volume By Others for the Period 2022 - 2032F
- Historical Data and Forecast of Denmark Table linen Market Revenues & Volume By Application for the Period 2022 - 2032F
- Historical Data and Forecast of Denmark Table linen Market Revenues & Volume By Residential for the Period 2022 - 2032F
- Historical Data and Forecast of Denmark Table linen Market Revenues & Volume By Commercial for the Period 2022 - 2032F
- Historical Data and Forecast of Denmark Table linen Market Revenues & Volume By Distribution Channel for the Period 2022 - 2032F
- Historical Data and Forecast of Denmark Table linen Market Revenues & Volume By Hypermarket/Supermarket for the Period 2022 - 2032F
- Historical Data and Forecast of Denmark Table linen Market Revenues & Volume By Specialty Stores for the Period 2022 - 2032F
- Historical Data and Forecast of Denmark Table linen Market Revenues & Volume By Online for the Period 2022 - 2032F
- Denmark Table linen Import Export Trade Statistics
- Market Opportunity Assessment By Material
- Market Opportunity Assessment By Application
- Market Opportunity Assessment By Distribution Channel
- Denmark Table linen Top Companies Market Share
- Denmark Table linen Competitive Benchmarking By Technical and Operational Parameters
- Denmark Table linen Company Profiles
- Denmark Table linen Key Strategic Recommendations
Frequently Asked Questions About the Market Study (FAQs):
6Wresearch actively monitors the Denmark Table linen Market and publishes its comprehensive annual report, highlighting emerging trends, growth drivers, revenue analysis, and forecast outlook. Our insights help businesses to make data-backed strategic decisions with ongoing market dynamics. Our analysts track relevent industries related to the Denmark Table linen Market, allowing our clients with actionable intelligence and reliable forecasts tailored to emerging regional needs.
Yes, we provide customisation as per your requirements. To learn more, feel free to contact us on sales@6wresearch.com
1 Executive Summary |
2 Introduction |
2.1 Key Highlights of the Report |
2.2 Report Description |
2.3 Market Scope & Segmentation |
2.4 Research Methodology |
2.5 Assumptions |
3 Denmark Table linen Market Overview |
3.1 Denmark Country Macro Economic Indicators |
3.2 Denmark Table linen Market Revenues & Volume, 2022 & 2032F |
3.3 Denmark Table linen Market - Industry Life Cycle |
3.4 Denmark Table linen Market - Porter's Five Forces |
3.5 Denmark Table linen Market Revenues & Volume Share, By Material, 2022 & 2032F |
3.6 Denmark Table linen Market Revenues & Volume Share, By Application, 2022 & 2032F |
3.7 Denmark Table linen Market Revenues & Volume Share, By Distribution Channel, 2022 & 2032F |
4 Denmark Table linen Market Dynamics |
4.1 Impact Analysis |
4.2 Market Drivers |
4.2.1 Increasing focus on home decor and interior design trends |
4.2.2 Growing demand for eco-friendly and sustainable products |
4.2.3 Rise in disposable income leading to higher spending on luxury items |
4.3 Market Restraints |
4.3.1 Fluctuating raw material prices impacting production costs |
4.3.2 Intense competition from other home textile products |
4.3.3 Economic uncertainty affecting consumer purchasing power |
5 Denmark Table linen Market Trends |
6 Denmark Table linen Market Segmentations |
6.1 Denmark Table linen Market, By Material |
6.1.1 Overview and Analysis |
6.1.2 Denmark Table linen Market Revenues & Volume, By Cotton, 2022 - 2032F |
6.1.3 Denmark Table linen Market Revenues & Volume, By Artificial Fibers, 2022 - 2032F |
6.1.4 Denmark Table linen Market Revenues & Volume, By Linen Silk, 2022 - 2032F |
6.1.5 Denmark Table linen Market Revenues & Volume, By Others, 2022 - 2032F |
6.2 Denmark Table linen Market, By Application |
6.2.1 Overview and Analysis |
6.2.2 Denmark Table linen Market Revenues & Volume, By Residential, 2022 - 2032F |
6.2.3 Denmark Table linen Market Revenues & Volume, By Commercial, 2022 - 2032F |
6.3 Denmark Table linen Market, By Distribution Channel |
6.3.1 Overview and Analysis |
6.3.2 Denmark Table linen Market Revenues & Volume, By Hypermarket/Supermarket, 2022 - 2032F |
6.3.3 Denmark Table linen Market Revenues & Volume, By Specialty Stores, 2022 - 2032F |
6.3.4 Denmark Table linen Market Revenues & Volume, By Online, 2022 - 2032F |
7 Denmark Table linen Market Import-Export Trade Statistics |
7.1 Denmark Table linen Market Export to Major Countries |
7.2 Denmark Table linen Market Imports from Major Countries |
8 Denmark Table linen Market Key Performance Indicators |
8.1 Customer satisfaction score from product reviews |
8.2 Number of repeat customers |
8.3 Percentage of sales from new product lines |
8.4 Average order value |
8.5 Social media engagement and brand awareness metrics |
9 Denmark Table linen Market - Opportunity Assessment |
9.1 Denmark Table linen Market Opportunity Assessment, By Material, 2022 & 2032F |
9.2 Denmark Table linen Market Opportunity Assessment, By Application, 2022 & 2032F |
9.3 Denmark Table linen Market Opportunity Assessment, By Distribution Channel, 2022 & 2032F |
10 Denmark Table linen Market - Competitive Landscape |
10.1 Denmark Table linen Market Revenue Share, By Companies, 2025 |
10.2 Denmark Table linen Market Competitive Benchmarking, By Operating and Technical Parameters |
11 Company Profiles |
12 Recommendations | 13 Disclaimer |
Global Go To Market Strategy - 2030
Export potential enables firms to identify high-growth global markets with greater confidence by combining advanced trade intelligence with a structured quantitative methodology. The framework analyzes emerging demand trends and country-level import patterns while integrating macroeconomic and trade datasets such as GDP and population forecasts, bilateral import–export flows, tariff structures, elasticity differentials between developed and developing economies, geographic distance, and import demand projections. Using weighted trade values from 2020–2024 as the base period to project country-to-country export potential for 2030, these inputs are operationalized through calculated drivers such as gravity model parameters, tariff impact factors, and projected GDP per-capita growth. Through an analysis of hidden potentials, demand hotspots, and market conditions that are most favorable to success, this method enables firms to focus on target countries, maximize returns, and global expansion with data, backed by accuracy.
By factoring in the projected importer demand gap that is currently unmet and could be potential opportunity, it identifies the potential for the Exporter (Country) among 190 countries, against the general trade analysis, which identifies the biggest importer or exporter.
To discover high-growth global markets and optimize your business strategy:
Click Here
Pricing
- Single User License$ 1,995
- Department License$ 2,400
- Site License$ 3,120
- Global License$ 3,795

Leadership Perspectives from Industry Events
Search
Thought Leadership and Analyst Meet


Our Clients
6WResearch In News
- India Export Attractiveness Tracker 2026
- India Air Conditioner Market Set for Strong Rebound in 2026 After Weather-Led Correction and GST-Driven Recovery: 6Wresearch
- ADAS in India: How Automatic Emergency Braking, Blind Spot Detection & Driver Monitoring are Transforming Road Safety
- Doha a strategic location for EV manufacturing hub: IPA Qatar
- Demand for luxury TVs surging in the GCC, says Samsung
- Empowering Growth: The Thriving Journey of Bangladesh’s Cable Industry
Latest Reports
- Nicaragua RPG Gaming Market (2026-2032)
- New Zealand RPG Gaming Market (2026-2032)
- Netherlands RPG Gaming Market (2026-2032)
- Nauru RPG Gaming Market (2026-2032)
- Namibia RPG Gaming Market (2026-2032)
- Mozambique RPG Gaming Market (2026-2032)
- Montenegro RPG Gaming Market (2026-2032)
- Mongolia RPG Gaming Market (2026-2032)
- Monaco RPG Gaming Market (2026-2032)
- Micronesia RPG Gaming Market (2026-2032)
Industry Events and Analyst Meet

EV India Expo 2026

HIMTEX 2026

India Refining Summit 2026

India EV Show 2026

EV tech India Expo 2026
Whitepaper
- Middle East & Africa Commercial Security Market Click here to view more.
- Middle East & Africa Fire Safety Systems & Equipment Market Click here to view more.
- GCC Drone Market Click here to view more.
- Middle East Lighting Fixture Market Click here to view more.
- GCC Physical & Perimeter Security Market Click here to view more.