Denmark Twine Market (2026-2032) | Forecast, Outlook, Value, Companies, Industry, Size, Segmentation, Analysis, Revenue, Share, Growth & Trends
Market Forecast By Type (Polyethylene Rope Twine, Metal Rope Twine, Other), By Applications (Industrial, Construction, Oil, Coal mine, Other) And Competitive Landscape
| Product Code: ETC5821549 | Publication Date: Nov 2023 | Updated Date: Apr 2026 | Product Type: Market Research Report | |
| Publisher: 6Wresearch | Author: Ravi Bhandari | No. of Pages: 60 | No. of Figures: 30 | No. of Tables: 5 |
Denmark Twine Market Size (2020-2030)
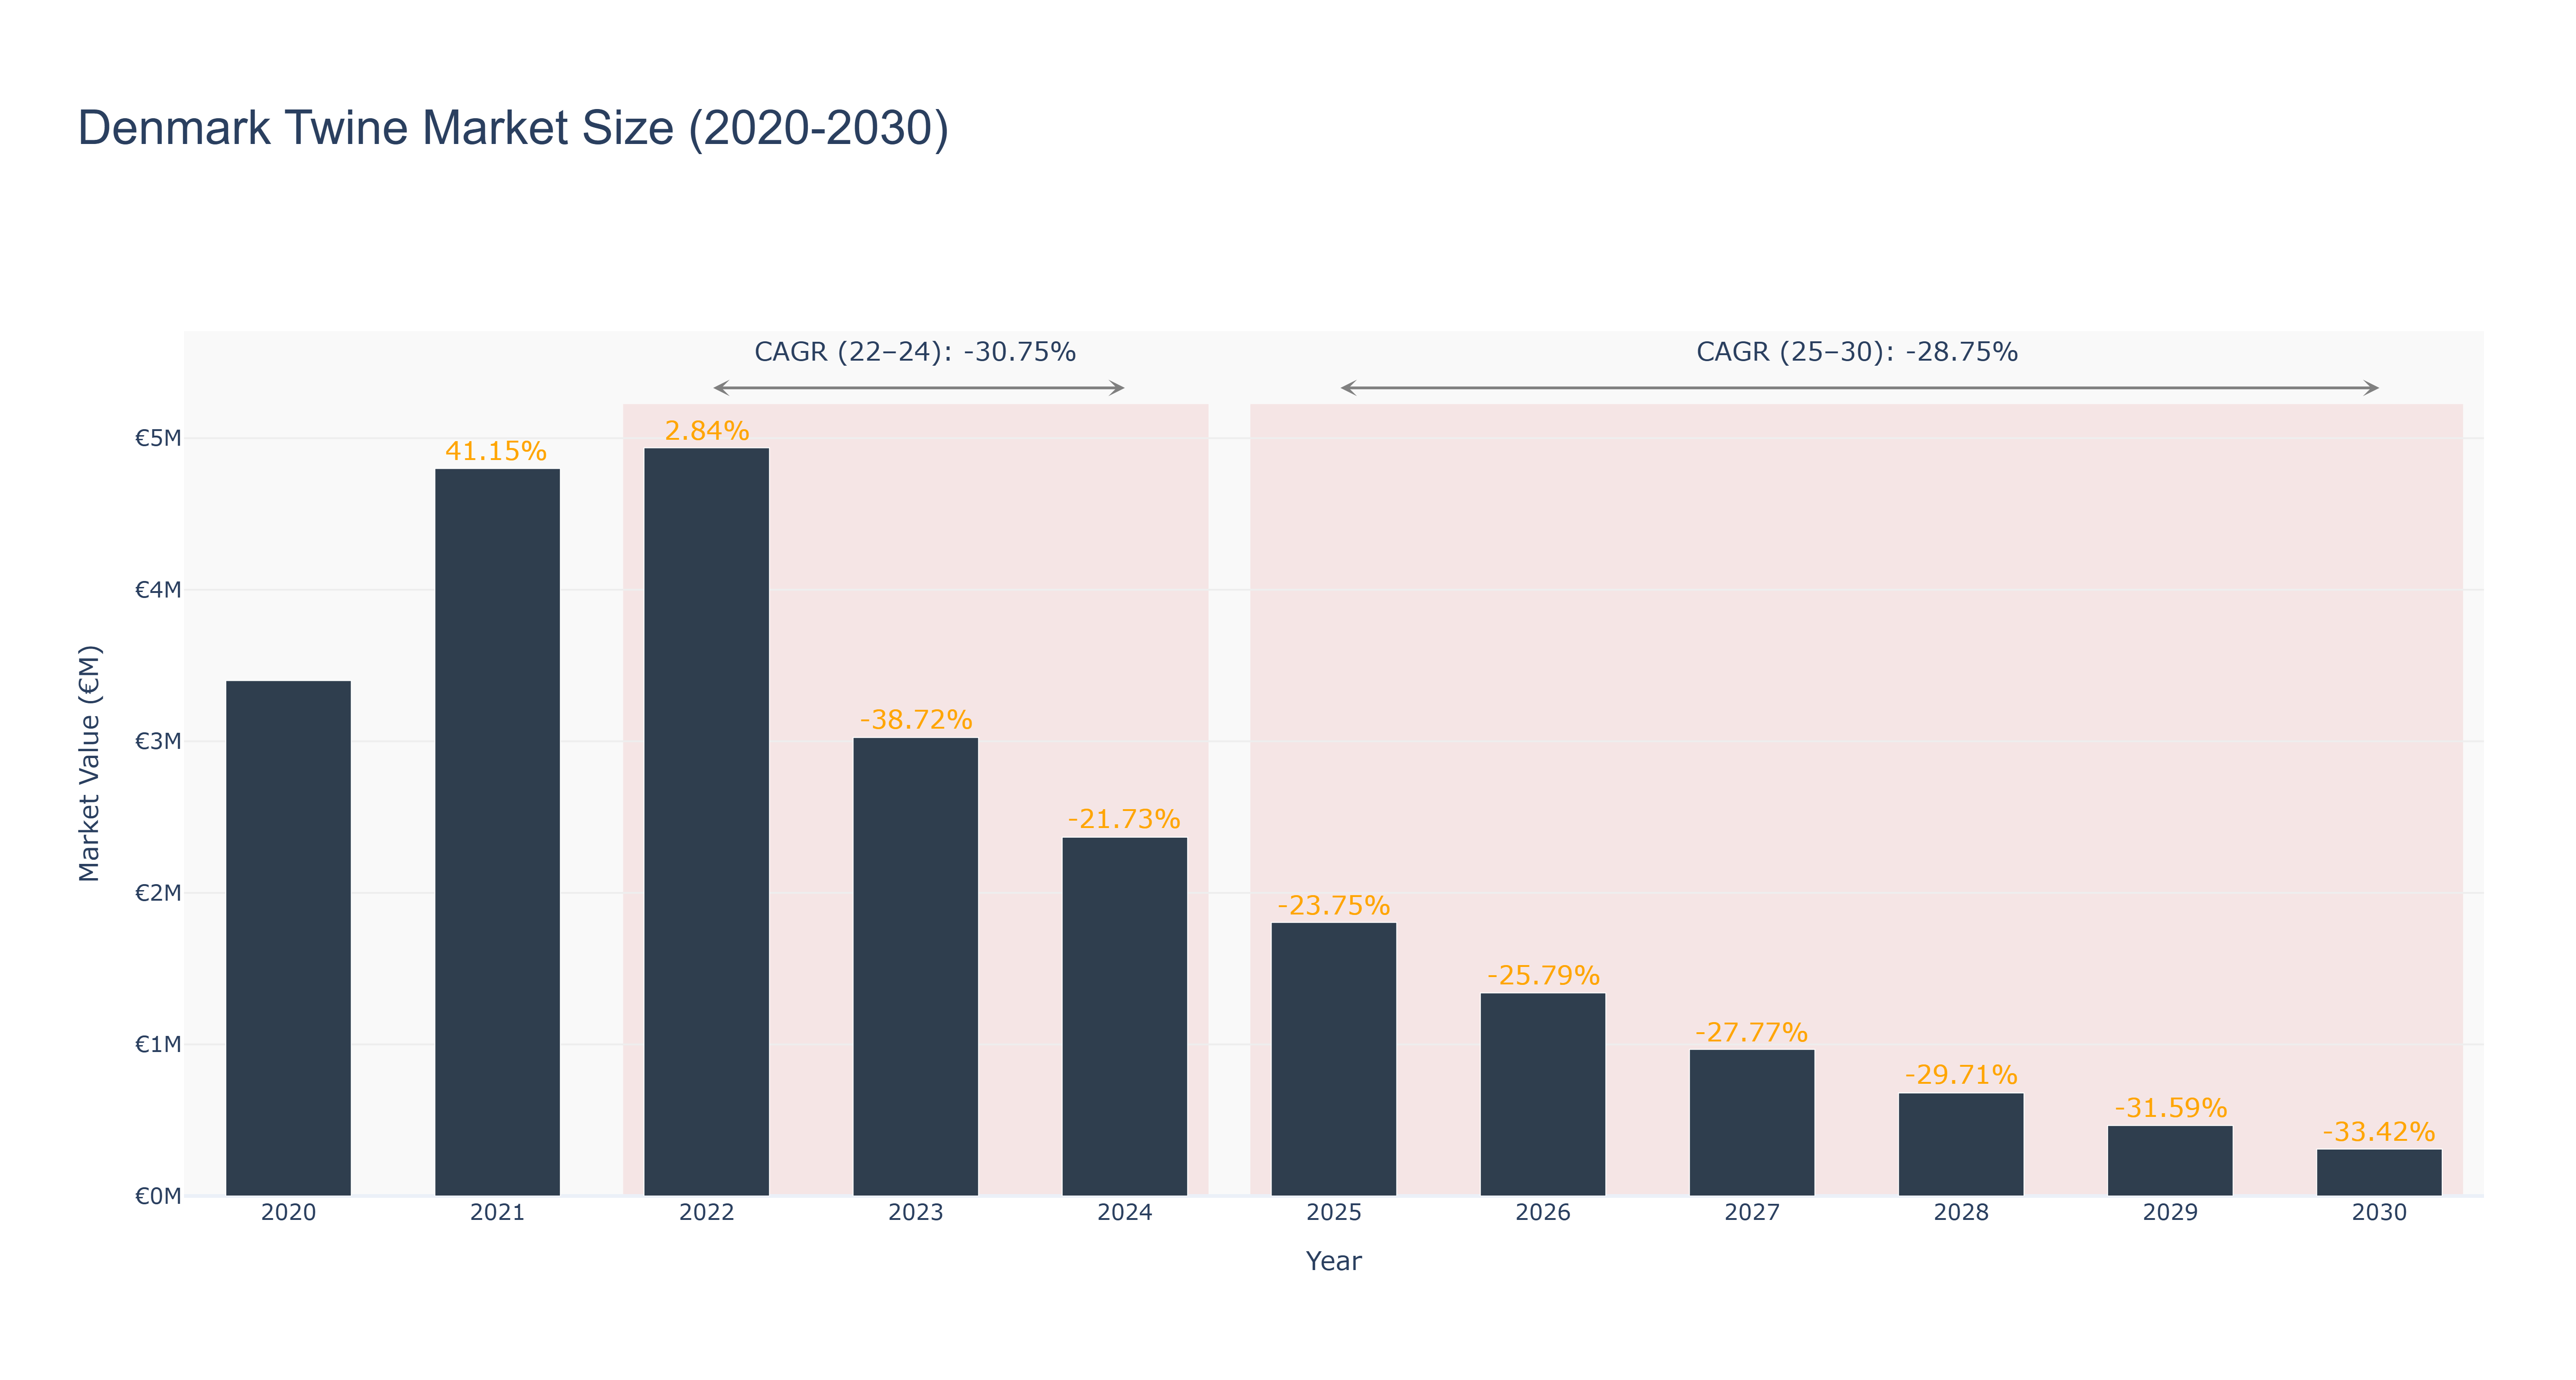
Denmark Twine Market has shown a declining trend over the years, with a peak market size of €4.94 million in 2022. The actual market size decreased to €2.37 million in 2024, reflecting a negative growth trend. Forecasted market size from 2025 to 2030 is expected to continue this downward trajectory, with a projected market size of €0.31 million in 2030. The CAGR values further confirm this trend, with a CAGR of -30.75% from 2022 to 2024 and -28.75% from 2025 to 2030. The market's decline can be attributed to various factors such as changing consumer preferences, economic fluctuations, and technological advancements impacting the industry. Looking ahead, Denmark Twine Market is anticipated to focus on sustainability initiatives and digital transformation to adapt to changing market dynamics and drive future growth.
Denmark Twine Market: Production & Trade Performance (2019-2025)
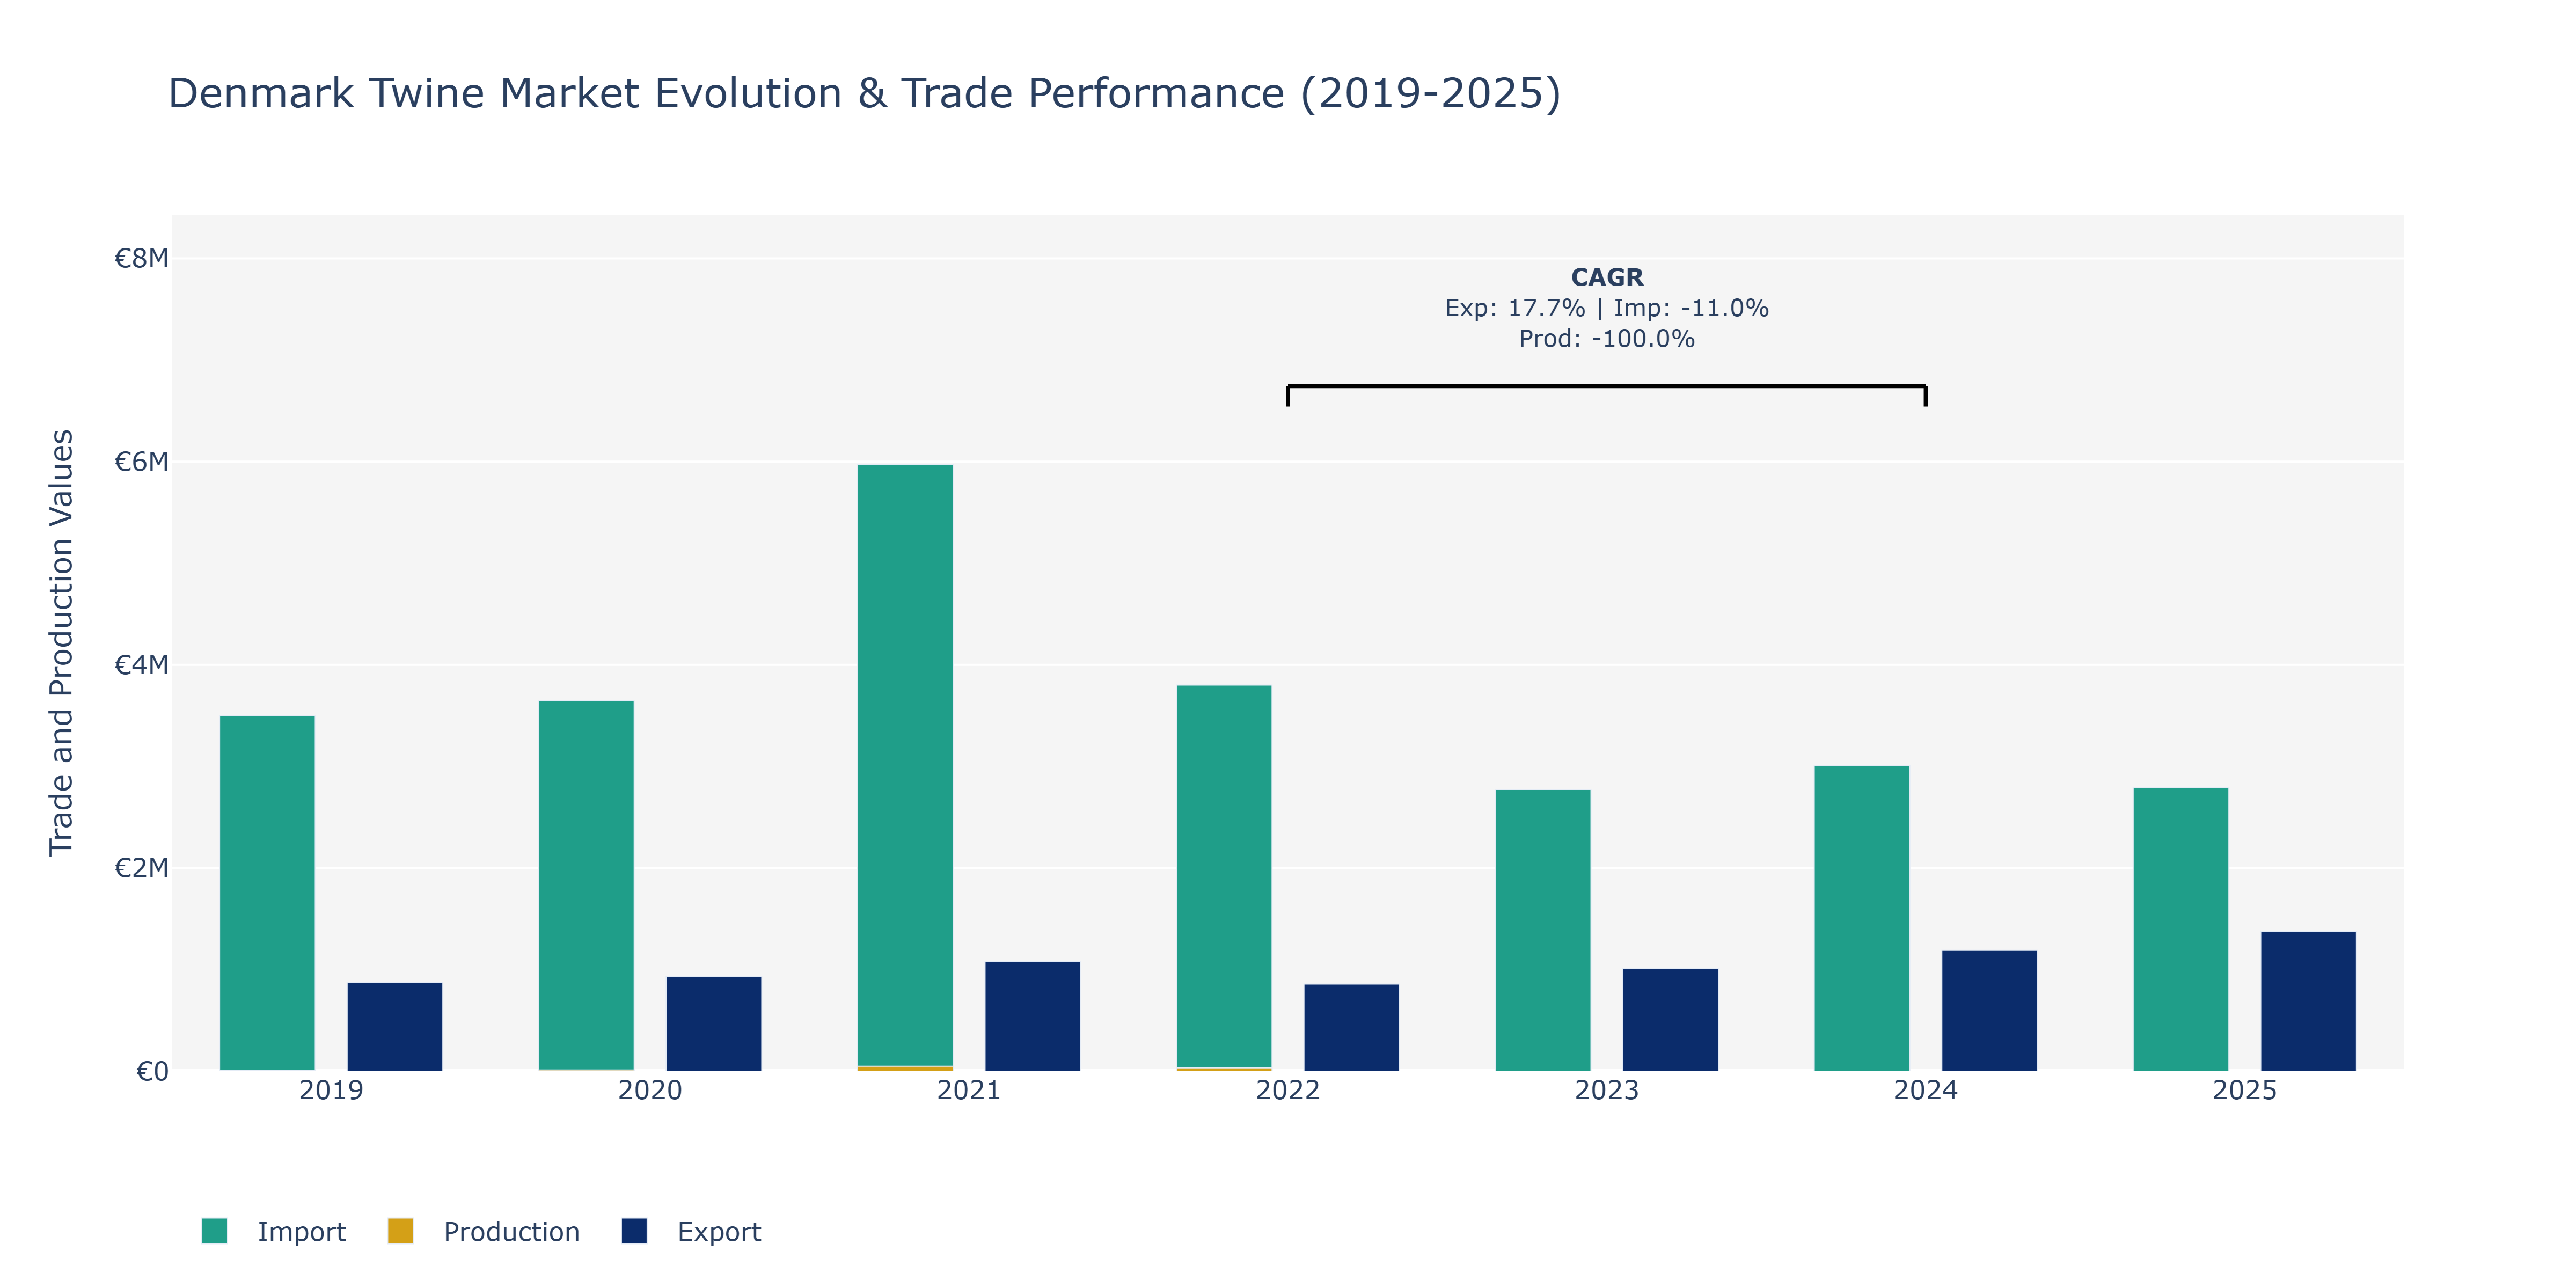
In the Denmark Twine Market, exports demonstrated fluctuating patterns over the years, with a peak in 2025 reaching approximately €1.37 million. Imports also displayed variations, with 2021 marking a notable increase to around €5.97 million, before declining in the subsequent years. Production, on the other hand, notably surged from €11.25 million in 2019 to €48.94 million in 2021, followed by a lack of data in the later years. The fluctuations in exports and imports could be attributed to global economic conditions, changing demand for twine products, and evolving trade policies. The substantial production growth until 2021 may have been influenced by technological advancements, increased automation in manufacturing processes, and efforts to enhance product quality. To sustain market competitiveness, stakeholders could focus on innovation, sustainable practices, and diversification of export destinations to navigate future uncertainties in trade landscapes.
Key Highlights of the Report:
- Denmark Twine Market Outlook
- Market Size of Denmark Twine Market, 2025
- Forecast of Denmark Twine Market, 2032
- Historical Data and Forecast of Denmark Twine Revenues & Volume for the Period 2022 - 2032F
- Denmark Twine Market Trend Evolution
- Denmark Twine Market Drivers and Challenges
- Denmark Twine Price Trends
- Denmark Twine Porter`s Five Forces
- Denmark Twine Industry Life Cycle
- Historical Data and Forecast of Denmark Twine Market Revenues & Volume By Type for the Period 2022 - 2032F
- Historical Data and Forecast of Denmark Twine Market Revenues & Volume By Polyethylene Rope Twine for the Period 2022 - 2032F
- Historical Data and Forecast of Denmark Twine Market Revenues & Volume By Metal Rope Twine for the Period 2022 - 2032F
- Historical Data and Forecast of Denmark Twine Market Revenues & Volume By Other for the Period 2022 - 2032F
- Historical Data and Forecast of Denmark Twine Market Revenues & Volume By Applications for the Period 2022 - 2032F
- Historical Data and Forecast of Denmark Twine Market Revenues & Volume By Industrial for the Period 2022 - 2032F
- Historical Data and Forecast of Denmark Twine Market Revenues & Volume By Construction for the Period 2022 - 2032F
- Historical Data and Forecast of Denmark Twine Market Revenues & Volume By Oil for the Period 2022 - 2032F
- Historical Data and Forecast of Denmark Twine Market Revenues & Volume By Coal mine for the Period 2022 - 2032F
- Historical Data and Forecast of Denmark Twine Market Revenues & Volume By Other for the Period 2022 - 2032F
- Denmark Twine Import Export Trade Statistics
- Market Opportunity Assessment By Type
- Market Opportunity Assessment By Applications
- Denmark Twine Top Companies Market Share
- Denmark Twine Competitive Benchmarking By Technical and Operational Parameters
- Denmark Twine Company Profiles
- Denmark Twine Key Strategic Recommendations
Frequently Asked Questions About the Market Study (FAQs):
6Wresearch actively monitors the Denmark Twine Market and publishes its comprehensive annual report, highlighting emerging trends, growth drivers, revenue analysis, and forecast outlook. Our insights help businesses to make data-backed strategic decisions with ongoing market dynamics. Our analysts track relevent industries related to the Denmark Twine Market, allowing our clients with actionable intelligence and reliable forecasts tailored to emerging regional needs.
Yes, we provide customisation as per your requirements. To learn more, feel free to contact us on sales@6wresearch.com
1 Executive Summary |
2 Introduction |
2.1 Key Highlights of the Report |
2.2 Report Description |
2.3 Market Scope & Segmentation |
2.4 Research Methodology |
2.5 Assumptions |
3 Denmark Twine Market Overview |
3.1 Denmark Country Macro Economic Indicators |
3.2 Denmark Twine Market Revenues & Volume, 2022 & 2032F |
3.3 Denmark Twine Market - Industry Life Cycle |
3.4 Denmark Twine Market - Porter's Five Forces |
3.5 Denmark Twine Market Revenues & Volume Share, By Type, 2022 & 2032F |
3.6 Denmark Twine Market Revenues & Volume Share, By Applications, 2022 & 2032F |
4 Denmark Twine Market Dynamics |
4.1 Impact Analysis |
4.2 Market Drivers |
4.2.1 Growing demand for sustainable and eco-friendly packaging solutions in various industries |
4.2.2 Increasing adoption of twine in agriculture for bundling crops and supporting vertical farming practices |
4.2.3 Rising awareness about the benefits of using biodegradable twine for reducing environmental impact |
4.3 Market Restraints |
4.3.1 Fluctuating raw material prices affecting the production cost of twine |
4.3.2 Competition from alternative materials like synthetic fibers impacting the market growth |
4.3.3 Stringent regulations related to the production and disposal of twine affecting the market dynamics |
5 Denmark Twine Market Trends |
6 Denmark Twine Market Segmentations |
6.1 Denmark Twine Market, By Type |
6.1.1 Overview and Analysis |
6.1.2 Denmark Twine Market Revenues & Volume, By Polyethylene Rope Twine, 2022 - 2032F |
6.1.3 Denmark Twine Market Revenues & Volume, By Metal Rope Twine, 2022 - 2032F |
6.1.4 Denmark Twine Market Revenues & Volume, By Other, 2022 - 2032F |
6.2 Denmark Twine Market, By Applications |
6.2.1 Overview and Analysis |
6.2.2 Denmark Twine Market Revenues & Volume, By Industrial, 2022 - 2032F |
6.2.3 Denmark Twine Market Revenues & Volume, By Construction, 2022 - 2032F |
6.2.4 Denmark Twine Market Revenues & Volume, By Oil, 2022 - 2032F |
6.2.5 Denmark Twine Market Revenues & Volume, By Coal mine, 2022 - 2032F |
6.2.6 Denmark Twine Market Revenues & Volume, By Other, 2022 - 2032F |
7 Denmark Twine Market Import-Export Trade Statistics |
7.1 Denmark Twine Market Export to Major Countries |
7.2 Denmark Twine Market Imports from Major Countries |
8 Denmark Twine Market Key Performance Indicators |
8.1 Percentage increase in the adoption of sustainable packaging solutions in Denmark |
8.2 Number of agricultural operations incorporating twine in their practices |
8.3 Environmental impact assessment of biodegradable twine compared to traditional twine materials |
9 Denmark Twine Market - Opportunity Assessment |
9.1 Denmark Twine Market Opportunity Assessment, By Type, 2022 & 2032F |
9.2 Denmark Twine Market Opportunity Assessment, By Applications, 2022 & 2032F |
10 Denmark Twine Market - Competitive Landscape |
10.1 Denmark Twine Market Revenue Share, By Companies, 2025 |
10.2 Denmark Twine Market Competitive Benchmarking, By Operating and Technical Parameters |
11 Company Profiles |
12 Recommendations | 13 Disclaimer |
Global Go To Market Strategy - 2030
Export potential enables firms to identify high-growth global markets with greater confidence by combining advanced trade intelligence with a structured quantitative methodology. The framework analyzes emerging demand trends and country-level import patterns while integrating macroeconomic and trade datasets such as GDP and population forecasts, bilateral import–export flows, tariff structures, elasticity differentials between developed and developing economies, geographic distance, and import demand projections. Using weighted trade values from 2020–2024 as the base period to project country-to-country export potential for 2030, these inputs are operationalized through calculated drivers such as gravity model parameters, tariff impact factors, and projected GDP per-capita growth. Through an analysis of hidden potentials, demand hotspots, and market conditions that are most favorable to success, this method enables firms to focus on target countries, maximize returns, and global expansion with data, backed by accuracy.
By factoring in the projected importer demand gap that is currently unmet and could be potential opportunity, it identifies the potential for the Exporter (Country) among 190 countries, against the general trade analysis, which identifies the biggest importer or exporter.
To discover high-growth global markets and optimize your business strategy:
Click Here
Pricing
- Single User License$ 1,995
- Department License$ 2,400
- Site License$ 3,120
- Global License$ 3,795

Leadership Perspectives from Industry Events
Search
Thought Leadership and Analyst Meet


Our Clients
6WResearch In News
- Doha a strategic location for EV manufacturing hub: IPA Qatar
- Demand for luxury TVs surging in the GCC, says Samsung
- Empowering Growth: The Thriving Journey of Bangladesh’s Cable Industry
- Demand for luxury TVs surging in the GCC, says Samsung
- Video call with a traditional healer? Once unthinkable, it’s now common in South Africa
- Intelligent Buildings To Smooth GCC’s Path To Net Zero
Latest Reports
- Taiwan Airport Wireless Infrastructure Market (2026-2032)
- Vietnam Airport Wireless Infrastructure Market (2026-2032)
- Thailand Airport Wireless Infrastructure Market (2026-2032)
- South Korea Airport Wireless Infrastructure Market (2026-2032)
- Romania Airport Wireless Infrastructure Market (2026-2032)
- Qatar Airport Wireless Infrastructure Market (2026-2032)
- Philippines Airport Wireless Infrastructure Market (2026-2032)
- Japan Airport Wireless Infrastructure Market (2026-2032)
- Taiwan Airport Winter Services Market (2026-2032)
- Vietnam Airport Winter Services Market (2026-2032)
Industry Events and Analyst Meet

HIMTEX 2026

India Refining Summit 2026

India EV Show 2026

EV tech India Expo 2026

Auto Tech Asia 2026
Whitepaper
- Middle East & Africa Commercial Security Market Click here to view more.
- Middle East & Africa Fire Safety Systems & Equipment Market Click here to view more.
- GCC Drone Market Click here to view more.
- Middle East Lighting Fixture Market Click here to view more.
- GCC Physical & Perimeter Security Market Click here to view more.