Ecuador Ceramic Coating Market (2026-2032) | Drivers, Supply, Competition, Growth, Trends, Industry, Competitive, Share, Investment Trends, Segments, Outlook, Consumer Insights, Challenges, Companies, Strategy, Strategic Insights, Opportunities, Analysis, Value, Forecast, Demand, Restraints, Pricing Analysis, Size, Revenue, Segmentation
Market Forecast By Product Type (Thermal Barrier Coatings, Anti-Corrosion Coatings, Wear-Resistant Coatings, Hydrophobic Coatings), By Technology Type (Plasma Spraying, Chemical Vapor Deposition, Sol-Gel Technology, Nanotechnology), By End User (Aerospace & Defense, Automotive Industry, Medical Device Companies, Consumer Electronics), By Application (Turbine Blade Protection, Car Paint Protection, Implant Durability, Scratch and Water Resistance in Displays) And Competitive Landscape
| Product Code: ETC11558939 | Publication Date: Apr 2025 | Updated Date: Apr 2026 | Product Type: Market Research Report | |
| Publisher: 6Wresearch | Author: Bhawna Singh | No. of Pages: 65 | No. of Figures: 34 | No. of Tables: 19 |
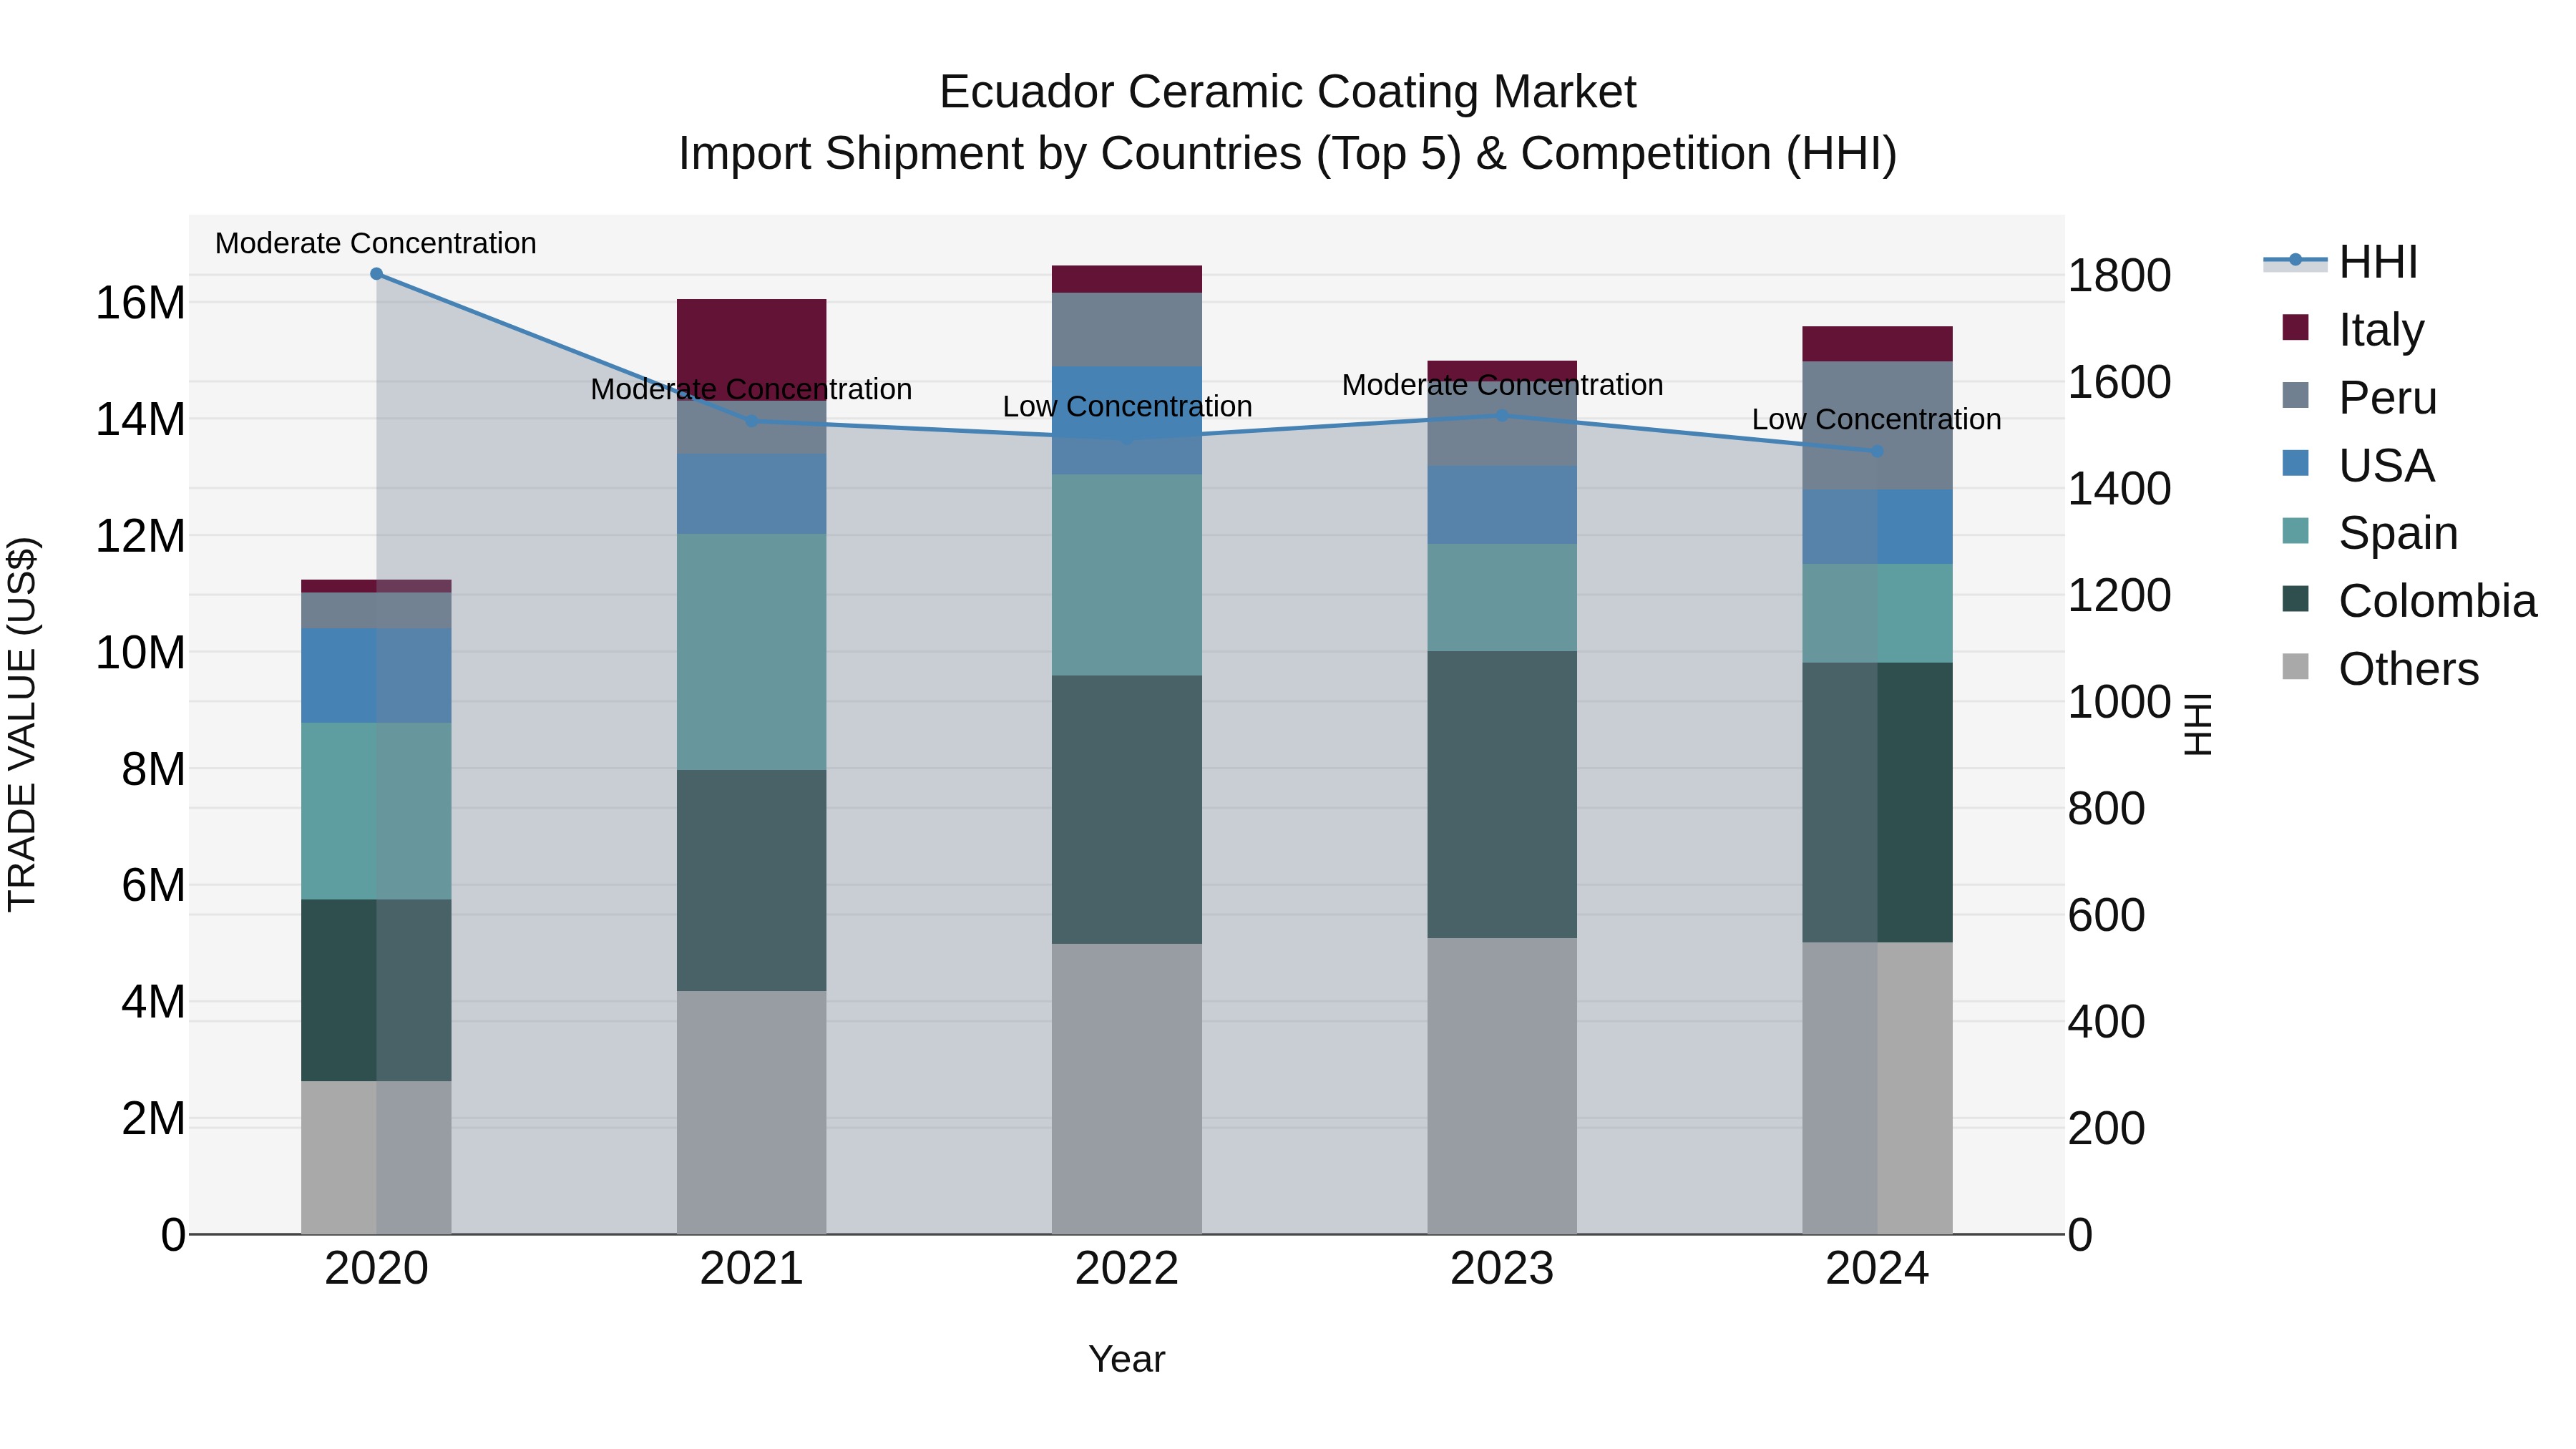
Ecuador Ceramic Coating Market Top 5 Importing Countries and Market Competition (HHI) Analysis
Ecuador`s ceramic coating import Market Top 5 Importing Countries and Market Competition (HHI) Analysis witnessed a notable shift in concentration levels from moderate to low in 2024. With a commendable compound annual growth rate of 8.52% from 2020 to 2024, the industry continues to attract imports from key players such as Colombia, Peru, Spain, USA, and Poland. The growth rate of 4.0% in 2024 further indicates a steady expansion in the Market Top 5 Importing Countries and Market Competition (HHI) Analysis. This data suggests a positive outlook for the ceramic coating import sector in Ecuador, with diverse sources contributing to its development.
Key Highlights of the Report:
- Ecuador Ceramic Coating Market Outlook
- Market Size of Ecuador Ceramic Coating Market, 2025
- Forecast of Ecuador Ceramic Coating Market, 2032
- Historical Data and Forecast of Ecuador Ceramic Coating Revenues & Volume for the Period 2022 - 2032F
- Ecuador Ceramic Coating Market Trend Evolution
- Ecuador Ceramic Coating Market Drivers and Challenges
- Ecuador Ceramic Coating Price Trends
- Ecuador Ceramic Coating Porter's Five Forces
- Ecuador Ceramic Coating Industry Life Cycle
- Historical Data and Forecast of Ecuador Ceramic Coating Market Revenues & Volume By Product Type for the Period 2022 - 2032F
- Historical Data and Forecast of Ecuador Ceramic Coating Market Revenues & Volume By Thermal Barrier Coatings for the Period 2022 - 2032F
- Historical Data and Forecast of Ecuador Ceramic Coating Market Revenues & Volume By Anti-Corrosion Coatings for the Period 2022 - 2032F
- Historical Data and Forecast of Ecuador Ceramic Coating Market Revenues & Volume By Wear-Resistant Coatings for the Period 2022 - 2032F
- Historical Data and Forecast of Ecuador Ceramic Coating Market Revenues & Volume By Hydrophobic Coatings for the Period 2022 - 2032F
- Historical Data and Forecast of Ecuador Ceramic Coating Market Revenues & Volume By Technology Type for the Period 2022 - 2032F
- Historical Data and Forecast of Ecuador Ceramic Coating Market Revenues & Volume By Plasma Spraying for the Period 2022 - 2032F
- Historical Data and Forecast of Ecuador Ceramic Coating Market Revenues & Volume By Chemical Vapor Deposition for the Period 2022 - 2032F
- Historical Data and Forecast of Ecuador Ceramic Coating Market Revenues & Volume By Sol-Gel Technology for the Period 2022 - 2032F
- Historical Data and Forecast of Ecuador Ceramic Coating Market Revenues & Volume By Nanotechnology for the Period 2022 - 2032F
- Historical Data and Forecast of Ecuador Ceramic Coating Market Revenues & Volume By End User for the Period 2022 - 2032F
- Historical Data and Forecast of Ecuador Ceramic Coating Market Revenues & Volume By Aerospace & Defense for the Period 2022 - 2032F
- Historical Data and Forecast of Ecuador Ceramic Coating Market Revenues & Volume By Automotive Industry for the Period 2022 - 2032F
- Historical Data and Forecast of Ecuador Ceramic Coating Market Revenues & Volume By Medical Device Companies for the Period 2022 - 2032F
- Historical Data and Forecast of Ecuador Ceramic Coating Market Revenues & Volume By Consumer Electronics for the Period 2022 - 2032F
- Historical Data and Forecast of Ecuador Ceramic Coating Market Revenues & Volume By Application for the Period 2022 - 2032F
- Historical Data and Forecast of Ecuador Ceramic Coating Market Revenues & Volume By Turbine Blade Protection for the Period 2022 - 2032F
- Historical Data and Forecast of Ecuador Ceramic Coating Market Revenues & Volume By Car Paint Protection for the Period 2022 - 2032F
- Historical Data and Forecast of Ecuador Ceramic Coating Market Revenues & Volume By Implant Durability for the Period 2022 - 2032F
- Historical Data and Forecast of Ecuador Ceramic Coating Market Revenues & Volume By Scratch and Water Resistance in Displays for the Period 2022 - 2032F
- Ecuador Ceramic Coating Import Export Trade Statistics
- Market Opportunity Assessment By Product Type
- Market Opportunity Assessment By Technology Type
- Market Opportunity Assessment By End User
- Market Opportunity Assessment By Application
- Ecuador Ceramic Coating Top Companies Market Share
- Ecuador Ceramic Coating Competitive Benchmarking By Technical and Operational Parameters
- Ecuador Ceramic Coating Company Profiles
- Ecuador Ceramic Coating Key Strategic Recommendations
Frequently Asked Questions About the Market Study (FAQs):
6Wresearch actively monitors the Ecuador Ceramic Coating Market and publishes its comprehensive annual report, highlighting emerging trends, growth drivers, revenue analysis, and forecast outlook. Our insights help businesses to make data-backed strategic decisions with ongoing market dynamics. Our analysts track relevent industries related to the Ecuador Ceramic Coating Market, allowing our clients with actionable intelligence and reliable forecasts tailored to emerging regional needs.
Yes, we provide customisation as per your requirements. To learn more, feel free to contact us on sales@6wresearch.com
1 Executive Summary |
2 Introduction |
2.1 Key Highlights of the Report |
2.2 Report Description |
2.3 Market Scope & Segmentation |
2.4 Research Methodology |
2.5 Assumptions |
3 Ecuador Ceramic Coating Market Overview |
3.1 Ecuador Country Macro Economic Indicators |
3.2 Ecuador Ceramic Coating Market Revenues & Volume, 2022 & 2032F |
3.3 Ecuador Ceramic Coating Market - Industry Life Cycle |
3.4 Ecuador Ceramic Coating Market - Porter's Five Forces |
3.5 Ecuador Ceramic Coating Market Revenues & Volume Share, By Product Type, 2022 & 2032F |
3.6 Ecuador Ceramic Coating Market Revenues & Volume Share, By Technology Type, 2022 & 2032F |
3.7 Ecuador Ceramic Coating Market Revenues & Volume Share, By End User, 2022 & 2032F |
3.8 Ecuador Ceramic Coating Market Revenues & Volume Share, By Application, 2022 & 2032F |
4 Ecuador Ceramic Coating Market Dynamics |
4.1 Impact Analysis |
4.2 Market Drivers |
4.2.1 Growing demand for durable and easy-to-maintain coatings in residential and commercial construction projects |
4.2.2 Increasing awareness about the benefits of ceramic coatings in terms of protection and aesthetics |
4.2.3 Rising investments in infrastructure development and renovation projects in Ecuador |
4.3 Market Restraints |
4.3.1 Fluctuating raw material prices impacting production costs |
4.3.2 Lack of skilled labor for proper application of ceramic coatings |
4.3.3 Competition from alternative coating technologies such as polymer coatings |
5 Ecuador Ceramic Coating Market Trends |
6 Ecuador Ceramic Coating Market, By Types |
6.1 Ecuador Ceramic Coating Market, By Product Type |
6.1.1 Overview and Analysis |
6.1.2 Ecuador Ceramic Coating Market Revenues & Volume, By Product Type, 2022 - 2032F |
6.1.3 Ecuador Ceramic Coating Market Revenues & Volume, By Thermal Barrier Coatings, 2022 - 2032F |
6.1.4 Ecuador Ceramic Coating Market Revenues & Volume, By Anti-Corrosion Coatings, 2022 - 2032F |
6.1.5 Ecuador Ceramic Coating Market Revenues & Volume, By Wear-Resistant Coatings, 2022 - 2032F |
6.1.6 Ecuador Ceramic Coating Market Revenues & Volume, By Hydrophobic Coatings, 2022 - 2032F |
6.2 Ecuador Ceramic Coating Market, By Technology Type |
6.2.1 Overview and Analysis |
6.2.2 Ecuador Ceramic Coating Market Revenues & Volume, By Plasma Spraying, 2022 - 2032F |
6.2.3 Ecuador Ceramic Coating Market Revenues & Volume, By Chemical Vapor Deposition, 2022 - 2032F |
6.2.4 Ecuador Ceramic Coating Market Revenues & Volume, By Sol-Gel Technology, 2022 - 2032F |
6.2.5 Ecuador Ceramic Coating Market Revenues & Volume, By Nanotechnology, 2022 - 2032F |
6.3 Ecuador Ceramic Coating Market, By End User |
6.3.1 Overview and Analysis |
6.3.2 Ecuador Ceramic Coating Market Revenues & Volume, By Aerospace & Defense, 2022 - 2032F |
6.3.3 Ecuador Ceramic Coating Market Revenues & Volume, By Automotive Industry, 2022 - 2032F |
6.3.4 Ecuador Ceramic Coating Market Revenues & Volume, By Medical Device Companies, 2022 - 2032F |
6.3.5 Ecuador Ceramic Coating Market Revenues & Volume, By Consumer Electronics, 2022 - 2032F |
6.4 Ecuador Ceramic Coating Market, By Application |
6.4.1 Overview and Analysis |
6.4.2 Ecuador Ceramic Coating Market Revenues & Volume, By Turbine Blade Protection, 2022 - 2032F |
6.4.3 Ecuador Ceramic Coating Market Revenues & Volume, By Car Paint Protection, 2022 - 2032F |
6.4.4 Ecuador Ceramic Coating Market Revenues & Volume, By Implant Durability, 2022 - 2032F |
6.4.5 Ecuador Ceramic Coating Market Revenues & Volume, By Scratch and Water Resistance in Displays, 2022 - 2032F |
7 Ecuador Ceramic Coating Market Import-Export Trade Statistics |
7.1 Ecuador Ceramic Coating Market Export to Major Countries |
7.2 Ecuador Ceramic Coating Market Imports from Major Countries |
8 Ecuador Ceramic Coating Market Key Performance Indicators |
8.1 Number of new construction projects incorporating ceramic coatings |
8.2 Percentage increase in the adoption of ceramic coatings in the automotive sector |
8.3 Average time taken for ceramic coating application and curing process |
8.4 Number of partnerships and collaborations between ceramic coating manufacturers and construction companies |
8.5 Average customer satisfaction ratings for ceramic coating durability and performance |
9 Ecuador Ceramic Coating Market - Opportunity Assessment |
9.1 Ecuador Ceramic Coating Market Opportunity Assessment, By Product Type, 2022 & 2032F |
9.2 Ecuador Ceramic Coating Market Opportunity Assessment, By Technology Type, 2022 & 2032F |
9.3 Ecuador Ceramic Coating Market Opportunity Assessment, By End User, 2022 & 2032F |
9.4 Ecuador Ceramic Coating Market Opportunity Assessment, By Application, 2022 & 2032F |
10 Ecuador Ceramic Coating Market - Competitive Landscape |
10.1 Ecuador Ceramic Coating Market Revenue Share, By Companies, 2025 |
10.2 Ecuador Ceramic Coating Market Competitive Benchmarking, By Operating and Technical Parameters |
11 Company Profiles |
12 Recommendations |
13 Disclaimer |
Export potential assessment - trade Analytics for 2030
Export potential enables firms to identify high-growth global markets with greater confidence by combining advanced trade intelligence with a structured quantitative methodology. The framework analyzes emerging demand trends and country-level import patterns while integrating macroeconomic and trade datasets such as GDP and population forecasts, bilateral import–export flows, tariff structures, elasticity differentials between developed and developing economies, geographic distance, and import demand projections. Using weighted trade values from 2020–2024 as the base period to project country-to-country export potential for 2030, these inputs are operationalized through calculated drivers such as gravity model parameters, tariff impact factors, and projected GDP per-capita growth. Through an analysis of hidden potentials, demand hotspots, and market conditions that are most favorable to success, this method enables firms to focus on target countries, maximize returns, and global expansion with data, backed by accuracy.
By factoring in the projected importer demand gap that is currently unmet and could be potential opportunity, it identifies the potential for the Exporter (Country) among 190 countries, against the general trade analysis, which identifies the biggest importer or exporter.
To discover high-growth global markets and optimize your business strategy:
Click Here
Pricing
- Single User License$ 1,995
- Department License$ 2,400
- Site License$ 3,120
- Global License$ 3,795

Search
Thought Leadership and Analyst Meet


Our Clients
Latest Reports
- Ivory Coast Pet Perfume market Market (2026-2032) | Challenges, Growth, Revenue, Strategy, Investment Opportunities, Share, Analysis, Restraints, Insights, Trends, Drivers, Forecast, Demand, Pricing, Value, Size, segmentation, Companies, Outlook, Competition
- Ivory Coast Biopolymer Packaging Market (2026-2032) | Size, Competition, Demand, Analysis, Trends, Drivers, Challenges, Companies, Value, Forecast, Investment Opportunities, Insights, Growth, Share, Restraints, Revenue, Strategy, Outlook, Pricing, segmentation
- Ivory Coast Electric Heavy Commercial Vehicle Traction Motor market Market (2026-2032) | Demand, Pricing, Value, Restraints, Size, Trends, Drivers, Analysis, Outlook, Strategy, Insights, Forecast, Companies, Challenges, Share, segmentation, Growth, Competition, Investment Opportunities, Revenue
- Ivory Coast Metallic Braces market Market (2026-2032) | Companies, Revenue, Trends, Value, Insights, Strategy, Restraints, Size, Demand, Pricing, Share, Challenges, Analysis, Forecast, Drivers, Investment Opportunities, Competition, segmentation, Growth, Outlook
- Ivory Coast barcode scanners printers market Market (2026-2032) | Pricing, Restraints, Analysis, Competition, Size, Value, Trends, Forecast, Companies, Drivers, Demand, Insights, Strategy, Share, Investment Opportunities, Challenges, segmentation, Growth, Outlook, Revenue
- Ivory Coast AI Energy Distribution Market (2026-2032) | Companies, Drivers, Demand, Challenges, Size, Insights, Value, Restraints, Strategy, Investment Opportunities, Revenue, Outlook, Growth, Forecast, Share, Competition, Pricing, segmentation, Analysis, Trends
- Ivory Coast Recycled Polyester Market (2026-2032) | Trends, Insights, Growth, Challenges, Forecast, Value, Outlook, Strategy, Pricing, Revenue, segmentation, Demand, Companies, Investment Opportunities, Restraints, Share, Size, Analysis, Competition, Drivers
- Ivory Coast Mission Critical Wireless Communications Market (2026-2032) | segmentation, Companies, Revenue, Drivers, Strategy, Demand, Growth, Insights, Trends, Competition, Forecast, Share, Size, Outlook, Restraints, Challenges, Analysis, Pricing, Value, Investment Opportunities
- Ivory Coast AI Pathology Market (2026-2032) | Investment Opportunities, Competition, Revenue, Growth, Value, Insights, Share, segmentation, Trends, Companies, Outlook, Drivers, Demand, Challenges, Analysis, Pricing, Size, Forecast, Restraints, Strategy
- Ivory Coast Electric Appliance Rental Market (2026-2032) | Outlook, Value, Drivers, Restraints, Trends, Share, Competition, Pricing, Forecast, Growth, Revenue, Strategy, Insights, Companies, Size, Investment Opportunities, Challenges, Demand, segmentation, Analysis
Industry Events and Analyst Meet

HIMTEX 2026

India Refining Summit 2026

India EV Show 2026

EV tech India Expo 2026

Auto Tech Asia 2026
Whitepaper
- Middle East & Africa Commercial Security Market Click here to view more.
- Middle East & Africa Fire Safety Systems & Equipment Market Click here to view more.
- GCC Drone Market Click here to view more.
- Middle East Lighting Fixture Market Click here to view more.
- GCC Physical & Perimeter Security Market Click here to view more.
6WResearch In News
- Doha a strategic location for EV manufacturing hub: IPA Qatar
- Demand for luxury TVs surging in the GCC, says Samsung
- Empowering Growth: The Thriving Journey of Bangladesh’s Cable Industry
- Demand for luxury TVs surging in the GCC, says Samsung
- Video call with a traditional healer? Once unthinkable, it’s now common in South Africa
- Intelligent Buildings To Smooth GCC’s Path To Net Zero