Ecuador Water Market (2026-2032) | Segmentation, Revenue, Segments, Competition, Value, Forecast, Outlook, Strategic Insights, Restraints, Drivers, Challenges, Consumer Insights, Opportunities, Trends, Companies, Industry, Demand, Strategy, Pricing Analysis, Analysis, Competitive, Size, Share, Growth, Supply, Investment Trends
Market Forecast By Type (Bottled Water, Packaged Water, Purified Water, Mineral Water, Distilled Water), By Source Type (Natural Springs, Municipal Supply, Reverse Osmosis, Underground Wells, Steam Distillation), By End User (Consumers, Restaurants, Hospitals, Fitness Centers, Laboratories), By Application (Drinking Water, Food Preparation, Medical Use, Hydration, Scientific Research), By End Use (Professional Tattooing, Tattoo Studios) And Competitive Landscape
| Product Code: ETC11302235 | Publication Date: Apr 2025 | Updated Date: Apr 2026 | Product Type: Market Research Report | |
| Publisher: 6Wresearch | Author: Bhawna Singh | No. of Pages: 65 | No. of Figures: 34 | No. of Tables: 19 |
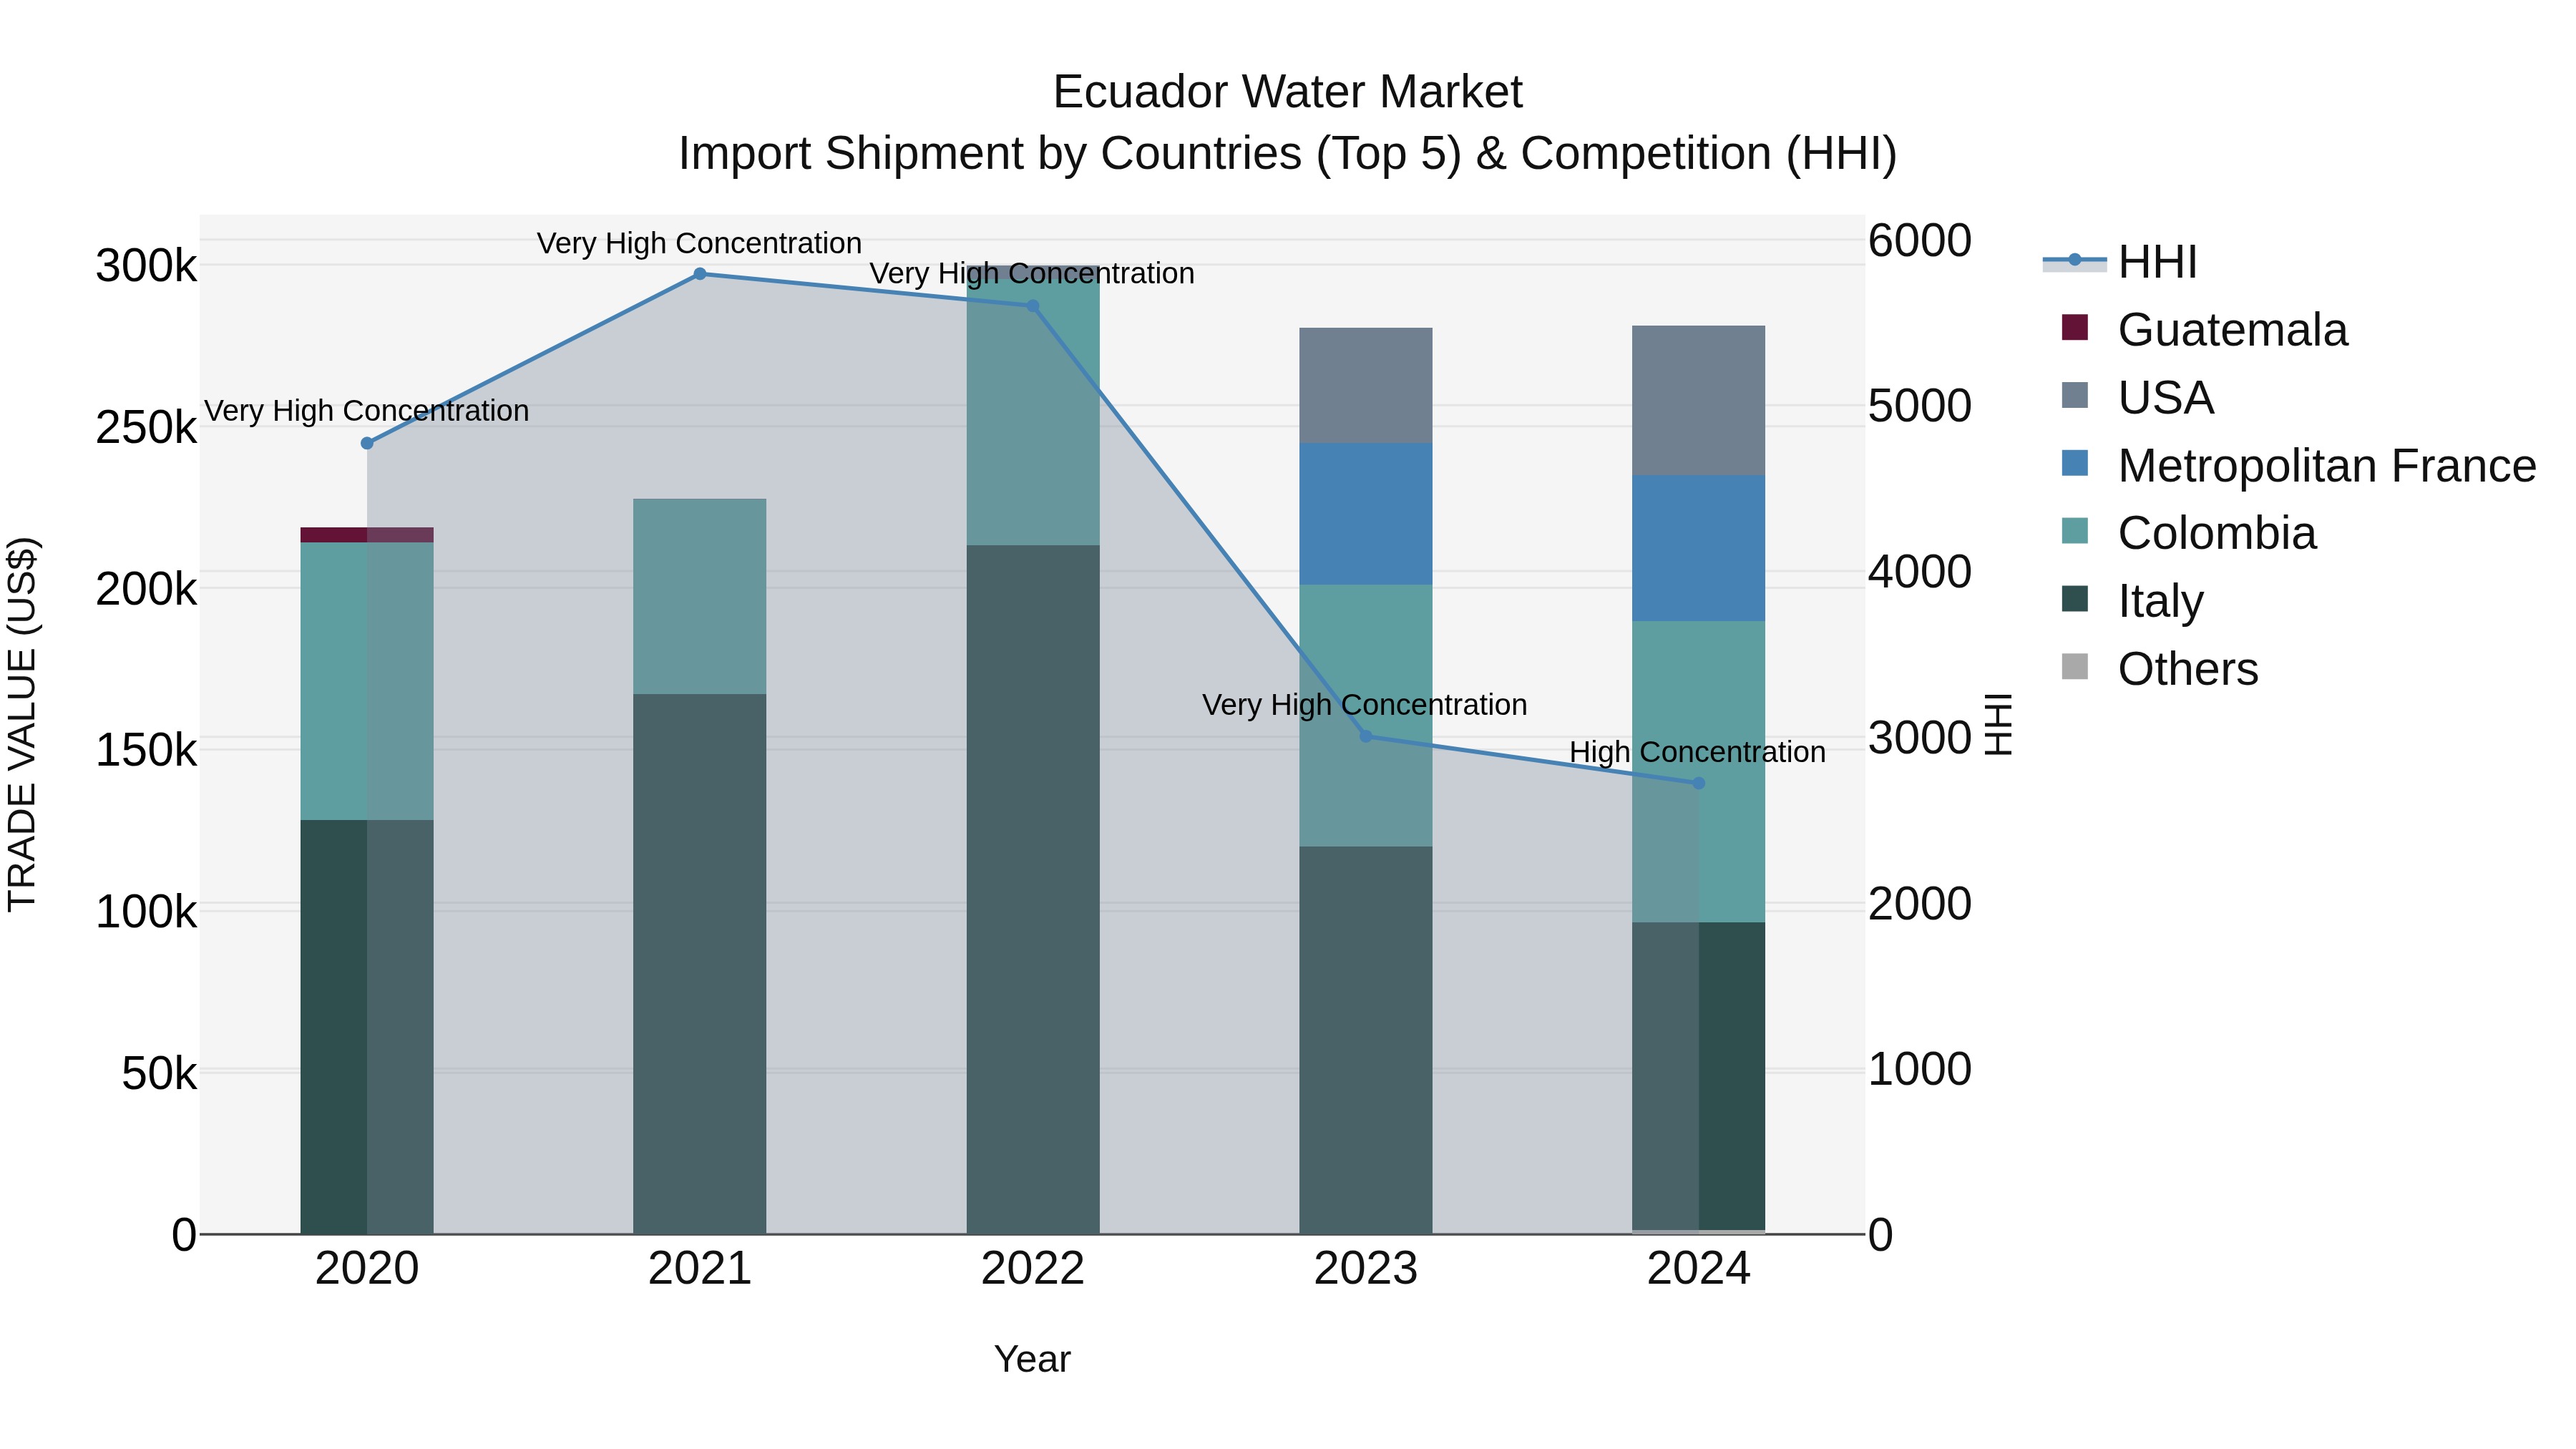
Ecuador Water Market Top 5 Importing Countries and Market Competition (HHI) Analysis
Ecuador`s water import Market Top 5 Importing Countries and Market Competition (HHI) Analysis continues to show steady growth, with a moderate CAGR of 6.49% from 2020 to 2024. The top exporting countries in 2024, including Italy, Colombia, and the USA, indicate a diverse range of sources for Ecuador`s water imports. Despite a slight decrease in the growth rate from 2023 to 2024, the Market Top 5 Importing Countries and Market Competition (HHI) Analysis remains highly concentrated, with the HHI indicating a high level of Market Top 5 Importing Countries and Market Competition (HHI) Analysis dominance by key suppliers. This concentration suggests potential challenges for Market Top 5 Importing Countries and Market Competition (HHI) Analysis competitiveness and highlights the importance of monitoring import dynamics in the water sector.
Key Highlights of the Report:
- Ecuador Water Market Outlook
- Market Size of Ecuador Water Market, 2025
- Forecast of Ecuador Water Market, 2032
- Historical Data and Forecast of Ecuador Water Revenues & Volume for the Period 2022 - 2032F
- Ecuador Water Market Trend Evolution
- Ecuador Water Market Drivers and Challenges
- Ecuador Water Price Trends
- Ecuador Water Porter's Five Forces
- Ecuador Water Industry Life Cycle
- Historical Data and Forecast of Ecuador Water Market Revenues & Volume By Type for the Period 2022 - 2032F
- Historical Data and Forecast of Ecuador Water Market Revenues & Volume By Bottled Water for the Period 2022 - 2032F
- Historical Data and Forecast of Ecuador Water Market Revenues & Volume By Packaged Water for the Period 2022 - 2032F
- Historical Data and Forecast of Ecuador Water Market Revenues & Volume By Purified Water for the Period 2022 - 2032F
- Historical Data and Forecast of Ecuador Water Market Revenues & Volume By Mineral Water for the Period 2022 - 2032F
- Historical Data and Forecast of Ecuador Water Market Revenues & Volume By Distilled Water for the Period 2022 - 2032F
- Historical Data and Forecast of Ecuador Water Market Revenues & Volume By Source Type for the Period 2022 - 2032F
- Historical Data and Forecast of Ecuador Water Market Revenues & Volume By Natural Springs for the Period 2022 - 2032F
- Historical Data and Forecast of Ecuador Water Market Revenues & Volume By Municipal Supply for the Period 2022 - 2032F
- Historical Data and Forecast of Ecuador Water Market Revenues & Volume By Reverse Osmosis for the Period 2022 - 2032F
- Historical Data and Forecast of Ecuador Water Market Revenues & Volume By Underground Wells for the Period 2022 - 2032F
- Historical Data and Forecast of Ecuador Water Market Revenues & Volume By Steam Distillation for the Period 2022 - 2032F
- Historical Data and Forecast of Ecuador Water Market Revenues & Volume By End User for the Period 2022 - 2032F
- Historical Data and Forecast of Ecuador Water Market Revenues & Volume By Consumers for the Period 2022 - 2032F
- Historical Data and Forecast of Ecuador Water Market Revenues & Volume By Restaurants for the Period 2022 - 2032F
- Historical Data and Forecast of Ecuador Water Market Revenues & Volume By Hospitals for the Period 2022 - 2032F
- Historical Data and Forecast of Ecuador Water Market Revenues & Volume By Fitness Centers for the Period 2022 - 2032F
- Historical Data and Forecast of Ecuador Water Market Revenues & Volume By Laboratories for the Period 2022 - 2032F
- Historical Data and Forecast of Ecuador Water Market Revenues & Volume By Application for the Period 2022 - 2032F
- Historical Data and Forecast of Ecuador Water Market Revenues & Volume By Drinking Water for the Period 2022 - 2032F
- Historical Data and Forecast of Ecuador Water Market Revenues & Volume By Food Preparation for the Period 2022 - 2032F
- Historical Data and Forecast of Ecuador Water Market Revenues & Volume By Medical Use for the Period 2022 - 2032F
- Historical Data and Forecast of Ecuador Water Market Revenues & Volume By Hydration for the Period 2022 - 2032F
- Historical Data and Forecast of Ecuador Water Market Revenues & Volume By Scientific Research for the Period 2022 - 2032F
- Historical Data and Forecast of Ecuador Water Market Revenues & Volume By End Use for the Period 2022 - 2032F
- Historical Data and Forecast of Ecuador Water Market Revenues & Volume By Professional Tattooing for the Period 2022 - 2032F
- Historical Data and Forecast of Ecuador Water Market Revenues & Volume By Tattoo Studios for the Period 2022 - 2032F
- Ecuador Water Import Export Trade Statistics
- Market Opportunity Assessment By Type
- Market Opportunity Assessment By Source Type
- Market Opportunity Assessment By End User
- Market Opportunity Assessment By Application
- Market Opportunity Assessment By End Use
- Ecuador Water Top Companies Market Share
- Ecuador Water Competitive Benchmarking By Technical and Operational Parameters
- Ecuador Water Company Profiles
- Ecuador Water Key Strategic Recommendations
Frequently Asked Questions About the Market Study (FAQs):
6Wresearch actively monitors the Ecuador Water Market and publishes its comprehensive annual report, highlighting emerging trends, growth drivers, revenue analysis, and forecast outlook. Our insights help businesses to make data-backed strategic decisions with ongoing market dynamics. Our analysts track relevent industries related to the Ecuador Water Market, allowing our clients with actionable intelligence and reliable forecasts tailored to emerging regional needs.
Yes, we provide customisation as per your requirements. To learn more, feel free to contact us on sales@6wresearch.com
1 Executive Summary |
2 Introduction |
2.1 Key Highlights of the Report |
2.2 Report Description |
2.3 Market Scope & Segmentation |
2.4 Research Methodology |
2.5 Assumptions |
3 Ecuador Water Market Overview |
3.1 Ecuador Country Macro Economic Indicators |
3.2 Ecuador Water Market Revenues & Volume, 2022 & 2032F |
3.3 Ecuador Water Market - Industry Life Cycle |
3.4 Ecuador Water Market - Porter's Five Forces |
3.5 Ecuador Water Market Revenues & Volume Share, By Type, 2022 & 2032F |
3.6 Ecuador Water Market Revenues & Volume Share, By Source Type, 2022 & 2032F |
3.7 Ecuador Water Market Revenues & Volume Share, By End User, 2022 & 2032F |
3.8 Ecuador Water Market Revenues & Volume Share, By Application, 2022 & 2032F |
4 Ecuador Water Market Dynamics |
4.1 Impact Analysis |
4.2 Market Drivers |
4.2.1 Increasing urbanization and industrialization in Ecuador, leading to higher demand for water across various sectors. |
4.2.2 Growing awareness about the importance of clean and safe drinking water, driving investments in water infrastructure and technologies. |
4.2.3 Government initiatives and regulations focusing on water conservation and sustainable management practices. |
4.3 Market Restraints |
4.3.1 Limited access to clean water sources in certain regions of Ecuador, leading to supply challenges. |
4.3.2 Lack of proper infrastructure and funding for water treatment and distribution systems. |
4.3.3 Vulnerability to natural disasters such as floods and droughts impacting water availability and quality. |
5 Ecuador Water Market Trends |
6 Ecuador Water Market, By Types |
6.1 Ecuador Water Market, By Type |
6.1.1 Overview and Analysis |
6.1.2 Ecuador Water Market Revenues & Volume, By Type, 2022 - 2032F |
6.1.3 Ecuador Water Market Revenues & Volume, By Bottled Water, 2022 - 2032F |
6.1.4 Ecuador Water Market Revenues & Volume, By Packaged Water, 2022 - 2032F |
6.1.5 Ecuador Water Market Revenues & Volume, By Purified Water, 2022 - 2032F |
6.1.6 Ecuador Water Market Revenues & Volume, By Mineral Water, 2022 - 2032F |
6.1.7 Ecuador Water Market Revenues & Volume, By Distilled Water, 2022 - 2032F |
6.2 Ecuador Water Market, By Source Type |
6.2.1 Overview and Analysis |
6.2.2 Ecuador Water Market Revenues & Volume, By Natural Springs, 2022 - 2032F |
6.2.3 Ecuador Water Market Revenues & Volume, By Municipal Supply, 2022 - 2032F |
6.2.4 Ecuador Water Market Revenues & Volume, By Reverse Osmosis, 2022 - 2032F |
6.2.5 Ecuador Water Market Revenues & Volume, By Underground Wells, 2022 - 2032F |
6.2.6 Ecuador Water Market Revenues & Volume, By Steam Distillation, 2022 - 2032F |
6.3 Ecuador Water Market, By End User |
6.3.1 Overview and Analysis |
6.3.2 Ecuador Water Market Revenues & Volume, By Consumers, 2022 - 2032F |
6.3.3 Ecuador Water Market Revenues & Volume, By Restaurants, 2022 - 2032F |
6.3.4 Ecuador Water Market Revenues & Volume, By Hospitals, 2022 - 2032F |
6.3.5 Ecuador Water Market Revenues & Volume, By Fitness Centers, 2022 - 2032F |
6.3.6 Ecuador Water Market Revenues & Volume, By Laboratories, 2022 - 2032F |
6.4 Ecuador Water Market, By Application |
6.4.1 Overview and Analysis |
6.4.2 Ecuador Water Market Revenues & Volume, By Drinking Water, 2022 - 2032F |
6.4.3 Ecuador Water Market Revenues & Volume, By Food Preparation, 2022 - 2032F |
6.4.4 Ecuador Water Market Revenues & Volume, By Medical Use, 2022 - 2032F |
6.4.5 Ecuador Water Market Revenues & Volume, By Hydration, 2022 - 2032F |
6.4.6 Ecuador Water Market Revenues & Volume, By Scientific Research, 2022 - 2032F |
7 Ecuador Water Market Import-Export Trade Statistics |
7.1 Ecuador Water Market Export to Major Countries |
7.2 Ecuador Water Market Imports from Major Countries |
8 Ecuador Water Market Key Performance Indicators |
8.1 Percentage of population with access to improved water sources. |
8.2 Investment in water infrastructure development projects. |
8.3 Water quality index reflecting the level of contaminants in drinking water. |
8.4 Water efficiency ratio measuring the effectiveness of water use in industries and households. |
8.5 Compliance rate with water conservation regulations and sustainability standards. |
9 Ecuador Water Market - Opportunity Assessment |
9.1 Ecuador Water Market Opportunity Assessment, By Type, 2022 & 2032F |
9.2 Ecuador Water Market Opportunity Assessment, By Source Type, 2022 & 2032F |
9.3 Ecuador Water Market Opportunity Assessment, By End User, 2022 & 2032F |
9.4 Ecuador Water Market Opportunity Assessment, By Application, 2022 & 2032F |
10 Ecuador Water Market - Competitive Landscape |
10.1 Ecuador Water Market Revenue Share, By Companies, 2025 |
10.2 Ecuador Water Market Competitive Benchmarking, By Operating and Technical Parameters |
11 Company Profiles |
12 Recommendations |
13 Disclaimer |
Global Go To Market Strategy - 2030
Export potential enables firms to identify high-growth global markets with greater confidence by combining advanced trade intelligence with a structured quantitative methodology. The framework analyzes emerging demand trends and country-level import patterns while integrating macroeconomic and trade datasets such as GDP and population forecasts, bilateral import–export flows, tariff structures, elasticity differentials between developed and developing economies, geographic distance, and import demand projections. Using weighted trade values from 2020–2024 as the base period to project country-to-country export potential for 2030, these inputs are operationalized through calculated drivers such as gravity model parameters, tariff impact factors, and projected GDP per-capita growth. Through an analysis of hidden potentials, demand hotspots, and market conditions that are most favorable to success, this method enables firms to focus on target countries, maximize returns, and global expansion with data, backed by accuracy.
By factoring in the projected importer demand gap that is currently unmet and could be potential opportunity, it identifies the potential for the Exporter (Country) among 190 countries, against the general trade analysis, which identifies the biggest importer or exporter.
To discover high-growth global markets and optimize your business strategy:
Click Here
Pricing
- Single User License$ 1,995
- Department License$ 2,400
- Site License$ 3,120
- Global License$ 3,795

Leadership Perspectives from Industry Events
Search
Thought Leadership and Analyst Meet


Our Clients
6WResearch In News
- Doha a strategic location for EV manufacturing hub: IPA Qatar
- Demand for luxury TVs surging in the GCC, says Samsung
- Empowering Growth: The Thriving Journey of Bangladesh’s Cable Industry
- Demand for luxury TVs surging in the GCC, says Samsung
- Video call with a traditional healer? Once unthinkable, it’s now common in South Africa
- Intelligent Buildings To Smooth GCC’s Path To Net Zero
Latest Reports
- New Zealand Aseptic Manufacturing Market (2026-2032)
- Netherlands Aseptic Manufacturing Market (2026-2032)
- Nauru Aseptic Manufacturing Market (2026-2032)
- Namibia Aseptic Manufacturing Market (2026-2032)
- Mozambique Aseptic Manufacturing Market (2026-2032)
- Montenegro Aseptic Manufacturing Market (2026-2032)
- Mongolia Aseptic Manufacturing Market (2026-2032)
- Monaco Aseptic Manufacturing Market (2026-2032)
- Micronesia Aseptic Manufacturing Market (2026-2032)
- Mauritius Aseptic Manufacturing Market (2026-2032)
Industry Events and Analyst Meet

HIMTEX 2026

India Refining Summit 2026

India EV Show 2026

EV tech India Expo 2026

Auto Tech Asia 2026
Whitepaper
- Middle East & Africa Commercial Security Market Click here to view more.
- Middle East & Africa Fire Safety Systems & Equipment Market Click here to view more.
- GCC Drone Market Click here to view more.
- Middle East Lighting Fixture Market Click here to view more.
- GCC Physical & Perimeter Security Market Click here to view more.