Ecuador Water Pump Market (2026-2032) | Revenue, Pricing Analysis, Competition, Share, Drivers, Segmentation, Value, Segments, Supply, Trends, Outlook, Forecast, Growth, Analysis, Consumer Insights, Industry, Strategy, Restraints, Investment Trends, Strategic Insights, Size, Companies, Competitive, Challenges, Demand, Opportunities
Market Forecast By Type (Centrifugal Pumps, Diaphragm Pumps, Submersible Pumps, Positive Displacement Pumps, Peristaltic Pumps), By Power Source (Electric, Mechanical, Hydraulic, Pneumatic, Roller-driven), By End User (Municipal Water Supply, Industrial Processing, Oil & Gas, Agriculture, Healthcare), By Application (Water Distribution, Chemical Handling, Fluid Extraction, Irrigation Systems, Medical Fluid Transfer), By End Use (Professional Tattooing, Tattoo Studios) And Competitive Landscape
| Product Code: ETC11303003 | Publication Date: Apr 2025 | Updated Date: Apr 2026 | Product Type: Market Research Report | |
| Publisher: 6Wresearch | Author: Bhawna Singh | No. of Pages: 65 | No. of Figures: 34 | No. of Tables: 19 |
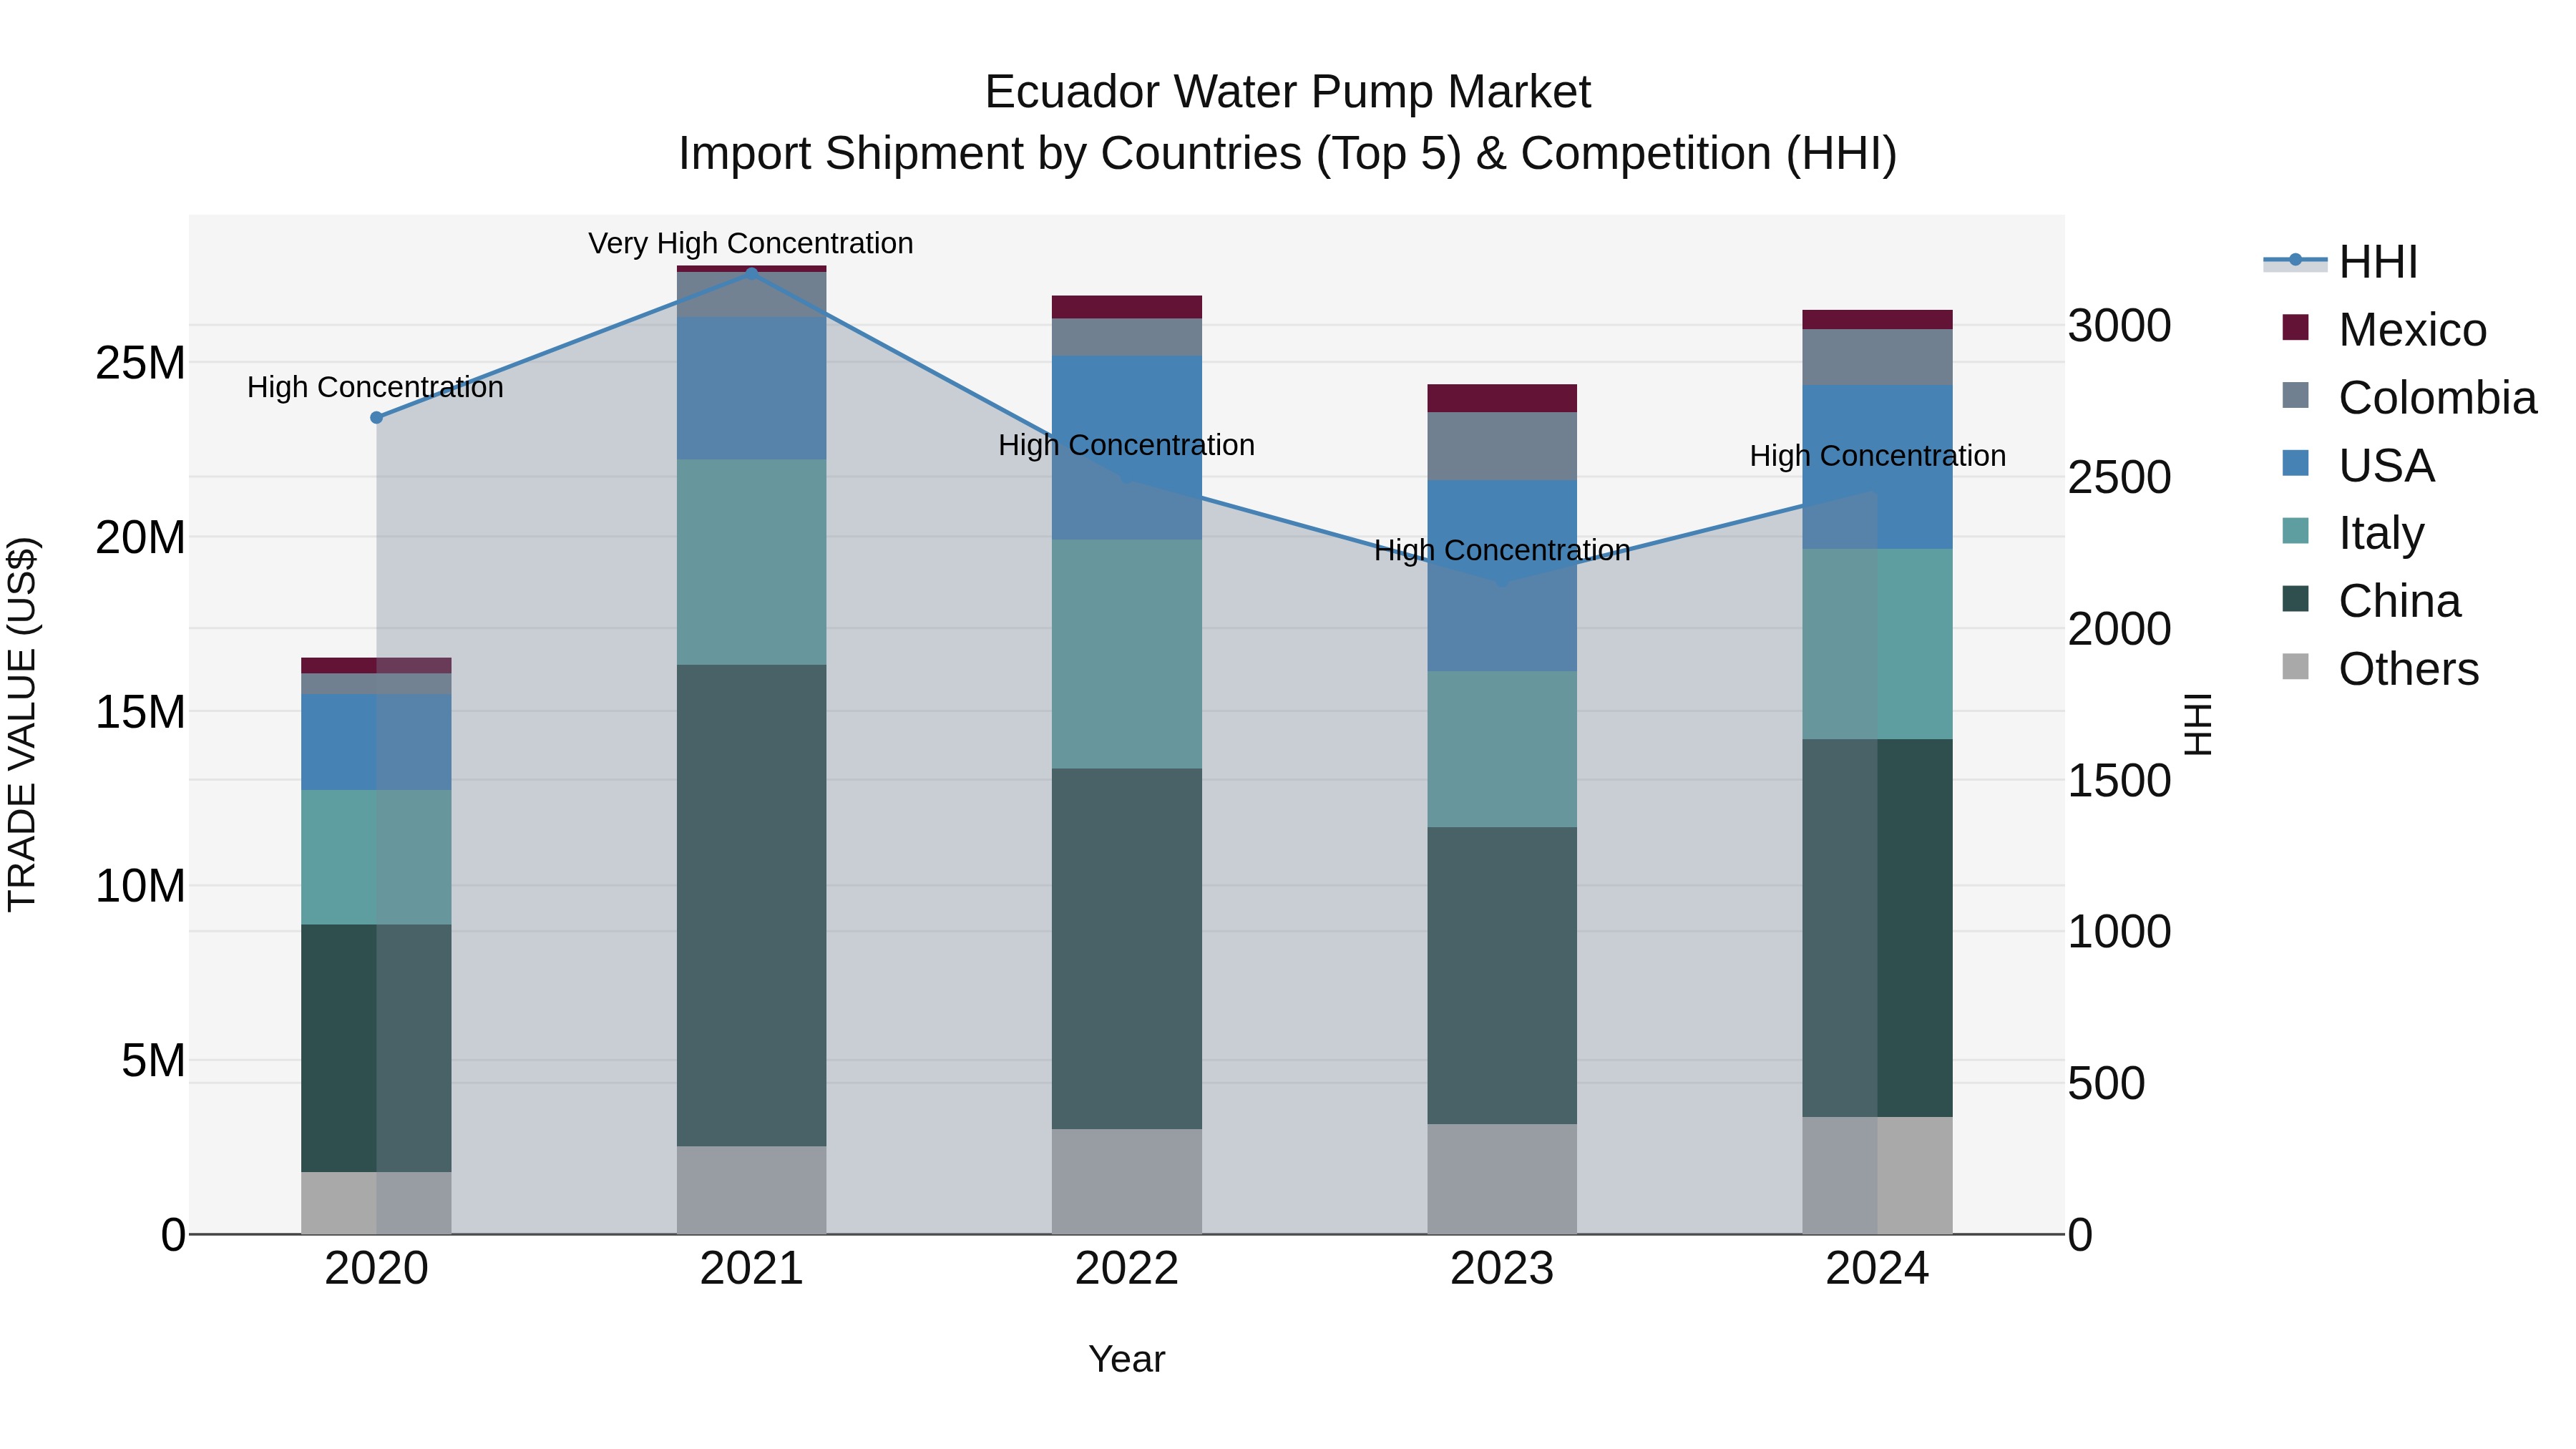
Ecuador Water Pump Market Top 5 Importing Countries and Market Competition (HHI) Analysis
Ecuador`s water pump import Market Top 5 Importing Countries and Market Competition (HHI) Analysis continued to show strong growth in 2024, with top exporters being China, Italy, USA, Colombia, and UK. Despite high concentration levels indicated by the Herfindahl-Hirschman Index (HHI), the Market Top 5 Importing Countries and Market Competition (HHI) Analysis maintained a healthy Compound Annual Growth Rate (CAGR) of 12.52% from 2020 to 2024. The growth momentum further accelerated in 2024, with a notable growth rate of 8.77% compared to the previous year. These trends suggest a robust demand for water pumps in Ecuador and highlight the competitive landscape dominated by key exporting countries.
Key Highlights of the Report:
- Ecuador Water Pump Market Outlook
- Market Size of Ecuador Water Pump Market, 2025
- Forecast of Ecuador Water Pump Market, 2032
- Historical Data and Forecast of Ecuador Water Pump Revenues & Volume for the Period 2022 - 2032F
- Ecuador Water Pump Market Trend Evolution
- Ecuador Water Pump Market Drivers and Challenges
- Ecuador Water Pump Price Trends
- Ecuador Water Pump Porter's Five Forces
- Ecuador Water Pump Industry Life Cycle
- Historical Data and Forecast of Ecuador Water Pump Market Revenues & Volume By Type for the Period 2022 - 2032F
- Historical Data and Forecast of Ecuador Water Pump Market Revenues & Volume By Centrifugal Pumps for the Period 2022 - 2032F
- Historical Data and Forecast of Ecuador Water Pump Market Revenues & Volume By Diaphragm Pumps for the Period 2022 - 2032F
- Historical Data and Forecast of Ecuador Water Pump Market Revenues & Volume By Submersible Pumps for the Period 2022 - 2032F
- Historical Data and Forecast of Ecuador Water Pump Market Revenues & Volume By Positive Displacement Pumps for the Period 2022 - 2032F
- Historical Data and Forecast of Ecuador Water Pump Market Revenues & Volume By Peristaltic Pumps for the Period 2022 - 2032F
- Historical Data and Forecast of Ecuador Water Pump Market Revenues & Volume By Power Source for the Period 2022 - 2032F
- Historical Data and Forecast of Ecuador Water Pump Market Revenues & Volume By Electric for the Period 2022 - 2032F
- Historical Data and Forecast of Ecuador Water Pump Market Revenues & Volume By Mechanical for the Period 2022 - 2032F
- Historical Data and Forecast of Ecuador Water Pump Market Revenues & Volume By Hydraulic for the Period 2022 - 2032F
- Historical Data and Forecast of Ecuador Water Pump Market Revenues & Volume By Pneumatic for the Period 2022 - 2032F
- Historical Data and Forecast of Ecuador Water Pump Market Revenues & Volume By Roller-driven for the Period 2022 - 2032F
- Historical Data and Forecast of Ecuador Water Pump Market Revenues & Volume By End User for the Period 2022 - 2032F
- Historical Data and Forecast of Ecuador Water Pump Market Revenues & Volume By Municipal Water Supply for the Period 2022 - 2032F
- Historical Data and Forecast of Ecuador Water Pump Market Revenues & Volume By Industrial Processing for the Period 2022 - 2032F
- Historical Data and Forecast of Ecuador Water Pump Market Revenues & Volume By Oil & Gas for the Period 2022 - 2032F
- Historical Data and Forecast of Ecuador Water Pump Market Revenues & Volume By Agriculture for the Period 2022 - 2032F
- Historical Data and Forecast of Ecuador Water Pump Market Revenues & Volume By Healthcare for the Period 2022 - 2032F
- Historical Data and Forecast of Ecuador Water Pump Market Revenues & Volume By Application for the Period 2022 - 2032F
- Historical Data and Forecast of Ecuador Water Pump Market Revenues & Volume By Water Distribution for the Period 2022 - 2032F
- Historical Data and Forecast of Ecuador Water Pump Market Revenues & Volume By Chemical Handling for the Period 2022 - 2032F
- Historical Data and Forecast of Ecuador Water Pump Market Revenues & Volume By Fluid Extraction for the Period 2022 - 2032F
- Historical Data and Forecast of Ecuador Water Pump Market Revenues & Volume By Irrigation Systems for the Period 2022 - 2032F
- Historical Data and Forecast of Ecuador Water Pump Market Revenues & Volume By Medical Fluid Transfer for the Period 2022 - 2032F
- Historical Data and Forecast of Ecuador Water Pump Market Revenues & Volume By End Use for the Period 2022 - 2032F
- Historical Data and Forecast of Ecuador Water Pump Market Revenues & Volume By Professional Tattooing for the Period 2022 - 2032F
- Historical Data and Forecast of Ecuador Water Pump Market Revenues & Volume By Tattoo Studios for the Period 2022 - 2032F
- Ecuador Water Pump Import Export Trade Statistics
- Market Opportunity Assessment By Type
- Market Opportunity Assessment By Power Source
- Market Opportunity Assessment By End User
- Market Opportunity Assessment By Application
- Market Opportunity Assessment By End Use
- Ecuador Water Pump Top Companies Market Share
- Ecuador Water Pump Competitive Benchmarking By Technical and Operational Parameters
- Ecuador Water Pump Company Profiles
- Ecuador Water Pump Key Strategic Recommendations
Frequently Asked Questions About the Market Study (FAQs):
6Wresearch actively monitors the Ecuador Water Pump Market and publishes its comprehensive annual report, highlighting emerging trends, growth drivers, revenue analysis, and forecast outlook. Our insights help businesses to make data-backed strategic decisions with ongoing market dynamics. Our analysts track relevent industries related to the Ecuador Water Pump Market, allowing our clients with actionable intelligence and reliable forecasts tailored to emerging regional needs.
Yes, we provide customisation as per your requirements. To learn more, feel free to contact us on sales@6wresearch.com
1 Executive Summary |
2 Introduction |
2.1 Key Highlights of the Report |
2.2 Report Description |
2.3 Market Scope & Segmentation |
2.4 Research Methodology |
2.5 Assumptions |
3 Ecuador Water Pump Market Overview |
3.1 Ecuador Country Macro Economic Indicators |
3.2 Ecuador Water Pump Market Revenues & Volume, 2022 & 2032F |
3.3 Ecuador Water Pump Market - Industry Life Cycle |
3.4 Ecuador Water Pump Market - Porter's Five Forces |
3.5 Ecuador Water Pump Market Revenues & Volume Share, By Type, 2022 & 2032F |
3.6 Ecuador Water Pump Market Revenues & Volume Share, By Power Source, 2022 & 2032F |
3.7 Ecuador Water Pump Market Revenues & Volume Share, By End User, 2022 & 2032F |
3.8 Ecuador Water Pump Market Revenues & Volume Share, By Application, 2022 & 2032F |
4 Ecuador Water Pump Market Dynamics |
4.1 Impact Analysis |
4.2 Market Drivers |
4.2.1 Increasing urbanization leading to higher demand for water pumps in residential and commercial buildings |
4.2.2 Growth in agricultural activities driving the need for irrigation systems and water pumps |
4.2.3 Government initiatives to improve water infrastructure and access to clean water |
4.3 Market Restraints |
4.3.1 Fluctuating raw material prices affecting the manufacturing costs of water pumps |
4.3.2 High initial investment required for purchasing and installing water pump systems |
4.3.3 Limited access to reliable electricity in rural areas hindering the widespread adoption of water pumps |
5 Ecuador Water Pump Market Trends |
6 Ecuador Water Pump Market, By Types |
6.1 Ecuador Water Pump Market, By Type |
6.1.1 Overview and Analysis |
6.1.2 Ecuador Water Pump Market Revenues & Volume, By Type, 2022 - 2032F |
6.1.3 Ecuador Water Pump Market Revenues & Volume, By Centrifugal Pumps, 2022 - 2032F |
6.1.4 Ecuador Water Pump Market Revenues & Volume, By Diaphragm Pumps, 2022 - 2032F |
6.1.5 Ecuador Water Pump Market Revenues & Volume, By Submersible Pumps, 2022 - 2032F |
6.1.6 Ecuador Water Pump Market Revenues & Volume, By Positive Displacement Pumps, 2022 - 2032F |
6.1.7 Ecuador Water Pump Market Revenues & Volume, By Peristaltic Pumps, 2022 - 2032F |
6.2 Ecuador Water Pump Market, By Power Source |
6.2.1 Overview and Analysis |
6.2.2 Ecuador Water Pump Market Revenues & Volume, By Electric, 2022 - 2032F |
6.2.3 Ecuador Water Pump Market Revenues & Volume, By Mechanical, 2022 - 2032F |
6.2.4 Ecuador Water Pump Market Revenues & Volume, By Hydraulic, 2022 - 2032F |
6.2.5 Ecuador Water Pump Market Revenues & Volume, By Pneumatic, 2022 - 2032F |
6.2.6 Ecuador Water Pump Market Revenues & Volume, By Roller-driven, 2022 - 2032F |
6.3 Ecuador Water Pump Market, By End User |
6.3.1 Overview and Analysis |
6.3.2 Ecuador Water Pump Market Revenues & Volume, By Municipal Water Supply, 2022 - 2032F |
6.3.3 Ecuador Water Pump Market Revenues & Volume, By Industrial Processing, 2022 - 2032F |
6.3.4 Ecuador Water Pump Market Revenues & Volume, By Oil & Gas, 2022 - 2032F |
6.3.5 Ecuador Water Pump Market Revenues & Volume, By Agriculture, 2022 - 2032F |
6.3.6 Ecuador Water Pump Market Revenues & Volume, By Healthcare, 2022 - 2032F |
6.4 Ecuador Water Pump Market, By Application |
6.4.1 Overview and Analysis |
6.4.2 Ecuador Water Pump Market Revenues & Volume, By Water Distribution, 2022 - 2032F |
6.4.3 Ecuador Water Pump Market Revenues & Volume, By Chemical Handling, 2022 - 2032F |
6.4.4 Ecuador Water Pump Market Revenues & Volume, By Fluid Extraction, 2022 - 2032F |
6.4.5 Ecuador Water Pump Market Revenues & Volume, By Irrigation Systems, 2022 - 2032F |
6.4.6 Ecuador Water Pump Market Revenues & Volume, By Medical Fluid Transfer, 2022 - 2032F |
7 Ecuador Water Pump Market Import-Export Trade Statistics |
7.1 Ecuador Water Pump Market Export to Major Countries |
7.2 Ecuador Water Pump Market Imports from Major Countries |
8 Ecuador Water Pump Market Key Performance Indicators |
8.1 Average lifespan of water pump systems in operation |
8.2 Energy efficiency ratings of water pump models available in the market |
8.3 Rate of adoption of smart water pump technologies |
8.4 Water pump maintenance and repair service availability and response time |
8.5 Percentage of water pump installations in off-grid or rural areas |
9 Ecuador Water Pump Market - Opportunity Assessment |
9.1 Ecuador Water Pump Market Opportunity Assessment, By Type, 2022 & 2032F |
9.2 Ecuador Water Pump Market Opportunity Assessment, By Power Source, 2022 & 2032F |
9.3 Ecuador Water Pump Market Opportunity Assessment, By End User, 2022 & 2032F |
9.4 Ecuador Water Pump Market Opportunity Assessment, By Application, 2022 & 2032F |
10 Ecuador Water Pump Market - Competitive Landscape |
10.1 Ecuador Water Pump Market Revenue Share, By Companies, 2025 |
10.2 Ecuador Water Pump Market Competitive Benchmarking, By Operating and Technical Parameters |
11 Company Profiles |
12 Recommendations |
13 Disclaimer |
Global Go To Market Strategy - 2030
Export potential enables firms to identify high-growth global markets with greater confidence by combining advanced trade intelligence with a structured quantitative methodology. The framework analyzes emerging demand trends and country-level import patterns while integrating macroeconomic and trade datasets such as GDP and population forecasts, bilateral import–export flows, tariff structures, elasticity differentials between developed and developing economies, geographic distance, and import demand projections. Using weighted trade values from 2020–2024 as the base period to project country-to-country export potential for 2030, these inputs are operationalized through calculated drivers such as gravity model parameters, tariff impact factors, and projected GDP per-capita growth. Through an analysis of hidden potentials, demand hotspots, and market conditions that are most favorable to success, this method enables firms to focus on target countries, maximize returns, and global expansion with data, backed by accuracy.
By factoring in the projected importer demand gap that is currently unmet and could be potential opportunity, it identifies the potential for the Exporter (Country) among 190 countries, against the general trade analysis, which identifies the biggest importer or exporter.
To discover high-growth global markets and optimize your business strategy:
Click Here
Pricing
- Single User License$ 1,995
- Department License$ 2,400
- Site License$ 3,120
- Global License$ 3,795

Leadership Perspectives from Industry Events
Search
Thought Leadership and Analyst Meet


Our Clients
6WResearch In News
- India Export Attractiveness Tracker 2026
- India Air Conditioner Market Set for Strong Rebound in 2026 After Weather-Led Correction and GST-Driven Recovery: 6Wresearch
- ADAS in India: How Automatic Emergency Braking, Blind Spot Detection & Driver Monitoring are Transforming Road Safety
- Doha a strategic location for EV manufacturing hub: IPA Qatar
- Demand for luxury TVs surging in the GCC, says Samsung
- Empowering Growth: The Thriving Journey of Bangladesh’s Cable Industry
Latest Reports
- Nicaragua RPG Gaming Market (2026-2032)
- New Zealand RPG Gaming Market (2026-2032)
- Netherlands RPG Gaming Market (2026-2032)
- Nauru RPG Gaming Market (2026-2032)
- Namibia RPG Gaming Market (2026-2032)
- Mozambique RPG Gaming Market (2026-2032)
- Montenegro RPG Gaming Market (2026-2032)
- Mongolia RPG Gaming Market (2026-2032)
- Monaco RPG Gaming Market (2026-2032)
- Micronesia RPG Gaming Market (2026-2032)
Industry Events and Analyst Meet

EV India Expo 2026

HIMTEX 2026

India Refining Summit 2026

India EV Show 2026

EV tech India Expo 2026
Whitepaper
- Middle East & Africa Commercial Security Market Click here to view more.
- Middle East & Africa Fire Safety Systems & Equipment Market Click here to view more.
- GCC Drone Market Click here to view more.
- Middle East Lighting Fixture Market Click here to view more.
- GCC Physical & Perimeter Security Market Click here to view more.