Egypt Digital Biomarkers Market (2026-2032) Outlook | Analysis, Companies, Forecast, Share, Size, Value, Growth, Revenue, Trends & Industry
Market Forecast By Type (Wellness, Disease, Drugs), By Collection System Type (Wearables, Biosensors, Mobile Apps, Devices and Platforms, Desktop Based Software), By End-users (Pharmaceutical, Life Sciences, Medical Devices, App Vendors, Clinical Research Organizations), By Technology (Cloud Computing, Artificial Intelligence and Machine Learning, Augmented Reality, Blockchain) And Competitive Landscape
| Product Code: ETC072131 | Publication Date: Jun 2021 | Updated Date: Jun 2026 | Product Type: Report | |
| Publisher: 6Wresearch | Author: Sachin Kumar Rai | No. of Pages: 70 | No. of Figures: 35 | No. of Tables: 5 |
Malaysia Electric Vehicle Charging Infrastructure Market Size, Share & Growth Rate
The Malaysia Electric Vehicle Charging Infrastructure Market was estimated at USD 376 Million in 2025 and is projected to reach USD 488 Million by 2032, growing at a CAGR of 3.8% from 2026 to 2032. This growth is fueled by the Malaysian government’s commitment to achieving net-zero emissions and promoting electric vehicles (EVs) through various incentives. Increasing consumer awareness of EV benefits and the urgent need to reduce urban pollution further bolster the demand for an extensive charging network.
Egypt Digital Biomarkers Market Growth Rate Analysis (2021-2032)
Malaysia Electric Vehicle Charging Infrastructure Market Growth Rate Analysis (2021-2032)
The Malaysian electric vehicle charging infrastructure market experienced a notable recovery in recent years after a decline of 3.2% in 2021, primarily due to the pandemic's impact on consumer spending and disrupted supply chains. In 2022, the market rebounded with a growth rate of 3.8%, propelled by an increasing consumer shift toward electric vehicles and supportive government policies aimed at enhancing green technology adoption. This upward trend significantly accelerated in 2023, recording an 8.8% growth as significant investments flowed into infrastructure development. Continued advancements in charging technology and rising consumer demand are expected to sustain growth at around 5% per year through 2032, as Malaysia continues its energy transition towards sustainable transportation.
Malaysia Electric Vehicle Charging Infrastructure Market Year-wise Growth Rate and Key Drivers
This graph highlights how the Malaysia Electric Vehicle Charging Infrastructure Market has steadily grown over the past five years, supported by major growth factors.
The table below presents the year‑wise growth rates along with the key drivers influencing the market
| Year | Growth Rate | Major Drivers |
| 2021 | -3.2% | Infrastructure investments faced delays |
| 2022 | 3.8% | Government incentives spurred adoption |
| 2023 | 8.8% | Consumer interest in sustainability increased |
| 2024 | 4.3% | Partnerships expanded charging networks |
| 2025 | 5.7% | Technological advancements improved efficiency |
| 2026 | 5.3% | Public awareness campaigns drove usage |
| 2027 | 5.4% | Urban development supported infrastructure growth |
| 2028 | 4.8% | Corporate fleets transitioned to electric |
| 2029 | 4.9% | Renewable energy integration enhanced appeal |
| 2030 | 4.5% | Smart charging solutions gained traction |
| 2031 | 4.5% | Regulatory support fostered market stability |
| 2032 | 4.7% | Consumer demand for convenience increased |
Note - Market size estimations and growth projections presented in this report are based on 6Wresearch’s advanced forecasting approach, validated with industry datasets as of June 2026.
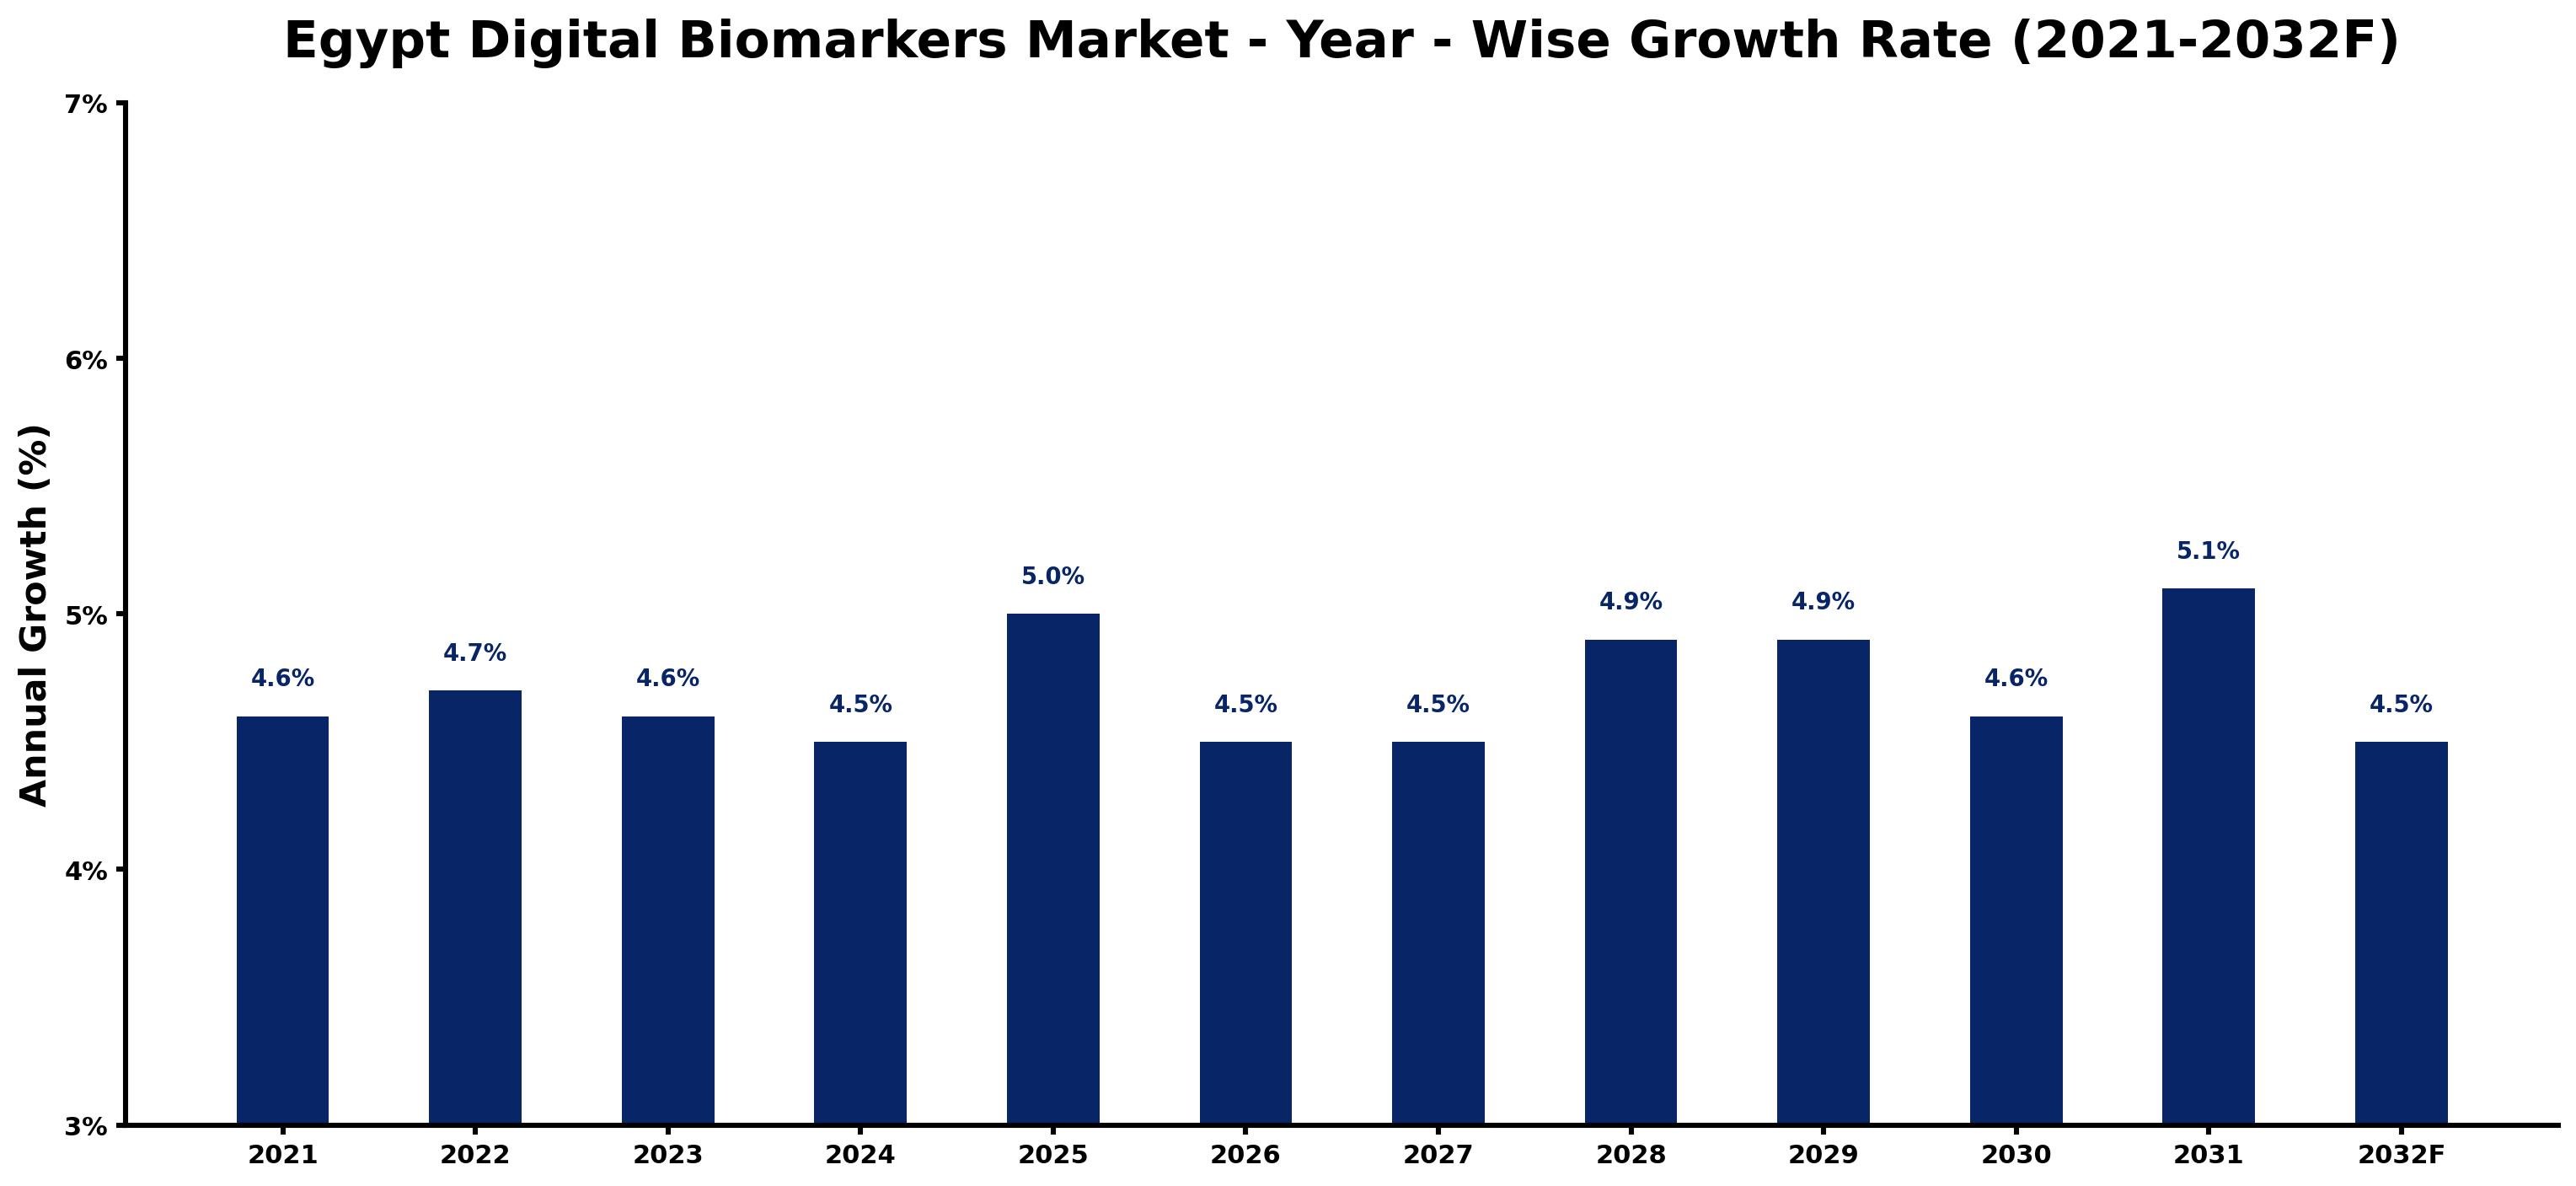
The Egypt Digital Biomarkers market has shown stable growth over the past few years, with rates fluctuating around 4.5% to 5.1%. Following a notable growth of 4.6% in 2021 and slightly rising to 4.7% in 2022, the market experienced moderate changes with a dip to 4.5% in 2024, largely due to initial hesitance in adoption among healthcare providers. However, as digitalization in health technologies progresses and consumer demand for personalized healthcare increases, a more robust growth of 5.0% is projected for 2025. The continuous investments in healthcare infrastructure and supportive government policies are expected to sustain this momentum, fostering a promising environment for digital biomarkers through 2032.
Egypt Digital Biomarkers Market Year-wise Growth Rate and Key Drivers
This graph highlights how the Egypt Digital Biomarkers Market has steadily grown over the past five years, supported by major growth factors.
The table below presents the year‑wise growth rates along with the key drivers influencing the market
| Year | Growth Rate | Major Drivers |
| 2021 | 4.6% | Increasing industrial automation investments |
| 2022 | 4.7% | Growing renewable energy integration projects |
| 2023 | 4.6% | Expansion of transportation and logistics networks |
| 2024 | 4.5% | Increasing industrial automation investments |
| 2025 | 5.0% | Growing urbanization and commercial development |
| 2026 | 4.5% | Government infrastructure modernization initiatives |
| 2027 | 4.5% | Expansion of commercial construction activities |
| 2028 | 4.9% | Growing renewable energy integration projects |
| 2029 | 4.9% | Government infrastructure modernization initiatives |
| 2030 | 4.6% | Government infrastructure modernization initiatives |
| 2031 | 5.1% | Rapid growth in telecom and data center sectors |
| 2032 | 4.5% | Growing urbanization and commercial development |
Note - Market size estimations and growth projections presented in this report are based on 6Wresearch’s advanced forecasting approach, validated with industry datasets as of June 2026.
Malaysia Electric Vehicle Charging Infrastructure Market Synopsis
The electric vehicle charging infrastructure in Malaysia is on the cusp of transformative growth. With a pronounced governmental push towards sustainable transportation, investments in EV charging stations are steadily increasing across urban and suburban regions.
Recent initiatives have highlighted the importance of strategic partnerships between public and private sectors to enhance the availability of charging stations. This collaborative effort is essential for making EV ownership more feasible and attractive to Malaysian consumers.
Malaysia Electric Vehicle Charging Infrastructure Market Key Takeaways
- The market is witnessing significant growth driven by government policies aimed at promoting electric vehicle adoption.
- Strategic investments are being made to expand the charging network across both urban and rural areas.
- Consumer awareness and demand for sustainable transportation solutions are on the rise.
- The emphasis on partnerships between public and private entities is crucial for the development of efficient infrastructure.
- Technological advancements in charging solutions are enhancing user convenience and accessibility.
Evaluation of Restraints in Malaysia Electric Vehicle Charging Infrastructure Market
Despite the positive trajectory, several constraints hinder the acceleration of the Malaysia Electric Vehicle Charging Infrastructure Market. One key limitation is the relatively slow pace of infrastructure development compared to the growing number of EVs on the road. Additionally, the initial costs associated with installing and maintaining charging stations can deter potential investors. Issues related to the standardization of charging technologies also create challenges in ensuring compatibility and user convenience across various EV models.
Malaysia Electric Vehicle Charging Infrastructure Market Trends
The landscape of the Malaysia Electric Vehicle Charging Infrastructure Market is shaped by several emerging trends. One significant trend is the shift towards fast-charging solutions, enabling quicker charging times and enhancing consumer convenience. Moreover, there is a growing focus on integrating renewable energy sources, such as solar power, into the charging infrastructure to support sustainability goals. Mobile applications for locating and reserving charging stations are also gaining traction, providing users with a seamless experience.
Malaysia Electric Vehicle Charging Infrastructure Market Opportunities
Investment opportunities abound in the Malaysia Electric Vehicle Charging Infrastructure Market, particularly in the development of charging networks in underrepresented areas. Expansion into rural locations and strategic partnerships with shopping centers and public facilities can significantly improve accessibility. Additionally, the adoption of smart charging technologies presents a promising avenue for innovation, allowing for real-time data management and consumer engagement, which can optimize charging solutions and enhance user experience.
Government Initiatives in the Malaysia Electric Vehicle Charging Infrastructure Market
The Malaysian government is actively promoting the development of electric vehicle infrastructure through various initiatives. Policies aimed at providing financial incentives for charging station installations and subsidies for EV purchases are pivotal in fostering market growth. Additionally, government-led campaigns are increasing public awareness of electric vehicles and their environmental benefits, reinforcing the importance of charging infrastructure in supporting sustainable transport solutions.
Future Insights of the Malaysia Electric Vehicle Charging Infrastructure Market
Looking ahead to 2026-2032, the Malaysia Electric Vehicle Charging Infrastructure Market is expected to thrive, driven by continued governmental support and an increasing consumer shift towards electric mobility. The integration of advanced charging technologies and the expansion of renewable energy sources are likely to further enhance the infrastructure. As consumer acceptance of electric vehicles grows, the demand for reliable charging solutions will continue to escalate, creating a robust ecosystem for investment and innovation.
Malaysia Electric Vehicle Charging Infrastructure Market Latest Developments (May 2025 - June 2026)
Recent developments in the Malaysia Electric Vehicle Charging Infrastructure Market indicate a strong commitment to expanding the network. Several municipalities are actively seeking partnerships to accelerate the deployment of charging stations. Innovations in charging technology, including the introduction of ultra-fast charging options, are being prioritized to meet consumer demand. Public-private collaborations are becoming increasingly vital in shaping an efficient, accessible charging landscape.
Malaysia Electric Vehicle Charging Infrastructure Market - Key Attractiveness of the Report
- 10 Years of Market Numbers
- Historical Data Starting from 2022 to 2025
- Base Year: 2025
- Forecast Data until 2032
- Key Performance Indicators Impacting the Market
- Major Upcoming Developments and Projects
Key Highlights of the Report:
- Egypt Digital Biomarkers Market Outlook
- Market Size of Egypt Digital Biomarkers Market, 2025
- Forecast of Egypt Digital Biomarkers Market, 2032
- Historical Data and Forecast of Egypt Digital Biomarkers Revenues & Volume for the Period 2022-2032F
- Egypt Digital Biomarkers Market Trend Evolution
- Egypt Digital Biomarkers Market Drivers and Challenges
- Egypt Digital Biomarkers Price Trends
- Egypt Digital Biomarkers Porter's Five Forces
- Egypt Digital Biomarkers Industry Life Cycle
- Historical Data and Forecast of Egypt Digital Biomarkers Market Revenues & Volume By Type for the Period 2022-2032F
- Historical Data and Forecast of Egypt Digital Biomarkers Market Revenues & Volume By Wellness for the Period 2022-2032F
- Historical Data and Forecast of Egypt Digital Biomarkers Market Revenues & Volume By Disease for the Period 2022-2032F
- Historical Data and Forecast of Egypt Digital Biomarkers Market Revenues & Volume By Drugs for the Period 2022-2032F
- Historical Data and Forecast of Egypt Digital Biomarkers Market Revenues & Volume By Collection System Type for the Period 2022-2032F
- Historical Data and Forecast of Egypt Digital Biomarkers Market Revenues & Volume By Wearables for the Period 2022-2032F
- Historical Data and Forecast of Egypt Digital Biomarkers Market Revenues & Volume By Biosensors for the Period 2022-2032F
- Historical Data and Forecast of Egypt Digital Biomarkers Market Revenues & Volume By Mobile Apps for the Period 2022-2032F
- Historical Data and Forecast of Egypt Digital Biomarkers Market Revenues & Volume By Devices and Platforms for the Period 2022-2032F
- Historical Data and Forecast of Egypt Digital Biomarkers Market Revenues & Volume By Desktop Based Software for the Period 2022-2032F
- Historical Data and Forecast of Egypt Digital Biomarkers Market Revenues & Volume By End-users for the Period 2022-2032F
- Historical Data and Forecast of Egypt Digital Biomarkers Market Revenues & Volume By Pharmaceutical for the Period 2022-2032F
- Historical Data and Forecast of Egypt Digital Biomarkers Market Revenues & Volume By Life Sciences for the Period 2022-2032F
- Historical Data and Forecast of Egypt Digital Biomarkers Market Revenues & Volume By Medical Devices for the Period 2022-2032F
- Historical Data and Forecast of Egypt Digital Biomarkers Market Revenues & Volume By App Vendors for the Period 2022-2032F
- Historical Data and Forecast of Egypt Digital Biomarkers Market Revenues & Volume By Clinical Research Organizations for the Period 2022-2032F
- Historical Data and Forecast of Egypt Digital Biomarkers Market Revenues & Volume By Technology for the Period 2022-2032F
- Historical Data and Forecast of Egypt Digital Biomarkers Market Revenues & Volume By Cloud Computing for the Period 2022-2032F
- Historical Data and Forecast of Egypt Digital Biomarkers Market Revenues & Volume By Artificial Intelligence and Machine Learning for the Period 2022-2032F
- Historical Data and Forecast of Egypt Digital Biomarkers Market Revenues & Volume By Augmented Reality for the Period 2022-2032F
- Historical Data and Forecast of Egypt Digital Biomarkers Market Revenues & Volume By Blockchain for the Period 2022-2032F
- Egypt Digital Biomarkers Import Export Trade Statistics
- Market Opportunity Assessment By Type
- Market Opportunity Assessment By Collection System Type
- Market Opportunity Assessment By End-users
- Market Opportunity Assessment By Technology
- Egypt Digital Biomarkers Top Companies Market Share
- Egypt Digital Biomarkers Competitive Benchmarking By Technical and Operational Parameters
- Egypt Digital Biomarkers Company Profiles
- Egypt Digital Biomarkers Key Strategic Recommendations
Frequently Asked Questions About the Market Study (FAQs):
The surge in electric vehicle adoption, supported by favorable government policies and rising environmental awareness, are primary drivers behind the market's growth.
The Malaysia Electric Vehicle Charging Infrastructure Market was estimated at USD 376 Million in 2025 and is projected to reach USD 488 Million by 2032, marking a steady growth trajectory.
The Malaysian government is pivotal in this market through incentives for EV adoption and initiatives aimed at enhancing the charging network, contributing to a more sustainable transportation ecosystem.
Yes, there are abundant opportunities in expanding the network into underserved areas, particularly in rural locations, as well as in innovative smart charging technologies.
The market is seeing trends such as the rise of fast-charging solutions, integration of renewable energy into charging stations, and the increasing use of mobile apps for enhanced user experience.
As more Malaysians embrace electric vehicles, the demand for convenient and widely available charging solutions is paramount. The current pace of infrastructure expansion must align with these growing expectations to fully support market growth.
6Wresearch actively monitors the Egypt Digital Biomarkers Market and publishes its comprehensive annual report, highlighting emerging trends, growth drivers, revenue analysis, and forecast outlook. Our insights help businesses to make data-backed strategic decisions with ongoing market dynamics. Our analysts track relevent industries related to the Egypt Digital Biomarkers Market, allowing our clients with actionable intelligence and reliable forecasts tailored to emerging regional needs.
Yes, we provide customisation as per your requirements. To learn more, feel free to contact us on sales@6wresearch.com
1 Executive Summary |
2 Introduction |
2.1 Key Highlights of the Report |
2.2 Report Description |
2.3 Market Scope & Segmentation |
2.4 Research Methodology |
2.5 Assumptions |
3 Egypt Digital Biomarkers Market Overview |
3.1 Egypt Country Macro Economic Indicators |
3.2 Egypt Digital Biomarkers Market Revenues & Volume, 2022 & 2032F |
3.3 Egypt Digital Biomarkers Market - Industry Life Cycle |
3.4 Egypt Digital Biomarkers Market - Porter's Five Forces |
3.5 Egypt Digital Biomarkers Market Revenues & Volume Share, By Type, 2022 & 2032F |
3.6 Egypt Digital Biomarkers Market Revenues & Volume Share, By Collection System Type, 2022 & 2032F |
3.7 Egypt Digital Biomarkers Market Revenues & Volume Share, By End-users, 2022 & 2032F |
3.8 Egypt Digital Biomarkers Market Revenues & Volume Share, By Technology, 2022 & 2032F |
4 Egypt Digital Biomarkers Market Dynamics |
4.1 Impact Analysis |
4.2 Market Drivers |
4.2.1 Government initiatives promoting electric vehicles |
4.2.2 Increasing environmental awareness and sustainability efforts |
4.2.3 Growing adoption of electric vehicles in Malaysia |
4.3 Market Restraints |
4.3.1 High initial investment costs for setting up charging infrastructure |
4.3.2 Lack of standardized charging protocols and infrastructure |
4.3.3 Limited public awareness about electric vehicle charging infrastructure |
5 Egypt Digital Biomarkers Market Trends |
6 Egypt Digital Biomarkers Market, By Types |
6.1 Egypt Digital Biomarkers Market, By Type |
6.1.1 Overview and Analysis |
6.1.2 Egypt Digital Biomarkers Market Revenues & Volume, By Type, 2022-2032F |
6.1.3 Egypt Digital Biomarkers Market Revenues & Volume, By Wellness, 2022-2032F |
6.1.4 Egypt Digital Biomarkers Market Revenues & Volume, By Disease, 2022-2032F |
6.1.5 Egypt Digital Biomarkers Market Revenues & Volume, By Drugs, 2022-2032F |
6.2 Egypt Digital Biomarkers Market, By Collection System Type |
6.2.1 Overview and Analysis |
6.2.2 Egypt Digital Biomarkers Market Revenues & Volume, By Wearables, 2022-2032F |
6.2.3 Egypt Digital Biomarkers Market Revenues & Volume, By Biosensors, 2022-2032F |
6.2.4 Egypt Digital Biomarkers Market Revenues & Volume, By Mobile Apps, 2022-2032F |
6.2.5 Egypt Digital Biomarkers Market Revenues & Volume, By Devices and Platforms, 2022-2032F |
6.2.6 Egypt Digital Biomarkers Market Revenues & Volume, By Desktop Based Software, 2022-2032F |
6.3 Egypt Digital Biomarkers Market, By End-users |
6.3.1 Overview and Analysis |
6.3.2 Egypt Digital Biomarkers Market Revenues & Volume, By Pharmaceutical, 2022-2032F |
6.3.3 Egypt Digital Biomarkers Market Revenues & Volume, By Life Sciences, 2022-2032F |
6.3.4 Egypt Digital Biomarkers Market Revenues & Volume, By Medical Devices, 2022-2032F |
6.3.5 Egypt Digital Biomarkers Market Revenues & Volume, By App Vendors, 2022-2032F |
6.3.6 Egypt Digital Biomarkers Market Revenues & Volume, By Clinical Research Organizations, 2022-2032F |
6.4 Egypt Digital Biomarkers Market, By Technology |
6.4.1 Overview and Analysis |
6.4.2 Egypt Digital Biomarkers Market Revenues & Volume, By Cloud Computing, 2022-2032F |
6.4.3 Egypt Digital Biomarkers Market Revenues & Volume, By Artificial Intelligence and Machine Learning, 2022-2032F |
6.4.4 Egypt Digital Biomarkers Market Revenues & Volume, By Augmented Reality, 2022-2032F |
6.4.5 Egypt Digital Biomarkers Market Revenues & Volume, By Blockchain, 2022-2032F |
7 Egypt Digital Biomarkers Market Import-Export Trade Statistics |
7.1 Egypt Digital Biomarkers Market Export to Major Countries |
7.2 Egypt Digital Biomarkers Market Imports from Major Countries |
8 Egypt Digital Biomarkers Market Key Performance Indicators |
8.1 Number of public charging stations installed |
8.2 Average charging time for electric vehicles |
8.3 Percentage increase in electric vehicle registrations |
8.4 Average distance between charging stations |
8.5 Utilization rate of charging infrastructure |
9 Egypt Digital Biomarkers Market - Opportunity Assessment |
9.1 Egypt Digital Biomarkers Market Opportunity Assessment, By Type, 2022 & 2032F |
9.2 Egypt Digital Biomarkers Market Opportunity Assessment, By Collection System Type, 2022 & 2032F |
9.3 Egypt Digital Biomarkers Market Opportunity Assessment, By End-users, 2022 & 2032F |
9.4 Egypt Digital Biomarkers Market Opportunity Assessment, By Technology, 2022 & 2032F |
10 Egypt Digital Biomarkers Market - Competitive Landscape |
10.1 Egypt Digital Biomarkers Market Revenue Share, By Companies, 2025 |
10.2 Egypt Digital Biomarkers Market Competitive Benchmarking, By Operating and Technical Parameters |
11 Company Profiles |
12 Recommendations |
13 Disclaimer |
Global Go To Market Strategy - 2030
Export potential enables firms to identify high-growth global markets with greater confidence by combining advanced trade intelligence with a structured quantitative methodology. The framework analyzes emerging demand trends and country-level import patterns while integrating macroeconomic and trade datasets such as GDP and population forecasts, bilateral import–export flows, tariff structures, elasticity differentials between developed and developing economies, geographic distance, and import demand projections. Using weighted trade values from 2020–2024 as the base period to project country-to-country export potential for 2030, these inputs are operationalized through calculated drivers such as gravity model parameters, tariff impact factors, and projected GDP per-capita growth. Through an analysis of hidden potentials, demand hotspots, and market conditions that are most favorable to success, this method enables firms to focus on target countries, maximize returns, and global expansion with data, backed by accuracy.
By factoring in the projected importer demand gap that is currently unmet and could be potential opportunity, it identifies the potential for the Exporter (Country) among 190 countries, against the general trade analysis, which identifies the biggest importer or exporter.
To discover high-growth global markets and optimize your business strategy:
Click Here
Pricing
- Single User License$ 1,995
- Department License$ 2,400
- Site License$ 3,120
- Global License$ 3,795

Leadership Perspectives from Industry Events
Search
Thought Leadership and Analyst Meet


Our Clients
6WResearch In News
- India Air Conditioner Market Set for Strong Rebound in 2026 After Weather-Led Correction and GST-Driven Recovery: 6Wresearch
- ADAS in India: How Automatic Emergency Braking, Blind Spot Detection & Driver Monitoring are Transforming Road Safety
- Doha a strategic location for EV manufacturing hub: IPA Qatar
- Demand for luxury TVs surging in the GCC, says Samsung
- Empowering Growth: The Thriving Journey of Bangladesh’s Cable Industry
- Demand for luxury TVs surging in the GCC, says Samsung
Latest Reports
- Nicaragua RPG Gaming Market (2026-2032)
- New Zealand RPG Gaming Market (2026-2032)
- Netherlands RPG Gaming Market (2026-2032)
- Nauru RPG Gaming Market (2026-2032)
- Namibia RPG Gaming Market (2026-2032)
- Mozambique RPG Gaming Market (2026-2032)
- Montenegro RPG Gaming Market (2026-2032)
- Mongolia RPG Gaming Market (2026-2032)
- Monaco RPG Gaming Market (2026-2032)
- Micronesia RPG Gaming Market (2026-2032)
Industry Events and Analyst Meet

HIMTEX 2026

India Refining Summit 2026

India EV Show 2026

EV tech India Expo 2026

Auto Tech Asia 2026
Whitepaper
- Middle East & Africa Commercial Security Market Click here to view more.
- Middle East & Africa Fire Safety Systems & Equipment Market Click here to view more.
- GCC Drone Market Click here to view more.
- Middle East Lighting Fixture Market Click here to view more.
- GCC Physical & Perimeter Security Market Click here to view more.