Egypt Neon Gas Market (2026-2032) Outlook | Forecast, Growth, Size, Revenue, Share, Value, Industry, Companies, Analysis & Trends
Market Forecast By Type (Low, High, Ultra High), By Application (Semiconductor, LCD, Imaging and Lighting, Refrigerator, Laser, Medical, Others) And Competitive Landscape
| Product Code: ETC094871 | Publication Date: Jun 2021 | Updated Date: Jun 2026 | Product Type: Report | |
| Publisher: 6Wresearch | Author: Ravi Bhandari | No. of Pages: 70 | No. of Figures: 35 | No. of Tables: 5 |
Egypt Neon Gas Market Size, Share & Growth Rate
The Egypt Neon Gas Market was estimated at USD 414 Million in 2025 and is projected to reach USD 573 Million by 2032, growing at a CAGR of 4.8% from 2026 to 2032. This robust growth trajectory is primarily fueled by the expanding applications of neon gas across diverse sectors, including healthcare for medical lasers, electronics for semiconductor manufacturing, and automotive for enhanced vehicle lighting. Additionally, the rising trend in neon signage and energy-efficient lighting solutions further solidifies the market's upward momentum.
Egypt Neon Gas Market Growth Rate Analysis (2021-2032)
The Egypt Neon Gas Market has exhibited a stable growth pattern over recent years, with a projected annual growth rate of 5.7% in 2021, gradually moderating to 5.4% in 2024 before rebounding to 6.0% in 2029. This sustained demand stems from increasing applications in industries such as electronics and healthcare, driven by rising consumer demand for advanced technologies and innovations. Investments in infrastructure, coupled with supportive government policies promoting energy-efficient solutions, are further contributing to the market's resilience. Notably, fluctuations in growth rates across the years reflect market adjustments and evolving industrial needs, positioning Egypt favorably within the regional neon gas landscape as it navigates the transition towards sustainable energy and technology.
Egypt Neon Gas Market Year-wise Growth Rate and Key Drivers
This graph highlights how the Egypt Neon Gas Market has steadily grown over the past five years, supported by major growth factors.
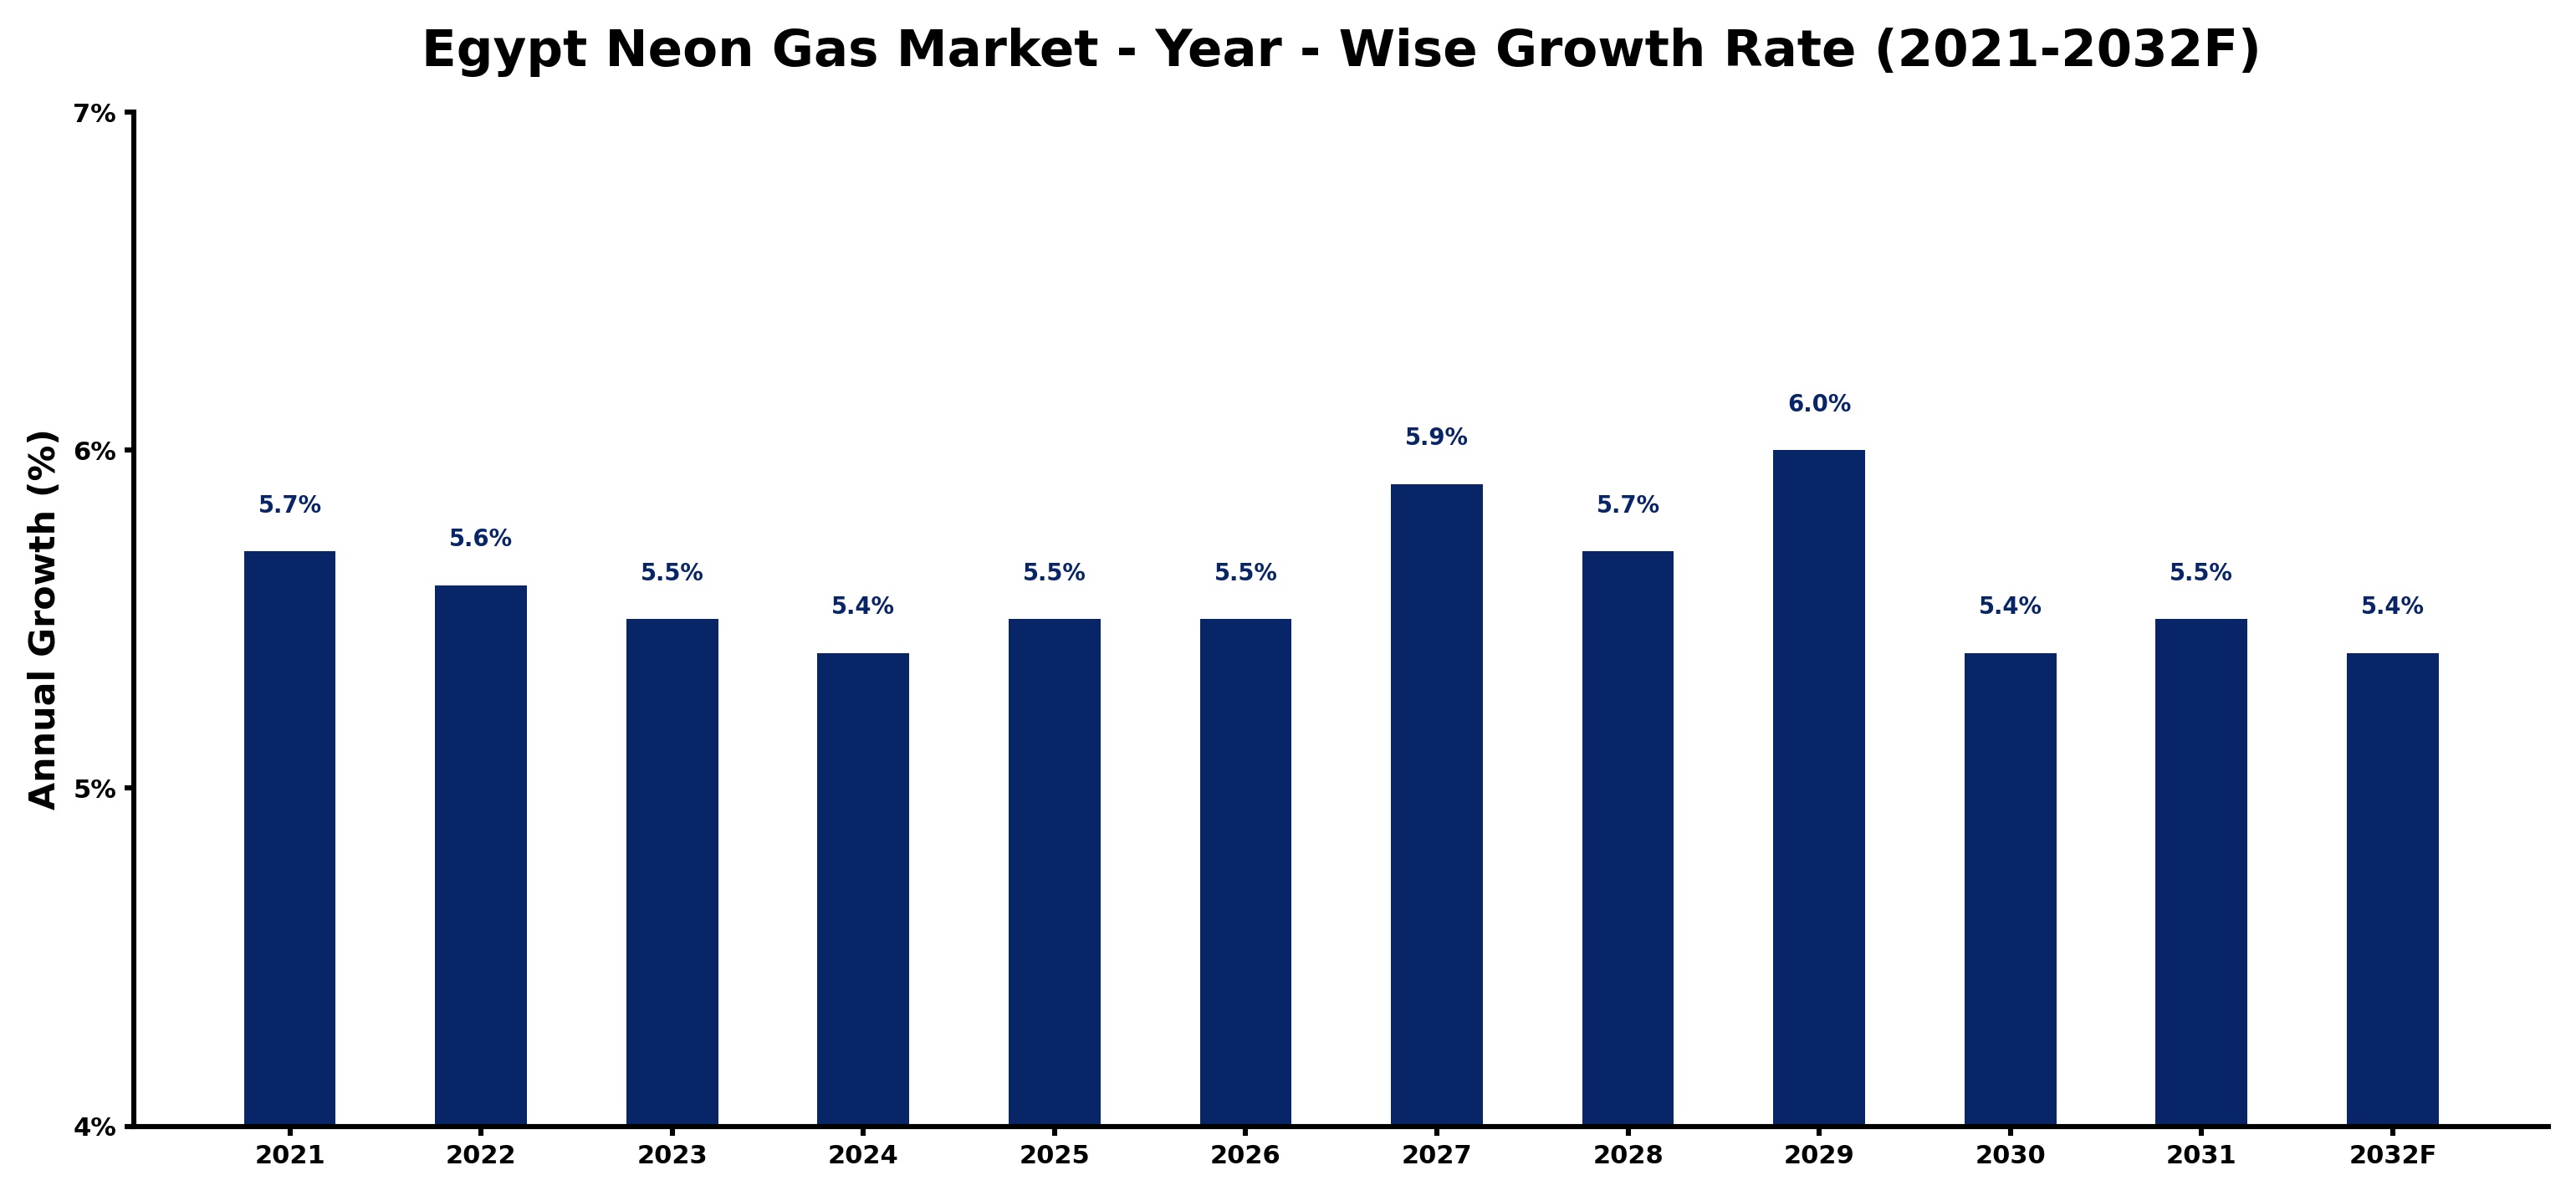
The table below presents the year‑wise growth rates along with the key drivers influencing the market
| Year | Growth Rate | Major Drivers |
| 2021 | 5.7% | Infrastructure upgrades boosted demand for neon gas in electronics |
| 2022 | 5.6% | Export driven investments boosted neon gas supply chain efficiency |
| 2023 | 5.5% | High demand for neon gas boosted production facility upgrades |
| 2024 | 5.4% | Advanced technologies streamline neon gas production efficiency and reliability |
| 2025 | 5.5% | Local manufacturing investments boosted demand for neon gas supplies |
| 2026 | 5.5% | New neon gas plant investments boost regional supply capacity |
| 2027 | 5.9% | Neon gas recycling innovations enhanced production line capacity utilization |
| 2028 | 5.7% | New glass manufacturing facilities boost neon gas demand significantly |
| 2029 | 6.0% | New manufacturing facilities boost Egypt’s neon gas production capacity |
| 2030 | 5.4% | New manufacturing facilities enhance domestic neon gas production capacity |
| 2031 | 5.5% | Adoption of smart technologies boosts neon gas extraction efficiency |
| 2032 | 5.4% | Manufacturing investments in neon supply chains boost market competition |
Note - Market size estimations and growth projections presented in this report are based on 6Wresearch’s advanced forecasting approach, validated with industry datasets as of June 2026.
Egypt Neon Gas Market Synopsis
Demand for neon gas in Egypt is notably driven by its essential role in neon signage and various lighting applications, particularly within the entertainment and retail sectors. This surge in popularity is contributing significantly to the market's expansion as businesses leverage vibrant neon displays to attract customers.
Additionally, the healthcare industry is increasingly incorporating neon gas into advanced medical technologies, including cryosurgery equipment. This multifaceted demand across key industries reinforces the necessity for reliable supply channels and production capabilities in the neon gas market.
Egypt Neon Gas Market Key Takeaways
- The market is experiencing steady growth, driven by demand from healthcare, electronics, and automotive industries.
- Neon gas is gaining traction in the production of energy-efficient lighting solutions and innovative signage.
- Government initiatives are fostering a sustainable and competitive environment for neon gas production and distribution.
- Investment opportunities are emerging, particularly within the expanding healthcare and construction sectors.
- Technological advancements are enhancing production efficiency and widening application scopes for neon gas.
Evaluation of Restraints in Egypt Neon Gas Market
Despite the positive growth outlook, the Egypt Neon Gas Market faces several restraints that could hinder progress. Fluctuations in raw material prices, particularly liquid neon, introduce volatility that can affect production costs and pricing strategies for suppliers. Furthermore, limited domestic production capacity necessitates reliance on imports, which can disrupt the supply chain and impact market competitiveness. Additionally, the infiltration of counterfeit neon gas products poses a significant threat to both consumer safety and the reputation of legitimate suppliers in the market.
Egypt Neon Gas Market Trends
Currently, the market is witnessing a pronounced trend toward energy-efficient solutions, as industries increasingly prioritize sustainability. Innovations in production technologies are also paving the way for improved efficiency and reduced costs. The growing allure of neon lighting in architectural design further drives demand, as it offers unique aesthetic qualities not found in traditional lighting sources. Lastly, enhanced applications of neon gas in the medical field signify an emerging trend in the healthcare sector.
Egypt Neon Gas Market Opportunities
The Egypt Neon Gas Market presents robust investment opportunities, particularly in the realm of healthcare, where advancements in imaging technologies are driving demand. Additionally, the burgeoning construction sector offers potential for neon gas utilization in signage and decorative lighting applications. Companies looking to invest in production and distribution capacities stand to gain significantly as the market expands, especially with the ongoing government focus on infrastructure development and energy-efficient solutions.
Government Initiatives in the Egypt Neon Gas Market
The Egyptian government is actively supporting the neon gas sector through various policies aimed at regulating production and ensuring safety standards. These include establishing quality benchmarks for neon gas and licensing requirements for suppliers. Environmental regulations are also in place to promote the responsible handling and disposal of neon gas. Furthermore, government incentives, such as tax breaks and subsidies, are encouraging investment in this burgeoning market.
Future Insights of the Egypt Neon Gas Market
Looking ahead to 2026-2032, the Egypt Neon Gas Market is expected to maintain a positive growth trajectory, bolstered by rising demands across healthcare, electronics, and the lighting sector. The continued integration of neon gas into modern technologies and the increasing adoption of neon signage in various applications will enhance market dynamics. However, stakeholders must navigate the challenges of raw material price fluctuations and regulatory landscapes to capitalize on the potential that lies ahead.
Egypt Neon Gas Market Latest Developments (May 2025 - June 2026)
In recent months, the Egypt Neon Gas Market has seen a notable shift towards enhancing production capabilities, as companies seek to address the growing demand driven by the healthcare and electronic sectors. Efforts to streamline supply chains and reduce dependency on imports are also underway, with investments in local production facilities becoming more prevalent. Additionally, there is a marked emphasis on quality control measures to combat the threat posed by counterfeit products, ensuring consumer trust and safety in the market.
Egypt Neon Gas Market - Key Attractiveness of the Report
- 10 Years of Market Numbers
- Historical Data Starting from 2022 to 2025
- Base Year: 2025
- Forecast Data until 2032
- Key Performance Indicators Impacting the Market
- Major Upcoming Developments and Projects
Key Highlights of the Report:
- Egypt Neon Gas Market Outlook
- Market Size of Egypt Neon Gas Market, 2025
- Forecast of Egypt Neon Gas Market, 2032
- Historical Data and Forecast of Egypt Neon Gas Revenues & Volume for the Period 2022-2032F
- Egypt Neon Gas Market Trend Evolution
- Egypt Neon Gas Market Drivers and Challenges
- Egypt Neon Gas Price Trends
- Egypt Neon Gas Porter's Five Forces
- Egypt Neon Gas Industry Life Cycle
- Historical Data and Forecast of Egypt Neon Gas Market Revenues & Volume By Type for the Period 2022-2032F
- Historical Data and Forecast of Egypt Neon Gas Market Revenues & Volume By Low for the Period 2022-2032F
- Historical Data and Forecast of Egypt Neon Gas Market Revenues & Volume By High for the Period 2022-2032F
- Historical Data and Forecast of Egypt Neon Gas Market Revenues & Volume By Ultra High for the Period 2022-2032F
- Historical Data and Forecast of Egypt Neon Gas Market Revenues & Volume By Application for the Period 2022-2032F
- Historical Data and Forecast of Egypt Neon Gas Market Revenues & Volume By Semiconductor for the Period 2022-2032F
- Historical Data and Forecast of Egypt Neon Gas Market Revenues & Volume By LCD for the Period 2022-2032F
- Historical Data and Forecast of Egypt Neon Gas Market Revenues & Volume By Imaging and Lighting for the Period 2022-2032F
- Historical Data and Forecast of Egypt Neon Gas Market Revenues & Volume By Refrigerator for the Period 2022-2032F
- Historical Data and Forecast of Egypt Neon Gas Market Revenues & Volume By Laser for the Period 2022-2032F
- Historical Data and Forecast of Egypt Neon Gas Market Revenues & Volume By Medical for the Period 2022-2032F
- Historical Data and Forecast of Egypt Neon Gas Market Revenues & Volume By Others for the Period 2022-2032F
- Egypt Neon Gas Import Export Trade Statistics
- Market Opportunity Assessment By Type
- Market Opportunity Assessment By Application
- Egypt Neon Gas Top Companies Market Share
- Egypt Neon Gas Competitive Benchmarking By Technical and Operational Parameters
- Egypt Neon Gas Company Profiles
- Egypt Neon Gas Key Strategic Recommendations
Egypt Neon Gas Market - Frequently Asked Questions
The growth is largely propelled by increasing demand in the electronics, healthcare, and automotive sectors, alongside the popularity of neon signage in retail and entertainment.
The Egypt Neon Gas Market was estimated at USD 414 Million in 2025 and is projected to reach USD 573 Million by 2032, growing at a CAGR of 4.8% from 2026 to 2032.
Yes, the Egyptian government is providing various incentives, such as tax breaks and subsidies, aimed at promoting sustainable practices within the neon gas industry.
Key challenges include fluctuating raw material prices, limited domestic production capacity, and the risks posed by counterfeit neon gas products.
Neon gas finds primary use in the electronics sector for semiconductors, in healthcare for medical lasers and imaging technologies, and in automotive for vehicle lighting applications.
The market is witnessing a shift towards energy-efficient lighting solutions, innovations in production technology, and an increased focus on neon gas applications in architectural design.
6Wresearch actively monitors the Egypt Neon Gas Market and publishes its comprehensive annual report, highlighting emerging trends, growth drivers, revenue analysis, and forecast outlook. Our insights help businesses to make data-backed strategic decisions with ongoing market dynamics. Our analysts track relevent industries related to the Egypt Neon Gas Market, allowing our clients with actionable intelligence and reliable forecasts tailored to emerging regional needs.
Yes, we provide customisation as per your requirements. To learn more, feel free to contact us on sales@6wresearch.com
1 Executive Summary |
2 Introduction |
2.1 Key Highlights of the Report |
2.2 Report Description |
2.3 Market Scope & Segmentation |
2.4 Research Methodology |
2.5 Assumptions |
3 Egypt Neon Gas Market Overview |
3.1 Egypt Country Macro Economic Indicators |
3.2 Egypt Neon Gas Market Revenues & Volume, 2022 & 2032F |
3.3 Egypt Neon Gas Market - Industry Life Cycle |
3.4 Egypt Neon Gas Market - Porter's Five Forces |
3.5 Egypt Neon Gas Market Revenues & Volume Share, By Type, 2022 & 2032F |
3.6 Egypt Neon Gas Market Revenues & Volume Share, By Form, 2022 & 2032F |
4 Egypt Neon Gas Market Dynamics |
4.1 Impact Analysis |
4.2 Market Drivers |
4.3 Market Restraints |
5 Egypt Neon Gas Market Trends |
6 Egypt Neon Gas Market, By Types |
6.1 Egypt Neon Gas Market, By Type |
6.1.1 Overview and Analysis |
6.1.2 Egypt Neon Gas Market Revenues & Volume, By Type, 2022-2032F |
6.1.3 Egypt Neon Gas Market Revenues & Volume, By Low, 2022-2032F |
6.1.4 Egypt Neon Gas Market Revenues & Volume, By High, 2022-2032F |
6.1.5 Egypt Neon Gas Market Revenues & Volume, By Ultra High, 2022-2032F |
6.2 Egypt Neon Gas Market, By Application |
6.2.1 Overview and Analysis |
6.2.2 Egypt Neon Gas Market Revenues & Volume, By Semiconductor, 2022-2032F |
6.2.3 Egypt Neon Gas Market Revenues & Volume, By LCD, 2022-2032F |
6.2.4 Egypt Neon Gas Market Revenues & Volume, By Imaging and Lighting, 2022-2032F |
6.2.5 Egypt Neon Gas Market Revenues & Volume, By Refrigerator, 2022-2032F |
6.2.6 Egypt Neon Gas Market Revenues & Volume, By Laser, 2022-2032F |
6.2.7 Egypt Neon Gas Market Revenues & Volume, By Medical, 2022-2032F |
7 Egypt Neon Gas Market Import-Export Trade Statistics |
7.1 Egypt Neon Gas Market Export to Major Countries |
7.2 Egypt Neon Gas Market Imports from Major Countries |
8 Egypt Neon Gas Market Key Performance Indicators |
9 Egypt Neon Gas Market - Opportunity Assessment |
9.1 Egypt Neon Gas Market Opportunity Assessment, By Type, 2022 & 2032F |
9.2 Egypt Neon Gas Market Opportunity Assessment, By Application, 2022 & 2032F |
10 Egypt Neon Gas Market - Competitive Landscape |
10.1 Egypt Neon Gas Market Revenue Share, By Companies, 2025 |
10.2 Egypt Neon Gas Market Competitive Benchmarking, By Operating and Technical Parameters |
11 Company Profiles |
12 Recommendations |
13 Disclaimer |
Global Go To Market Strategy - 2030
Export potential enables firms to identify high-growth global markets with greater confidence by combining advanced trade intelligence with a structured quantitative methodology. The framework analyzes emerging demand trends and country-level import patterns while integrating macroeconomic and trade datasets such as GDP and population forecasts, bilateral import–export flows, tariff structures, elasticity differentials between developed and developing economies, geographic distance, and import demand projections. Using weighted trade values from 2020–2024 as the base period to project country-to-country export potential for 2030, these inputs are operationalized through calculated drivers such as gravity model parameters, tariff impact factors, and projected GDP per-capita growth. Through an analysis of hidden potentials, demand hotspots, and market conditions that are most favorable to success, this method enables firms to focus on target countries, maximize returns, and global expansion with data, backed by accuracy.
By factoring in the projected importer demand gap that is currently unmet and could be potential opportunity, it identifies the potential for the Exporter (Country) among 190 countries, against the general trade analysis, which identifies the biggest importer or exporter.
To discover high-growth global markets and optimize your business strategy:
Click Here
Pricing
- Single User License$ 1,995
- Department License$ 2,400
- Site License$ 3,120
- Global License$ 3,795

Leadership Perspectives from Industry Events
Search
Thought Leadership and Analyst Meet


Our Clients
6WResearch In News
- India Air Conditioner Market Set for Strong Rebound in 2026 After Weather-Led Correction and GST-Driven Recovery: 6Wresearch
- ADAS in India: How Automatic Emergency Braking, Blind Spot Detection & Driver Monitoring are Transforming Road Safety
- Doha a strategic location for EV manufacturing hub: IPA Qatar
- Demand for luxury TVs surging in the GCC, says Samsung
- Empowering Growth: The Thriving Journey of Bangladesh’s Cable Industry
- Demand for luxury TVs surging in the GCC, says Samsung
Latest Reports
- Nicaragua RPG Gaming Market (2026-2032)
- New Zealand RPG Gaming Market (2026-2032)
- Netherlands RPG Gaming Market (2026-2032)
- Nauru RPG Gaming Market (2026-2032)
- Namibia RPG Gaming Market (2026-2032)
- Mozambique RPG Gaming Market (2026-2032)
- Montenegro RPG Gaming Market (2026-2032)
- Mongolia RPG Gaming Market (2026-2032)
- Monaco RPG Gaming Market (2026-2032)
- Micronesia RPG Gaming Market (2026-2032)
Industry Events and Analyst Meet

HIMTEX 2026

India Refining Summit 2026

India EV Show 2026

EV tech India Expo 2026

Auto Tech Asia 2026
Whitepaper
- Middle East & Africa Commercial Security Market Click here to view more.
- Middle East & Africa Fire Safety Systems & Equipment Market Click here to view more.
- GCC Drone Market Click here to view more.
- Middle East Lighting Fixture Market Click here to view more.
- GCC Physical & Perimeter Security Market Click here to view more.