El Salvador Control Valve Market (2025-2031) | Segmentation, Companies, Growth, Outlook, Revenue, Share, Size, Trends, Industry, Forecast, Value & Analysis
Market Forecast By Component (Actuators, Valve Body), By Type (Rotary , Linear), By Industry (Oil & Gas, Water & Wastewater Treatment, Energy & Power, Chemicals) And Competitive Landscape
| Product Code: ETC5911594 | Publication Date: Nov 2023 | Updated Date: Nov 2025 | Product Type: Market Research Report | |
| Publisher: 6Wresearch | Author: Summon Dutta | No. of Pages: 60 | No. of Figures: 30 | No. of Tables: 5 |
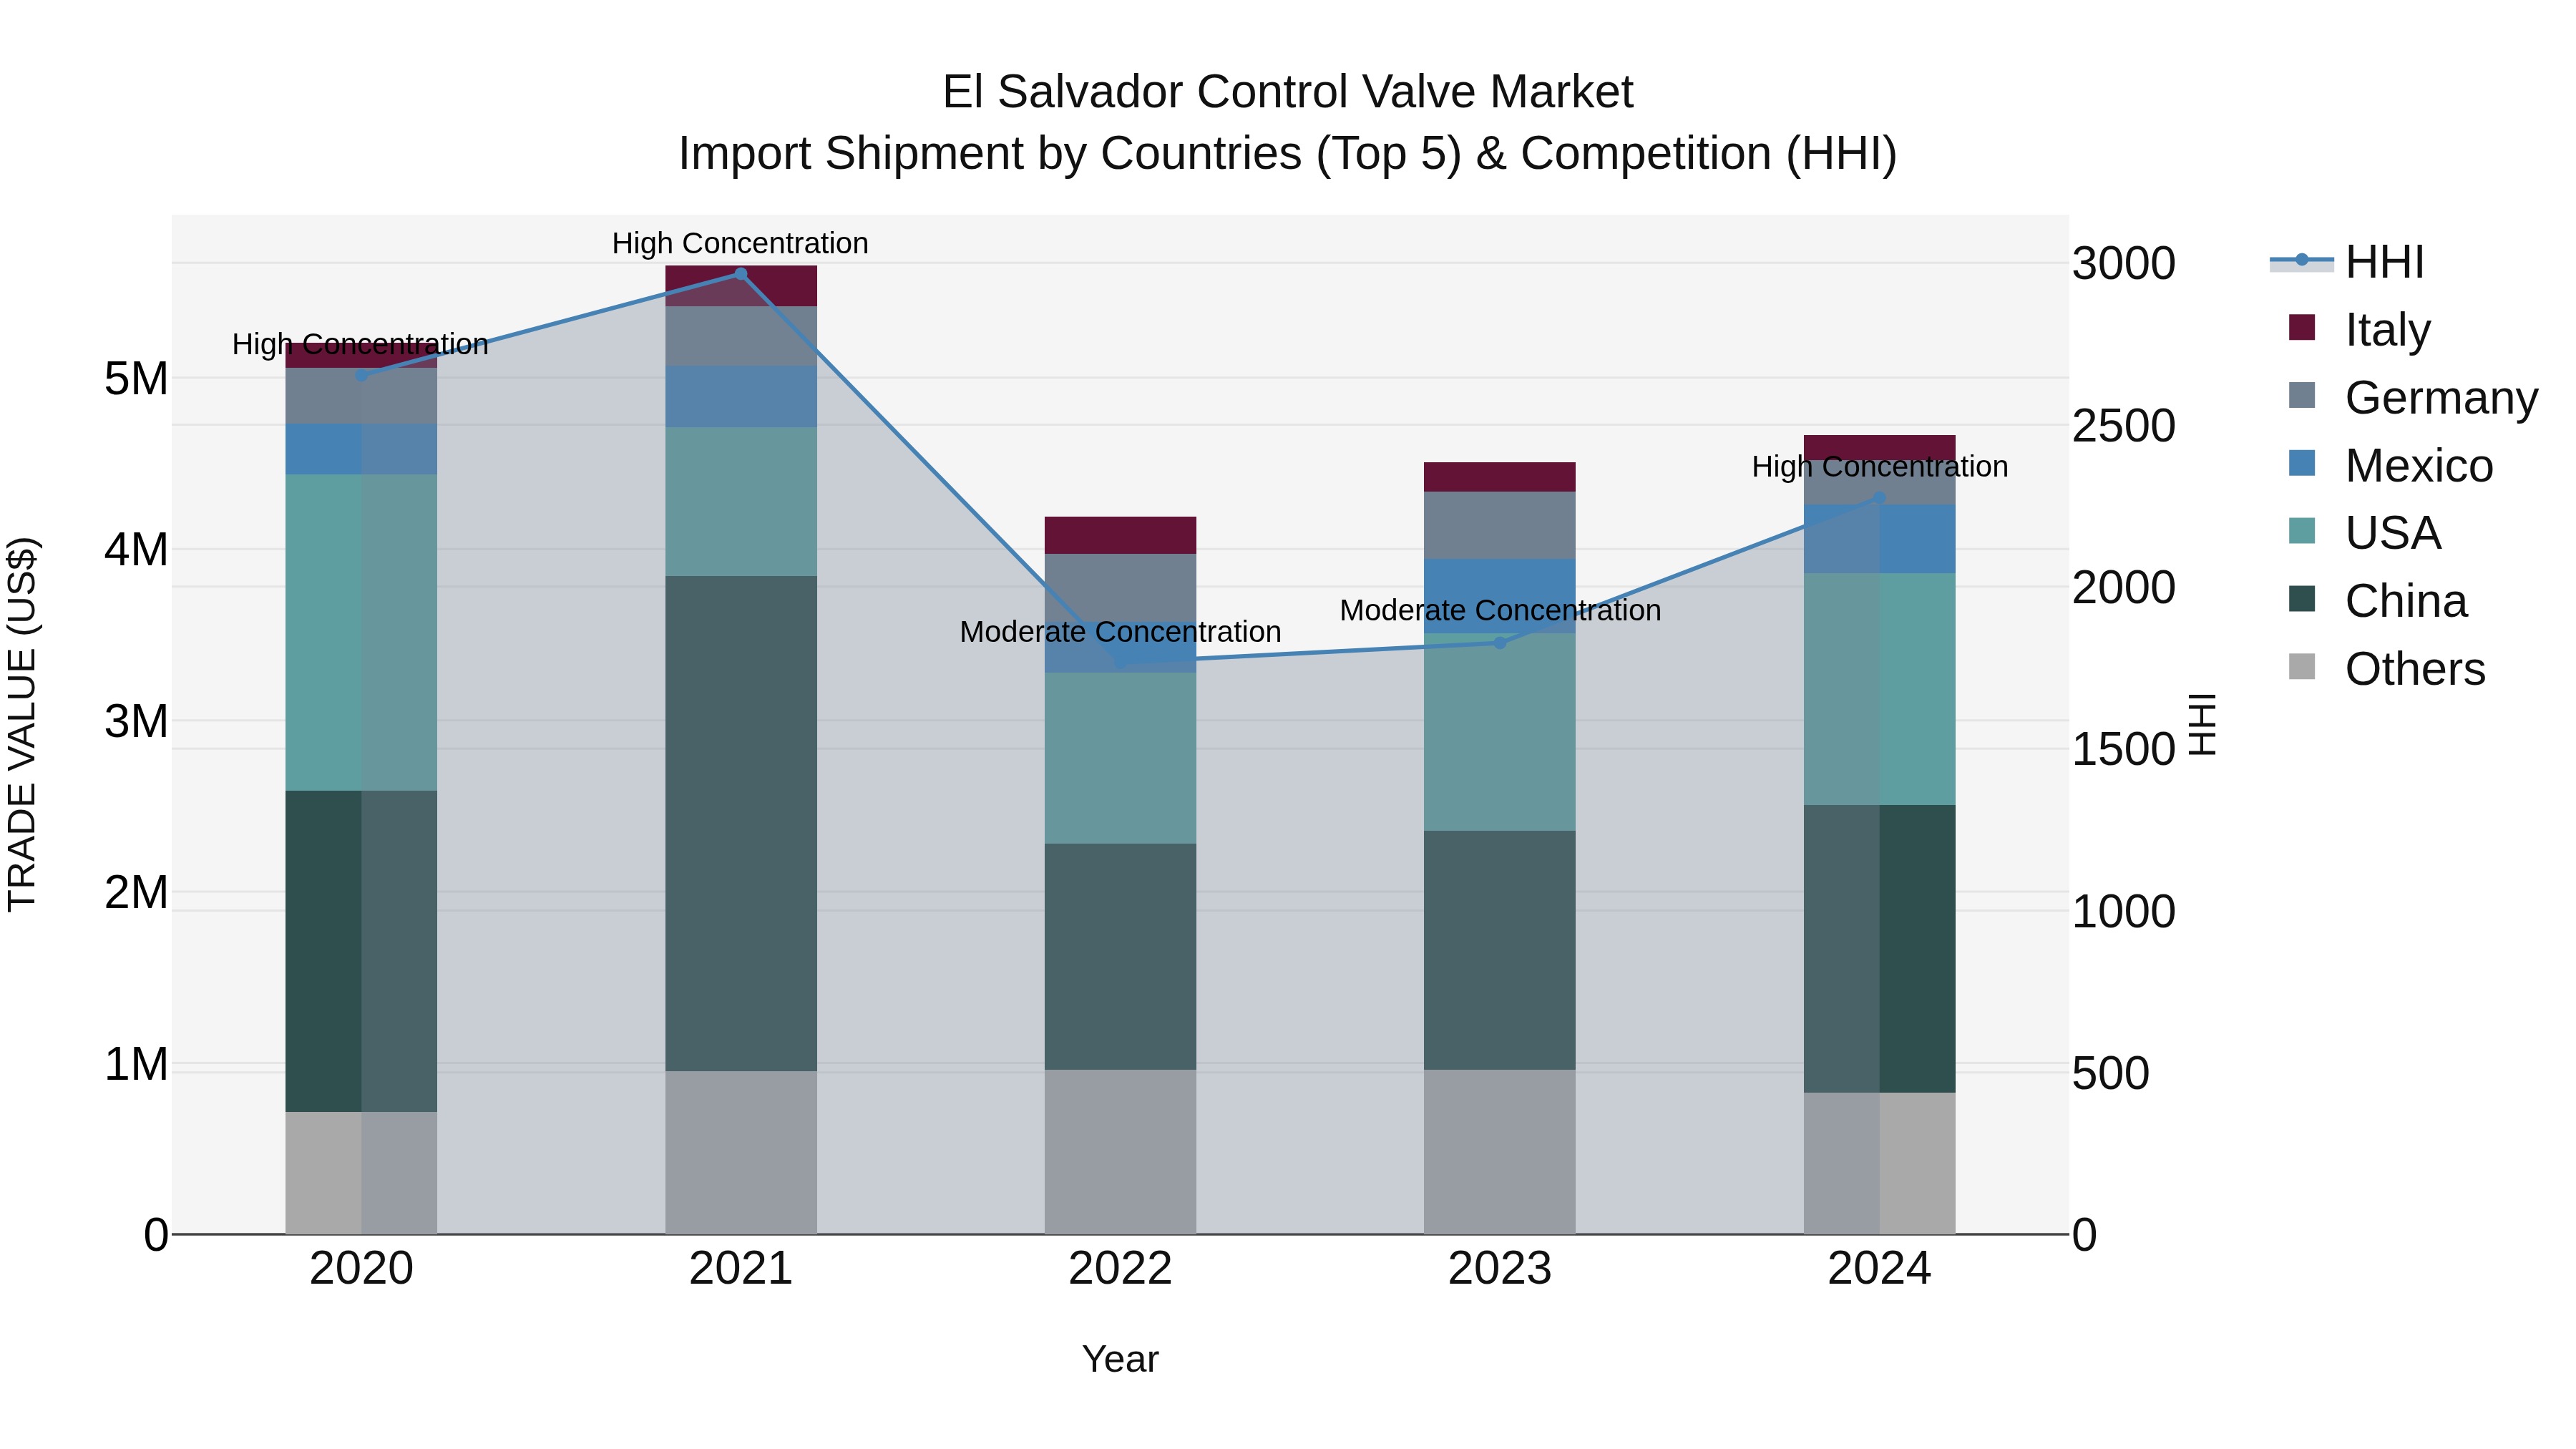
El Salvador Control Valve Market Top 5 Importing Countries and Market Competition (HHI) Analysis
The import shipments of control valves in El Salvador show a notable shift in concentration levels, with high concentration observed in 2024 compared to moderate concentration in the previous year. China, USA, Mexico, Germany, and Italy are the top countries exporting control valves to El Salvador in 2024. Despite a negative compound annual growth rate (CAGR) from 2020 to 2024, there was a positive growth rate of 3.54% from 2023 to 2024, indicating a potential rebound in the market for control valves in the country.
El Salvador Control Valve Market Overview
The control valve market in El Salvador is expanding, primarily driven by the growth in various industries such as oil and gas, chemicals, power generation, and water treatment. Control valves are crucial components in regulating fluid or gas flow within a system, ensuring efficient operations and maintaining safety standards. As industrial infrastructure continues to develop and modernize in El Salvador, there is an increasing demand for control valves in sectors like manufacturing, water distribution, and energy. Technological advancements in smart valves and automation are also likely to spur market growth, as industries seek more efficient and remote-controlled systems.
Drivers of the market
The control valve market in El Salvador is growing due to the increasing demand for automated and efficient control systems across various industries, including oil and gas, chemicals, and manufacturing. Control valves are essential for regulating the flow of liquids, gases, and steam in industrial processes, ensuring safety, efficiency, and compliance with environmental regulations. As the industrial sector in El Salvador modernizes and adopts more automated and energy-efficient technologies, the demand for control valves is increasing. Furthermore, the push towards sustainable industrial practices and the need for better resource management are driving the market for advanced control valves that can optimize energy use and reduce waste.
Challenges of the market
The Control Valve market in El Salvador is constrained by several factors, including the cost of imported products, limited local manufacturing capabilities, and the lack of skilled technicians. Since most control valves are imported, high import duties and shipping costs can significantly increase their final price, making them expensive for local industries. This is especially problematic for smaller companies that cannot afford high-quality valves from international suppliers. Additionally, there is a shortage of technical experts and service providers who can install, maintain, and repair these valves, which leads to a slower adoption rate of advanced control valve solutions in various sectors such as oil and gas, chemical processing, and power generation.
Government Policy of the market
In the control valve market, El Salvadors government focuses on safety, environmental protection, and quality control. Regulations ensure that valves used in various industrial applications comply with national and international standards. Policies may also support research and innovation in valve technologies that improve energy efficiency and reduce industrial emissions.
Key Highlights of the Report:
- El Salvador Control Valve Market Outlook
- Market Size of El Salvador Control Valve Market, 2024
- Forecast of El Salvador Control Valve Market, 2031
- Historical Data and Forecast of El Salvador Control Valve Revenues & Volume for the Period 2021-2031
- El Salvador Control Valve Market Trend Evolution
- El Salvador Control Valve Market Drivers and Challenges
- El Salvador Control Valve Price Trends
- El Salvador Control Valve Porter`s Five Forces
- El Salvador Control Valve Industry Life Cycle
- Historical Data and Forecast of El Salvador Control Valve Market Revenues & Volume By Component for the Period 2021-2031
- Historical Data and Forecast of El Salvador Control Valve Market Revenues & Volume By Actuators for the Period 2021-2031
- Historical Data and Forecast of El Salvador Control Valve Market Revenues & Volume By Valve Body for the Period 2021-2031
- Historical Data and Forecast of El Salvador Control Valve Market Revenues & Volume By Type for the Period 2021-2031
- Historical Data and Forecast of El Salvador Control Valve Market Revenues & Volume By Rotary for the Period 2021-2031
- Historical Data and Forecast of El Salvador Control Valve Market Revenues & Volume By Linear for the Period 2021-2031
- Historical Data and Forecast of El Salvador Control Valve Market Revenues & Volume By Industry for the Period 2021-2031
- Historical Data and Forecast of El Salvador Control Valve Market Revenues & Volume By Oil & Gas for the Period 2021-2031
- Historical Data and Forecast of El Salvador Control Valve Market Revenues & Volume By Water & Wastewater Treatment for the Period 2021-2031
- Historical Data and Forecast of El Salvador Control Valve Market Revenues & Volume By Energy & Power for the Period 2021-2031
- Historical Data and Forecast of El Salvador Control Valve Market Revenues & Volume By Chemicals for the Period 2021-2031
- El Salvador Control Valve Import Export Trade Statistics
- Market Opportunity Assessment By Component
- Market Opportunity Assessment By Type
- Market Opportunity Assessment By Industry
- El Salvador Control Valve Top Companies Market Share
- El Salvador Control Valve Competitive Benchmarking By Technical and Operational Parameters
- El Salvador Control Valve Company Profiles
- El Salvador Control Valve Key Strategic Recommendations
Frequently Asked Questions About the Market Study (FAQs):
6Wresearch actively monitors the El Salvador Control Valve Market and publishes its comprehensive annual report, highlighting emerging trends, growth drivers, revenue analysis, and forecast outlook. Our insights help businesses to make data-backed strategic decisions with ongoing market dynamics. Our analysts track relevent industries related to the El Salvador Control Valve Market, allowing our clients with actionable intelligence and reliable forecasts tailored to emerging regional needs.
Yes, we provide customisation as per your requirements. To learn more, feel free to contact us on sales@6wresearch.com
1 Executive Summary |
2 Introduction |
2.1 Key Highlights of the Report |
2.2 Report Description |
2.3 Market Scope & Segmentation |
2.4 Research Methodology |
2.5 Assumptions |
3 El Salvador Control Valve Market Overview |
3.1 El Salvador Country Macro Economic Indicators |
3.2 El Salvador Control Valve Market Revenues & Volume, 2021 & 2031F |
3.3 El Salvador Control Valve Market - Industry Life Cycle |
3.4 El Salvador Control Valve Market - Porter's Five Forces |
3.5 El Salvador Control Valve Market Revenues & Volume Share, By Component, 2021 & 2031F |
3.6 El Salvador Control Valve Market Revenues & Volume Share, By Type, 2021 & 2031F |
3.7 El Salvador Control Valve Market Revenues & Volume Share, By Industry, 2021 & 2031F |
4 El Salvador Control Valve Market Dynamics |
4.1 Impact Analysis |
4.2 Market Drivers |
4.2.1 Increasing industrialization and automation in El Salvador driving the demand for control valves. |
4.2.2 Government initiatives promoting infrastructure development leading to the growth of the control valve market. |
4.2.3 Growing focus on energy efficiency and sustainability pushing the adoption of control valves in various industries. |
4.3 Market Restraints |
4.3.1 Economic fluctuations and political instability impacting investment decisions in infrastructure projects. |
4.3.2 High initial costs associated with advanced control valve technologies limiting adoption rates. |
4.3.3 Lack of skilled workforce for the installation and maintenance of control valves hindering market growth. |
5 El Salvador Control Valve Market Trends |
6 El Salvador Control Valve Market Segmentations |
6.1 El Salvador Control Valve Market, By Component |
6.1.1 Overview and Analysis |
6.1.2 El Salvador Control Valve Market Revenues & Volume, By Actuators, 2021-2031F |
6.1.3 El Salvador Control Valve Market Revenues & Volume, By Valve Body, 2021-2031F |
6.2 El Salvador Control Valve Market, By Type |
6.2.1 Overview and Analysis |
6.2.2 El Salvador Control Valve Market Revenues & Volume, By Rotary , 2021-2031F |
6.2.3 El Salvador Control Valve Market Revenues & Volume, By Linear, 2021-2031F |
6.3 El Salvador Control Valve Market, By Industry |
6.3.1 Overview and Analysis |
6.3.2 El Salvador Control Valve Market Revenues & Volume, By Oil & Gas, 2021-2031F |
6.3.3 El Salvador Control Valve Market Revenues & Volume, By Water & Wastewater Treatment, 2021-2031F |
6.3.4 El Salvador Control Valve Market Revenues & Volume, By Energy & Power, 2021-2031F |
6.3.5 El Salvador Control Valve Market Revenues & Volume, By Chemicals, 2021-2031F |
7 El Salvador Control Valve Market Import-Export Trade Statistics |
7.1 El Salvador Control Valve Market Export to Major Countries |
7.2 El Salvador Control Valve Market Imports from Major Countries |
8 El Salvador Control Valve Market Key Performance Indicators |
8.1 Energy savings achieved through the use of control valves. |
8.2 Number of infrastructure projects in El Salvador utilizing control valves. |
8.3 Adoption rate of smart control valve technologies in key industries. |
8.4 Percentage increase in the use of control valves in industrial automation processes. |
8.5 Number of training programs conducted for enhancing workforce skills in control valve installation and maintenance. |
9 El Salvador Control Valve Market - Opportunity Assessment |
9.1 El Salvador Control Valve Market Opportunity Assessment, By Component, 2021 & 2031F |
9.2 El Salvador Control Valve Market Opportunity Assessment, By Type, 2021 & 2031F |
9.3 El Salvador Control Valve Market Opportunity Assessment, By Industry, 2021 & 2031F |
10 El Salvador Control Valve Market - Competitive Landscape |
10.1 El Salvador Control Valve Market Revenue Share, By Companies, 2024 |
10.2 El Salvador Control Valve Market Competitive Benchmarking, By Operating and Technical Parameters |
11 Company Profiles |
12 Recommendations | 13 Disclaimer |
Export potential assessment - trade Analytics for 2030
Export potential enables firms to identify high-growth global markets with greater confidence by combining advanced trade intelligence with a structured quantitative methodology. The framework analyzes emerging demand trends and country-level import patterns while integrating macroeconomic and trade datasets such as GDP and population forecasts, bilateral import–export flows, tariff structures, elasticity differentials between developed and developing economies, geographic distance, and import demand projections. Using weighted trade values from 2020–2024 as the base period to project country-to-country export potential for 2030, these inputs are operationalized through calculated drivers such as gravity model parameters, tariff impact factors, and projected GDP per-capita growth. Through an analysis of hidden potentials, demand hotspots, and market conditions that are most favorable to success, this method enables firms to focus on target countries, maximize returns, and global expansion with data, backed by accuracy.
By factoring in the projected importer demand gap that is currently unmet and could be potential opportunity, it identifies the potential for the Exporter (Country) among 190 countries, against the general trade analysis, which identifies the biggest importer or exporter.
To discover high-growth global markets and optimize your business strategy:
Click Here
Pricing
- Single User License$ 1,995
- Department License$ 2,400
- Site License$ 3,120
- Global License$ 3,795

Search
Thought Leadership and Analyst Meet


Our Clients
Latest Reports
- United Kingdom (UK) Long-term Care Insurance Market (2026-2032) | Growth, Share, Consumer Insights, Drivers, Opportunities, Competition, Pricing Analysis, Segments, Restraints, Companies, Competitive, Value, Outlook, Size, Demand, Analysis, Challenges, Strategic Insights, Investment Trends, Revenue, Trends, Supply, Forecast
- United Kingdom (UK) Long Term Care Market (2026-2032) | Companies, Outlook, Analysis, Trends, Value, Revenue, Segmentation, Share, Forecast, Competitive Landscape, Growth, Size & Forecast
- Iraq Insulation and Waterproofing Market (2026-2032) | Outlook, Drivers, Growth, Size, Share, Industry, Revenue, Trends, Demand, Competitive, Strategic Insights, Opportunities, Segments, Companies, Challenges, Strategy, Consumer Insights, Analysis, Investment Trends, Value, Segmentation, Forecast, Restraints
- India Switchgear Market Outlook (2026 - 2032) | Size, Share, Trends, Growth, Revenue, Forecast, Analysis, Value, Outlook
- Pakistan Contraceptive Implants Market (2025-2031) | Demand, Growth, Size, Share, Industry, Pricing Analysis, Competitive, Strategic Insights, Strategy, Consumer Insights, Analysis, Investment Trends, Opportunities, Revenue, Segments, Value, Segmentation, Supply, Forecast, Restraints, Outlook, Competition, Drivers, Trends, Companies, Challenges
- Sri Lanka Packaging Market (2026-2032) | Outlook, Competition, Drivers, Trends, Demand, Pricing Analysis, Competitive, Strategic Insights, Companies, Challenges, Strategy, Consumer Insights, Analysis, Investment Trends, Opportunities, Growth, Size, Share, Industry, Revenue, Segments, Value, Segmentation, Supply, Forecast, Restraints
- India Kids Watches Market (2026-2032) | Strategy, Consumer Insights, Analysis, Investment Trends, Opportunities, Growth, Size, Share, Industry, Revenue, Segments, Value, Segmentation, Supply, Forecast, Restraints, Outlook, Competition, Drivers, Trends, Demand, Pricing Analysis, Competitive, Strategic Insights, Companies, Challenges
- Saudi Arabia Core Assurance Service Market (2025-2031) | Strategy, Consumer Insights, Analysis, Investment Trends, Opportunities, Growth, Size, Share, Industry, Revenue, Segments, Value, Segmentation, Supply, Forecast, Restraints, Outlook, Competition, Drivers, Trends, Demand, Pricing Analysis, Competitive, Strategic Insights, Companies, Challenges
- Romania Uninterruptible Power Supply (UPS) Market (2026-2032) | Industry, Analysis, Revenue, Size, Forecast, Outlook, Value, Trends, Share, Growth & Companies
- Saudi Arabia Car Window Tinting Film, Paint Protection Film (PPF), and Ceramic Coating Market (2025-2031) | Strategy, Consumer Insights, Analysis, Investment Trends, Opportunities, Growth, Size, Share, Industry, Revenue, Segments, Value, Segmentation, Supply, Forecast, Restraints, Outlook, Competition, Drivers, Trends, Demand, Pricing Analysis, Competitive, Strategic Insights, Companies, Challenges
Industry Events and Analyst Meet

India EV Show 2026

EV tech India Expo 2026

Auto Tech Asia 2026

Battery Tech India 2026

Smart Production Solutions Guangzhou 2026
Whitepaper
- Middle East & Africa Commercial Security Market Click here to view more.
- Middle East & Africa Fire Safety Systems & Equipment Market Click here to view more.
- GCC Drone Market Click here to view more.
- Middle East Lighting Fixture Market Click here to view more.
- GCC Physical & Perimeter Security Market Click here to view more.
6WResearch In News
- Doha a strategic location for EV manufacturing hub: IPA Qatar
- Demand for luxury TVs surging in the GCC, says Samsung
- Empowering Growth: The Thriving Journey of Bangladesh’s Cable Industry
- Demand for luxury TVs surging in the GCC, says Samsung
- Video call with a traditional healer? Once unthinkable, it’s now common in South Africa
- Intelligent Buildings To Smooth GCC’s Path To Net Zero