Estonia Balsamic Vinegar Market (2026-2032) | Companies, Value, Competitive Landscape, Analysis, Outlook, Growth, Share, Industry, Trends, Size & Revenue, Segmentation, Forecast
Market Forecast By Product Type (Dark Balsamic Vinegars, White Balsamic Vinegars), By Flavor (Dark Balsamic Vinegar, White Balsamic Vinegar), By Grade (Traditional Grade Balsamic Vinegar, Commercial Grade Balsamic Vinegar, Condiment Grade Balsamic Vinegar), By Category (Organic, Conventional), By Type of Wood for Aging (Oak, Chestnut, Mulberry, Others), By Ageing (Aged, Semi-Aged, Matured), By Applications (Salad Dressings, Desserts, Cheese, Soups, Lemonade, Meat Products, Others), By Distribution Channel (Store-Based Retailing, Non-Store Retailing) And Competitive Landscape
| Product Code: ETC7127111 | Publication Date: Sep 2024 | Updated Date: Apr 2026 | Product Type: Market Research Report | |
| Publisher: 6Wresearch | Author: Summon Dutta | No. of Pages: 75 | No. of Figures: 35 | No. of Tables: 20 |
Estonia Balsamic Vinegar Market Size (2020-2030)
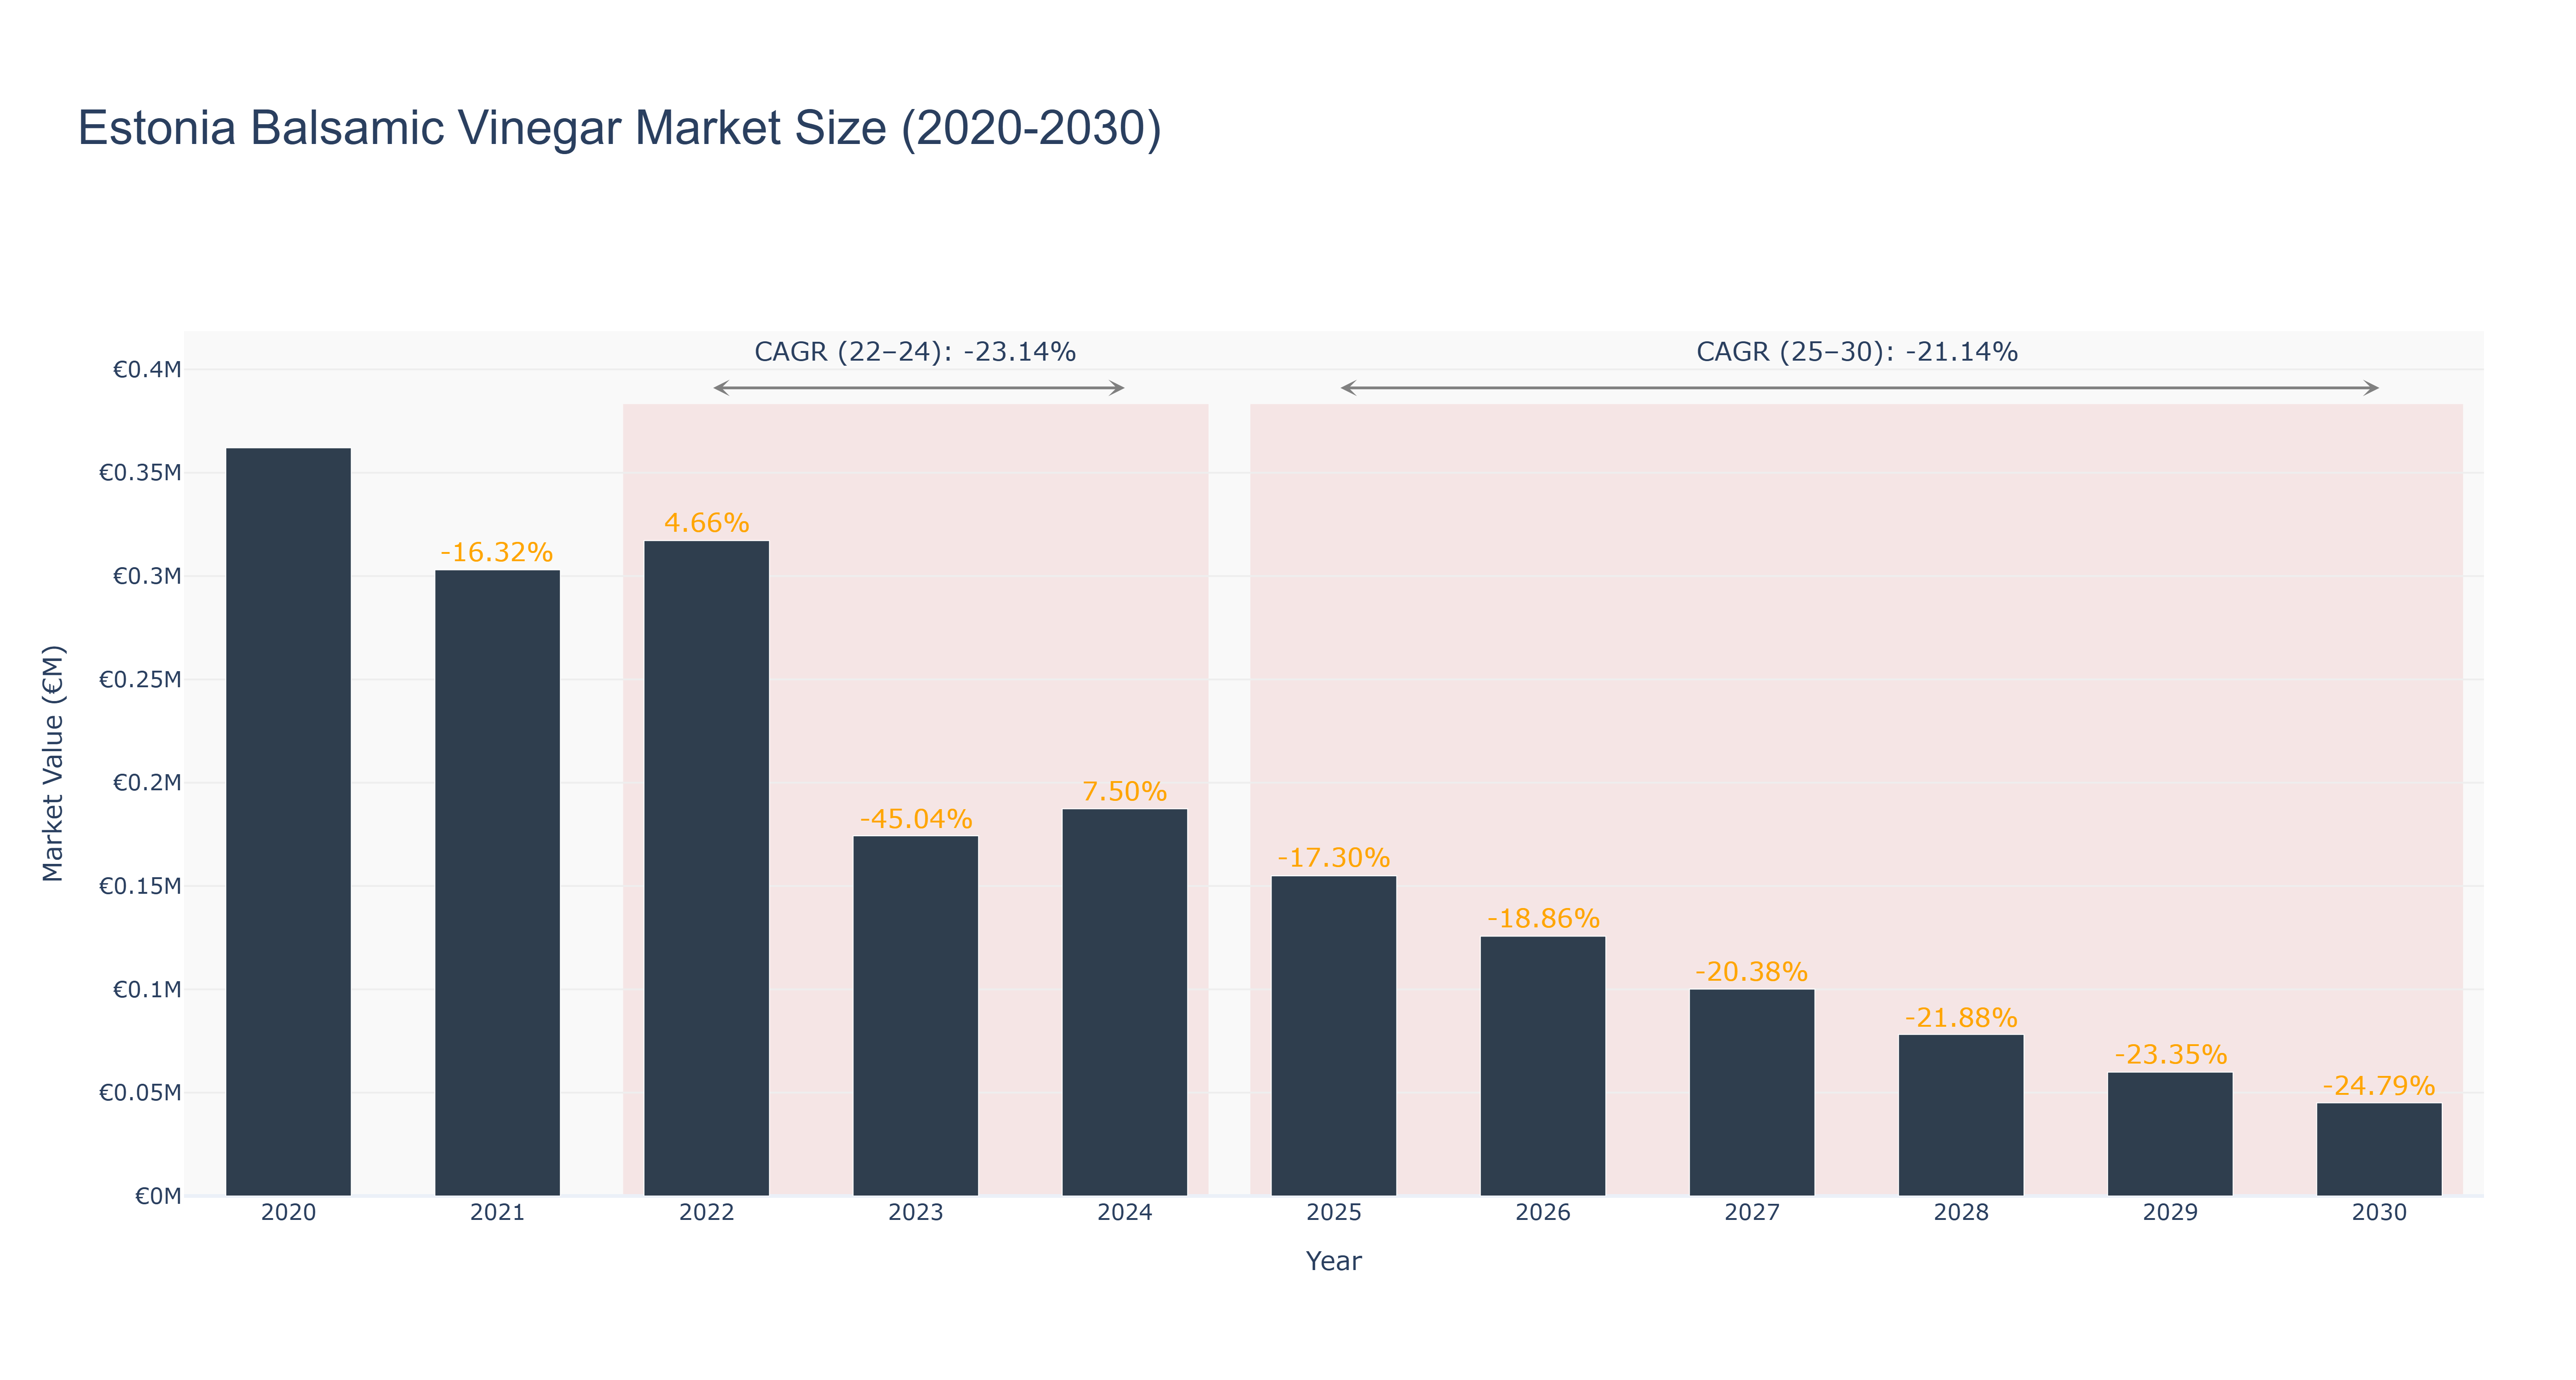
The Estonia Balsamic Vinegar Market experienced a peak market size of €0.36 million in 2020, followed by a gradual decline in subsequent years. The actual market size decreased to €0.19 million in 2024, with intermittent fluctuations. Forecasted market size is expected to further decrease to €0.05 million by 2030. The CAGR for the period 2022-24 was -23.14%, while for 2025-30, it is projected to be -21.14%. The downward trend can be attributed to shifting consumer preferences towards healthier alternatives and increased competition in the market. To counter this, Estonia is planning to introduce a marketing campaign promoting the unique quality of its balsamic vinegar products in international markets, aiming to boost exports and revitalize the industry. This initiative aligns with the growing global demand for premium and organic food products, positioning Estonia to capitalize on emerging opportunities in the gourmet food sector.
Estonia Balsamic Vinegar Market: Production & Trade Performance (2019-2025)
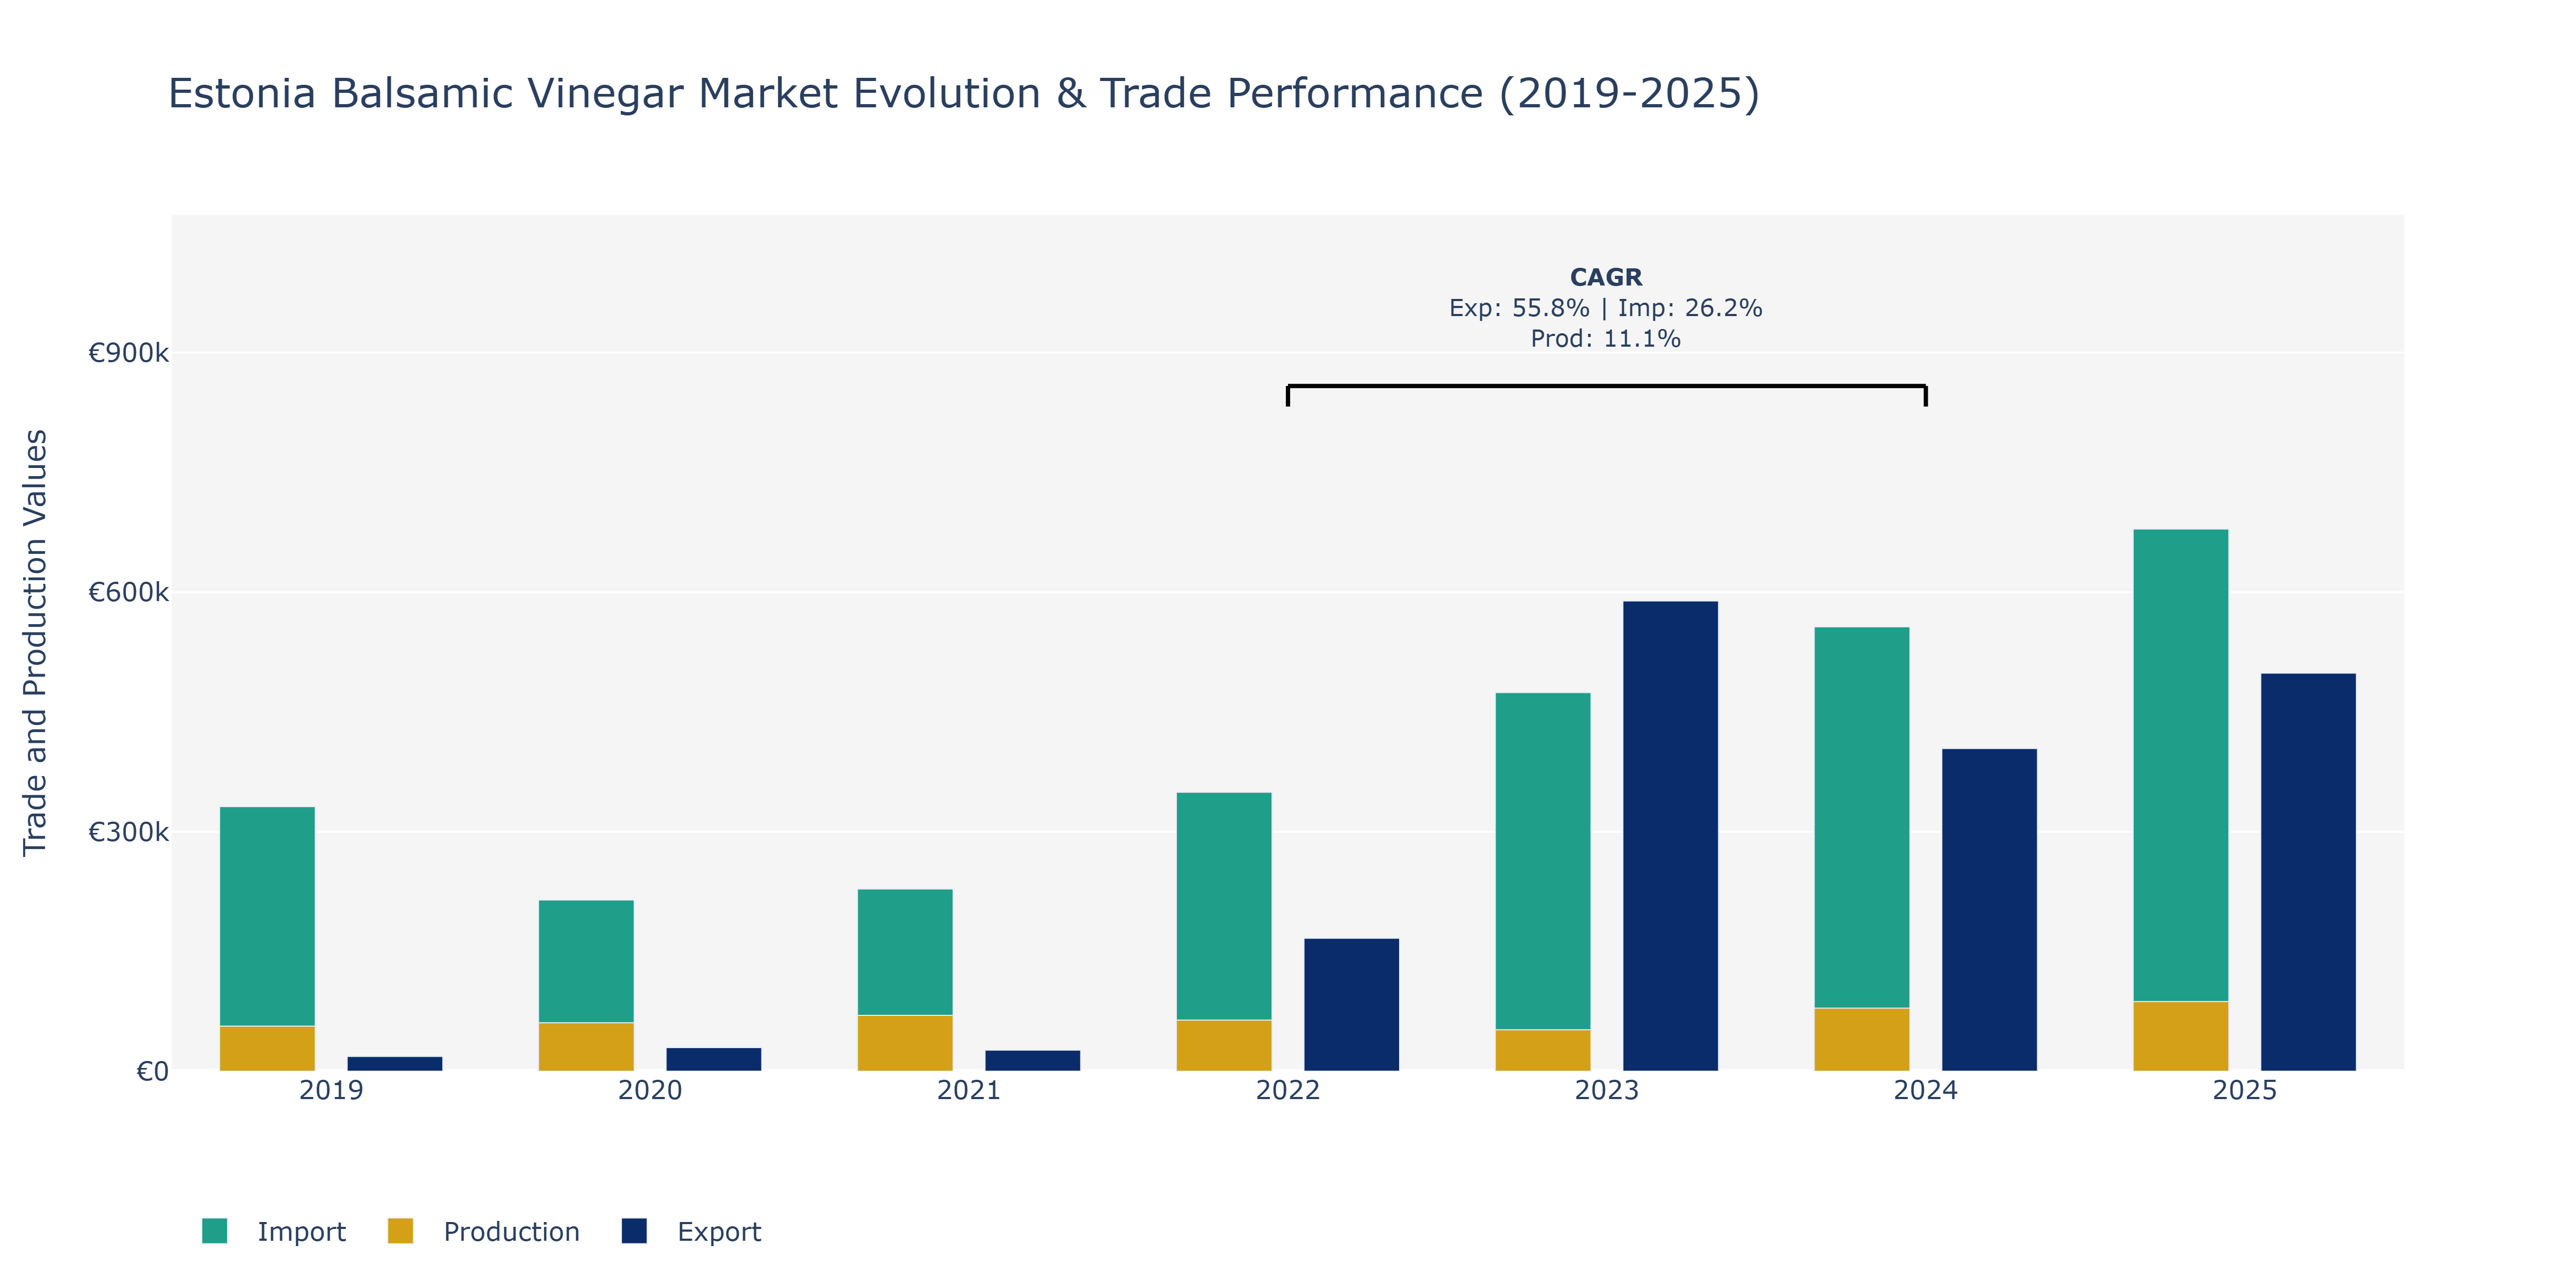
In the Estonia Balsamic Vinegar Market, exports saw a notable fluctuation from 2019 to 2025, starting at €18.51 thousand, peaking at €589.18 thousand in 2023, and settling at €498.71 thousand in 2025. This growth can be attributed to increasing global demand for high-quality balsamic vinegar. Imports followed a fluctuating trend, starting at €331.47 thousand, decreasing to €214.43 thousand in 2020, and gradually rising to €679.26 thousand in 2025. Such fluctuations could be influenced by changes in international trade agreements and shifts in consumer preferences. Production levels remained relatively stable, ranging from €52.00 thousand in 2023 to €87.18 thousand in 2025, with a notable peak in 2024 at €79.00 thousand. This growth aligns with the market's focus on enhancing production efficiency and product quality. The market's performance reflects a balance between domestic production capacity, import volumes, and export competitiveness in the global balsamic vinegar industry.
Key Highlights of the Report:
- Estonia Balsamic Vinegar Market Outlook
- Market Size of Estonia Balsamic Vinegar Market, 2025
- Forecast of Estonia Balsamic Vinegar Market, 2032
- Historical Data and Forecast of Estonia Balsamic Vinegar Revenues & Volume for the Period 2022 - 2032
- Estonia Balsamic Vinegar Market Trend Evolution
- Estonia Balsamic Vinegar Market Drivers and Challenges
- Estonia Balsamic Vinegar Price Trends
- Estonia Balsamic Vinegar Porter's Five Forces
- Estonia Balsamic Vinegar Industry Life Cycle
- Historical Data and Forecast of Estonia Balsamic Vinegar Market Revenues & Volume By Product Type for the Period 2022 - 2032
- Historical Data and Forecast of Estonia Balsamic Vinegar Market Revenues & Volume By Dark Balsamic Vinegars for the Period 2022 - 2032
- Historical Data and Forecast of Estonia Balsamic Vinegar Market Revenues & Volume By White Balsamic Vinegars for the Period 2022 - 2032
- Historical Data and Forecast of Estonia Balsamic Vinegar Market Revenues & Volume By Flavor for the Period 2022 - 2032
- Historical Data and Forecast of Estonia Balsamic Vinegar Market Revenues & Volume By Dark Balsamic Vinegar for the Period 2022 - 2032
- Historical Data and Forecast of Estonia Balsamic Vinegar Market Revenues & Volume By White Balsamic Vinegar for the Period 2022 - 2032
- Historical Data and Forecast of Estonia Balsamic Vinegar Market Revenues & Volume By Grade for the Period 2022 - 2032
- Historical Data and Forecast of Estonia Balsamic Vinegar Market Revenues & Volume By Traditional Grade Balsamic Vinegar for the Period 2022 - 2032
- Historical Data and Forecast of Estonia Balsamic Vinegar Market Revenues & Volume By Commercial Grade Balsamic Vinegar for the Period 2022 - 2032
- Historical Data and Forecast of Estonia Balsamic Vinegar Market Revenues & Volume By Condiment Grade Balsamic Vinegar for the Period 2022 - 2032
- Historical Data and Forecast of Estonia Balsamic Vinegar Market Revenues & Volume By Category for the Period 2022 - 2032
- Historical Data and Forecast of Estonia Balsamic Vinegar Market Revenues & Volume By Organic for the Period 2022 - 2032
- Historical Data and Forecast of Estonia Balsamic Vinegar Market Revenues & Volume By Conventional for the Period 2022 - 2032
- Historical Data and Forecast of Estonia Balsamic Vinegar Market Revenues & Volume By Type of Wood for Aging for the Period 2022 - 2032
- Historical Data and Forecast of Estonia Balsamic Vinegar Market Revenues & Volume By Oak for the Period 2022 - 2032
- Historical Data and Forecast of Estonia Balsamic Vinegar Market Revenues & Volume By Chestnut for the Period 2022 - 2032
- Historical Data and Forecast of Estonia Balsamic Vinegar Market Revenues & Volume By Mulberry for the Period 2022 - 2032
- Historical Data and Forecast of Estonia Balsamic Vinegar Market Revenues & Volume By Others for the Period 2022 - 2032
- Historical Data and Forecast of Estonia Balsamic Vinegar Market Revenues & Volume By Ageing for the Period 2022 - 2032
- Historical Data and Forecast of Estonia Balsamic Vinegar Market Revenues & Volume By Aged for the Period 2022 - 2032
- Historical Data and Forecast of Estonia Balsamic Vinegar Market Revenues & Volume By Semi-Aged for the Period 2022 - 2032
- Historical Data and Forecast of Estonia Balsamic Vinegar Market Revenues & Volume By Matured for the Period 2022 - 2032
- Historical Data and Forecast of Estonia Balsamic Vinegar Market Revenues & Volume By Applications for the Period 2022 - 2032
- Historical Data and Forecast of Estonia Balsamic Vinegar Market Revenues & Volume By Salad Dressings for the Period 2022 - 2032
- Historical Data and Forecast of Estonia Balsamic Vinegar Market Revenues & Volume By Desserts for the Period 2022 - 2032
- Historical Data and Forecast of Estonia Balsamic Vinegar Market Revenues & Volume By Cheese for the Period 2022 - 2032
- Historical Data and Forecast of Estonia Balsamic Vinegar Market Revenues & Volume By Soups for the Period 2022 - 2032
- Historical Data and Forecast of Estonia Balsamic Vinegar Market Revenues & Volume By Lemonade for the Period 2022 - 2032
- Historical Data and Forecast of Estonia Balsamic Vinegar Market Revenues & Volume By Meat Products for the Period 2022 - 2032
- Historical Data and Forecast of Estonia Balsamic Vinegar Market Revenues & Volume By Others for the Period 2022 - 2032
- Historical Data and Forecast of Estonia Balsamic Vinegar Market Revenues & Volume By Distribution Channel for the Period 2022 - 2032
- Historical Data and Forecast of Estonia Balsamic Vinegar Market Revenues & Volume By Store-Based Retailing for the Period 2022 - 2032
- Historical Data and Forecast of Estonia Balsamic Vinegar Market Revenues & Volume By Non-Store Retailing for the Period 2022 - 2032
- Estonia Balsamic Vinegar Import Export Trade Statistics
- Market Opportunity Assessment By Product Type
- Market Opportunity Assessment By Flavor
- Market Opportunity Assessment By Grade
- Market Opportunity Assessment By Category
- Market Opportunity Assessment By Type of Wood for Aging
- Market Opportunity Assessment By Ageing
- Market Opportunity Assessment By Applications
- Market Opportunity Assessment By Distribution Channel
- Estonia Balsamic Vinegar Top Companies Market Share
- Estonia Balsamic Vinegar Competitive Benchmarking By Technical and Operational Parameters
- Estonia Balsamic Vinegar Company Profiles
- Estonia Balsamic Vinegar Key Strategic Recommendations
Frequently Asked Questions About the Market Study (FAQs):
6Wresearch actively monitors the Estonia Balsamic Vinegar Market and publishes its comprehensive annual report, highlighting emerging trends, growth drivers, revenue analysis, and forecast outlook. Our insights help businesses to make data-backed strategic decisions with ongoing market dynamics. Our analysts track relevent industries related to the Estonia Balsamic Vinegar Market, allowing our clients with actionable intelligence and reliable forecasts tailored to emerging regional needs.
Yes, we provide customisation as per your requirements. To learn more, feel free to contact us on sales@6wresearch.com
1 Executive Summary |
2 Introduction |
2.1 Key Highlights of the Report |
2.2 Report Description |
2.3 Market Scope & Segmentation |
2.4 Research Methodology |
2.5 Assumptions |
3 Estonia Balsamic Vinegar Market Overview |
3.1 Estonia Country Macro Economic Indicators |
3.2 Estonia Balsamic Vinegar Market Revenues & Volume, 2022 & 2032F |
3.3 Estonia Balsamic Vinegar Market - Industry Life Cycle |
3.4 Estonia Balsamic Vinegar Market - Porter's Five Forces |
3.5 Estonia Balsamic Vinegar Market Revenues & Volume Share, By Product Type, 2022 & 2032F |
3.6 Estonia Balsamic Vinegar Market Revenues & Volume Share, By Flavor, 2022 & 2032F |
3.7 Estonia Balsamic Vinegar Market Revenues & Volume Share, By Grade, 2022 & 2032F |
3.8 Estonia Balsamic Vinegar Market Revenues & Volume Share, By Category, 2022 & 2032F |
3.9 Estonia Balsamic Vinegar Market Revenues & Volume Share, By Type of Wood for Aging, 2022 & 2032F |
3.10 Estonia Balsamic Vinegar Market Revenues & Volume Share, By Ageing, 2022 & 2032F |
3.11 Estonia Balsamic Vinegar Market Revenues & Volume Share, By Applications, 2022 & 2032F |
4 Estonia Balsamic Vinegar Market Dynamics |
4.1 Impact Analysis |
4.2 Market Drivers |
4.3 Market Restraints |
5 Estonia Balsamic Vinegar Market Trends |
6 Estonia Balsamic Vinegar Market, By Types |
6.1 Estonia Balsamic Vinegar Market, By Product Type |
6.1.1 Overview and Analysis |
6.1.2 Estonia Balsamic Vinegar Market Revenues & Volume, By Product Type, 2022 - 2032F |
6.1.3 Estonia Balsamic Vinegar Market Revenues & Volume, By Dark Balsamic Vinegars, 2022 - 2032F |
6.1.4 Estonia Balsamic Vinegar Market Revenues & Volume, By White Balsamic Vinegars, 2022 - 2032F |
6.2 Estonia Balsamic Vinegar Market, By Flavor |
6.2.1 Overview and Analysis |
6.2.2 Estonia Balsamic Vinegar Market Revenues & Volume, By Dark Balsamic Vinegar, 2022 - 2032F |
6.2.3 Estonia Balsamic Vinegar Market Revenues & Volume, By White Balsamic Vinegar, 2022 - 2032F |
6.3 Estonia Balsamic Vinegar Market, By Grade |
6.3.1 Overview and Analysis |
6.3.2 Estonia Balsamic Vinegar Market Revenues & Volume, By Traditional Grade Balsamic Vinegar, 2022 - 2032F |
6.3.3 Estonia Balsamic Vinegar Market Revenues & Volume, By Commercial Grade Balsamic Vinegar, 2022 - 2032F |
6.3.4 Estonia Balsamic Vinegar Market Revenues & Volume, By Condiment Grade Balsamic Vinegar, 2022 - 2032F |
6.4 Estonia Balsamic Vinegar Market, By Category |
6.4.1 Overview and Analysis |
6.4.2 Estonia Balsamic Vinegar Market Revenues & Volume, By Organic, 2022 - 2032F |
6.4.3 Estonia Balsamic Vinegar Market Revenues & Volume, By Conventional, 2022 - 2032F |
6.5 Estonia Balsamic Vinegar Market, By Type of Wood for Aging |
6.5.1 Overview and Analysis |
6.5.2 Estonia Balsamic Vinegar Market Revenues & Volume, By Oak, 2022 - 2032F |
6.5.3 Estonia Balsamic Vinegar Market Revenues & Volume, By Chestnut, 2022 - 2032F |
6.5.4 Estonia Balsamic Vinegar Market Revenues & Volume, By Mulberry, 2022 - 2032F |
6.5.5 Estonia Balsamic Vinegar Market Revenues & Volume, By Others, 2022 - 2032F |
6.6 Estonia Balsamic Vinegar Market, By Ageing |
6.6.1 Overview and Analysis |
6.6.2 Estonia Balsamic Vinegar Market Revenues & Volume, By Aged, 2022 - 2032F |
6.6.3 Estonia Balsamic Vinegar Market Revenues & Volume, By Semi-Aged, 2022 - 2032F |
6.6.4 Estonia Balsamic Vinegar Market Revenues & Volume, By Matured, 2022 - 2032F |
6.7 Estonia Balsamic Vinegar Market, By Applications |
6.7.1 Overview and Analysis |
6.7.2 Estonia Balsamic Vinegar Market Revenues & Volume, By Salad Dressings, 2022 - 2032F |
6.7.3 Estonia Balsamic Vinegar Market Revenues & Volume, By Desserts, 2022 - 2032F |
6.7.4 Estonia Balsamic Vinegar Market Revenues & Volume, By Soups, 2022 - 2032F |
6.7.5 Estonia Balsamic Vinegar Market Revenues & Volume, By Soups, 2022 - 2032F |
6.7.6 Estonia Balsamic Vinegar Market Revenues & Volume, By Lemonade, 2022 - 2032F |
6.7.7 Estonia Balsamic Vinegar Market Revenues & Volume, By Meat Products, 2022 - 2032F |
6.8 Estonia Balsamic Vinegar Market, By Distribution Channel |
6.8.1 Overview and Analysis |
6.8.2 Estonia Balsamic Vinegar Market Revenues & Volume, By Store-Based Retailing, 2022 - 2032F |
6.8.3 Estonia Balsamic Vinegar Market Revenues & Volume, By Non-Store Retailing, 2022 - 2032F |
7 Estonia Balsamic Vinegar Market Import-Export Trade Statistics |
7.1 Estonia Balsamic Vinegar Market Export to Major Countries |
7.2 Estonia Balsamic Vinegar Market Imports from Major Countries |
8 Estonia Balsamic Vinegar Market Key Performance Indicators |
9 Estonia Balsamic Vinegar Market - Opportunity Assessment |
9.1 Estonia Balsamic Vinegar Market Opportunity Assessment, By Product Type, 2022 & 2032F |
9.2 Estonia Balsamic Vinegar Market Opportunity Assessment, By Flavor, 2022 & 2032F |
9.3 Estonia Balsamic Vinegar Market Opportunity Assessment, By Grade, 2022 & 2032F |
9.4 Estonia Balsamic Vinegar Market Opportunity Assessment, By Category, 2022 & 2032F |
9.5 Estonia Balsamic Vinegar Market Opportunity Assessment, By Type of Wood for Aging, 2022 & 2032F |
9.6 Estonia Balsamic Vinegar Market Opportunity Assessment, By Ageing, 2022 & 2032F |
9.7 Estonia Balsamic Vinegar Market Opportunity Assessment, By Applications, 2022 & 2032F |
9.7 Estonia Balsamic Vinegar Market Opportunity Assessment, By Distribution Channel, 2022 & 2032F |
10 Estonia Balsamic Vinegar Market - Competitive Landscape |
10.1 Estonia Balsamic Vinegar Market Revenue Share, By Companies, 2025 |
10.2 Estonia Balsamic Vinegar Market Competitive Benchmarking, By Operating and Technical Parameters |
11 Company Profiles |
12 Recommendations |
13 Disclaimer |
Export potential assessment - trade Analytics for 2030
Export potential enables firms to identify high-growth global markets with greater confidence by combining advanced trade intelligence with a structured quantitative methodology. The framework analyzes emerging demand trends and country-level import patterns while integrating macroeconomic and trade datasets such as GDP and population forecasts, bilateral import–export flows, tariff structures, elasticity differentials between developed and developing economies, geographic distance, and import demand projections. Using weighted trade values from 2020–2024 as the base period to project country-to-country export potential for 2030, these inputs are operationalized through calculated drivers such as gravity model parameters, tariff impact factors, and projected GDP per-capita growth. Through an analysis of hidden potentials, demand hotspots, and market conditions that are most favorable to success, this method enables firms to focus on target countries, maximize returns, and global expansion with data, backed by accuracy.
By factoring in the projected importer demand gap that is currently unmet and could be potential opportunity, it identifies the potential for the Exporter (Country) among 190 countries, against the general trade analysis, which identifies the biggest importer or exporter.
To discover high-growth global markets and optimize your business strategy:
Click Here
Pricing
- Single User License$ 1,995
- Department License$ 2,400
- Site License$ 3,120
- Global License$ 3,795

Search
Thought Leadership and Analyst Meet


Our Clients
Latest Reports
- Canada Cloud CFD Market (2026-2032) | Size & Revenue, Industry, Growth, Competitive Landscape, Forecast, Segmentation, Value, Outlook, Trends, Share, Analysis, Companies
- Taiwan Food Delivery Platform Market (2026-2032) | Companies, Outlook, Analysis, Trends, Value, Revenue, Segmentation, Share, Forecast, Competitive Landscape, Growth, Size & Forecast
- United Kingdom (UK) Long-term Care Insurance Market (2026-2032) | Growth, Share, Consumer Insights, Drivers, Opportunities, Competition, Pricing Analysis, Segments, Restraints, Companies, Competitive, Value, Outlook, Size, Demand, Analysis, Challenges, Strategic Insights, Investment Trends, Revenue, Trends, Supply, Forecast
- United Kingdom (UK) Long Term Care Market (2026-2032) | Companies, Outlook, Analysis, Trends, Value, Revenue, Segmentation, Share, Forecast, Competitive Landscape, Growth, Size & Forecast
- Iraq Insulation and Waterproofing Market (2026-2032) | Outlook, Drivers, Growth, Size, Share, Industry, Revenue, Trends, Demand, Competitive, Strategic Insights, Opportunities, Segments, Companies, Challenges, Strategy, Consumer Insights, Analysis, Investment Trends, Value, Segmentation, Forecast, Restraints
- India Switchgear Market Outlook (2026-2032) | Size, Share, Trends, Growth, Revenue, Forecast, Analysis, Value, Outlook
- Pakistan Contraceptive Implants Market (2025-2031) | Demand, Growth, Size, Share, Industry, Pricing Analysis, Competitive, Strategic Insights, Strategy, Consumer Insights, Analysis, Investment Trends, Opportunities, Revenue, Segments, Value, Segmentation, Supply, Forecast, Restraints, Outlook, Competition, Drivers, Trends, Companies, Challenges
- Sri Lanka Packaging Market (2026-2032) | Outlook, Competition, Drivers, Trends, Demand, Pricing Analysis, Competitive, Strategic Insights, Companies, Challenges, Strategy, Consumer Insights, Analysis, Investment Trends, Opportunities, Growth, Size, Share, Industry, Revenue, Segments, Value, Segmentation, Supply, Forecast, Restraints
- India Kids Watches Market (2026-2032) | Strategy, Consumer Insights, Analysis, Investment Trends, Opportunities, Growth, Size, Share, Industry, Revenue, Segments, Value, Segmentation, Supply, Forecast, Restraints, Outlook, Competition, Drivers, Trends, Demand, Pricing Analysis, Competitive, Strategic Insights, Companies, Challenges
- Saudi Arabia Core Assurance Service Market (2025-2031) | Strategy, Consumer Insights, Analysis, Investment Trends, Opportunities, Growth, Size, Share, Industry, Revenue, Segments, Value, Segmentation, Supply, Forecast, Restraints, Outlook, Competition, Drivers, Trends, Demand, Pricing Analysis, Competitive, Strategic Insights, Companies, Challenges
Industry Events and Analyst Meet

India EV Show 2026

EV tech India Expo 2026

Auto Tech Asia 2026

Battery Tech India 2026

Smart Production Solutions Guangzhou 2026
Whitepaper
- Middle East & Africa Commercial Security Market Click here to view more.
- Middle East & Africa Fire Safety Systems & Equipment Market Click here to view more.
- GCC Drone Market Click here to view more.
- Middle East Lighting Fixture Market Click here to view more.
- GCC Physical & Perimeter Security Market Click here to view more.
6WResearch In News
- Doha a strategic location for EV manufacturing hub: IPA Qatar
- Demand for luxury TVs surging in the GCC, says Samsung
- Empowering Growth: The Thriving Journey of Bangladesh’s Cable Industry
- Demand for luxury TVs surging in the GCC, says Samsung
- Video call with a traditional healer? Once unthinkable, it’s now common in South Africa
- Intelligent Buildings To Smooth GCC’s Path To Net Zero