Estonia Cement Clinker Market (2026-2032) | Revenue, Industry, Growth, Outlook, Segmentation, Companies, Share, Value, Trends, Size, Forecast & Analysis
Market Forecast By Product Type (White Clinker, Portland Clinker, Sulfate Resistant Clinker, Other), By Applications (Residential, Non-residential, Infrastructure) And Competitive Landscape
| Product Code: ETC5255926 | Publication Date: Nov 2023 | Updated Date: Apr 2026 | Product Type: Market Research Report | |
| Publisher: 6Wresearch | Author: Ravi Bhandari | No. of Pages: 60 | No. of Figures: 30 | No. of Tables: 5 |
Estonia Cement Clinker Market Size (2020-2030)
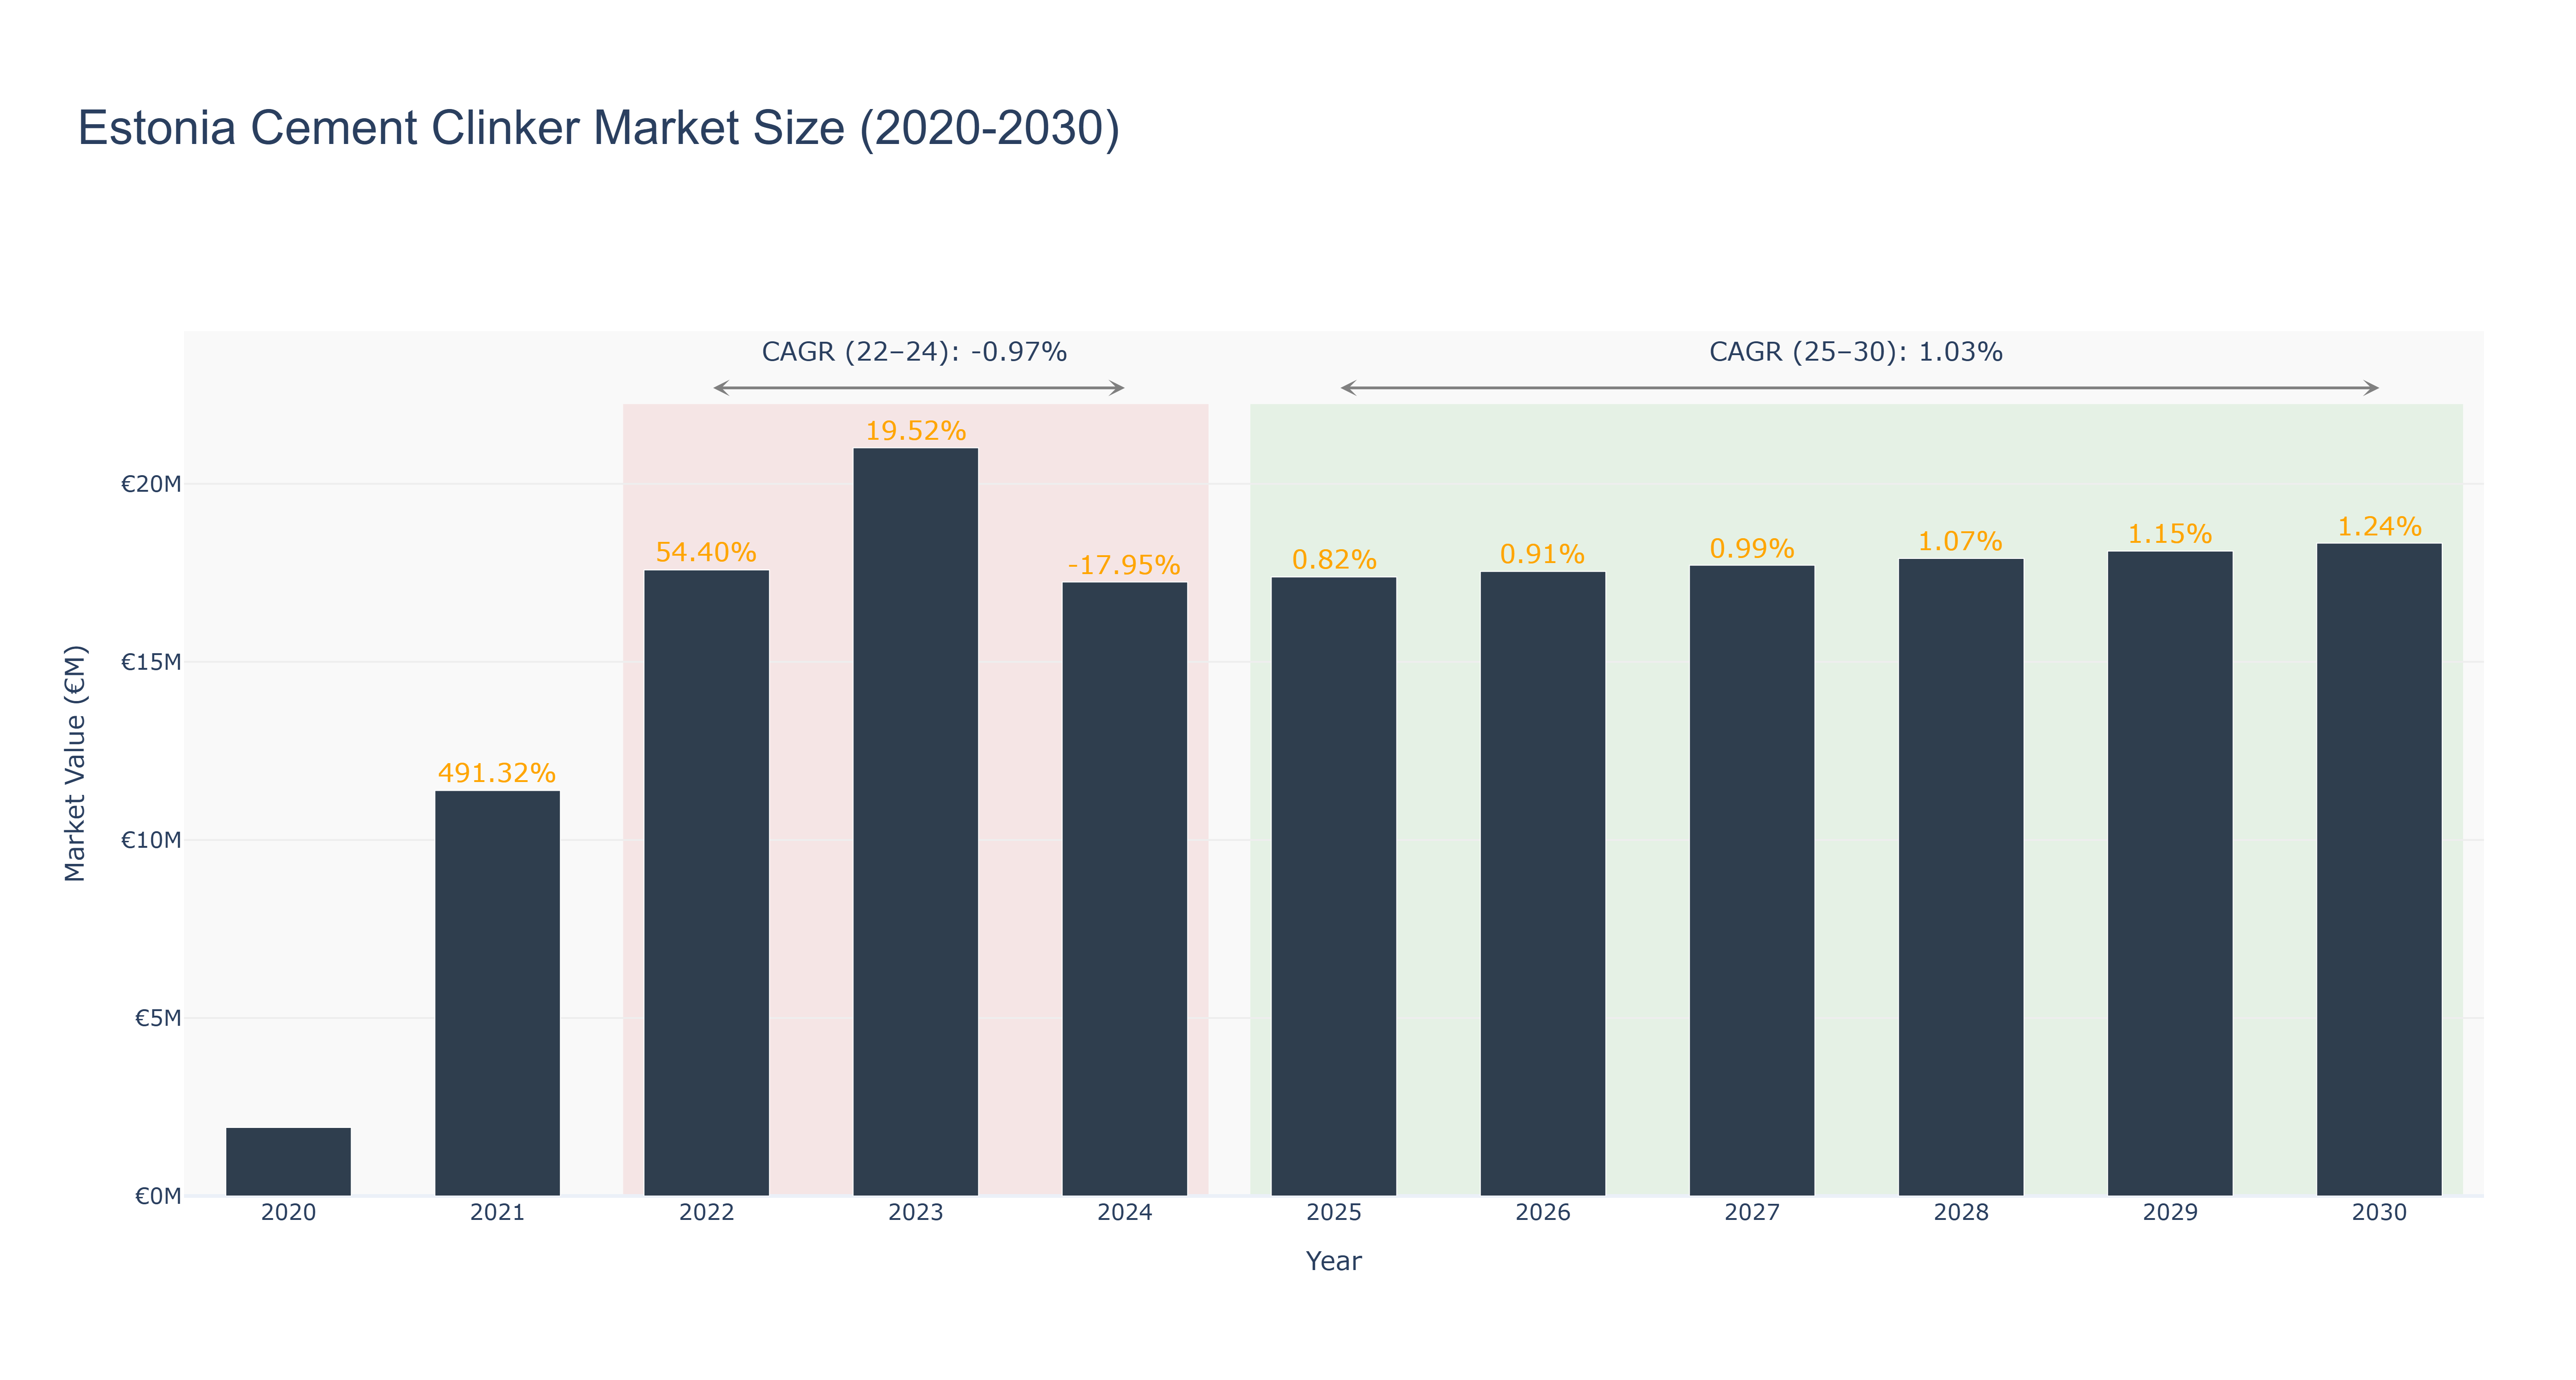
Estonia Cement Clinker Market has shown a fluctuating trend over the years. The market peaked in 2023 with a size of €21.01 million, followed by a decline in 2024 to €17.24 million. The forecasted market size indicates a steady growth from 2025 to 2030, with an expected size of €18.33 million in 2030. The CAGR for the period 2022-24 was -0.97%, reflecting a temporary setback, while the CAGR for 2025-30 is projected to be 1.03%, indicating a gradual recovery and growth. Industry drivers influencing this market include infrastructure development projects and increasing construction activities in Estonia. Looking ahead, upcoming projects such as the Tallinn Tunnel construction are expected to boost demand for cement clinker, driving market growth in the near future.
Estonia Cement Clinker Market: Production & Trade Performance (2019-2025)
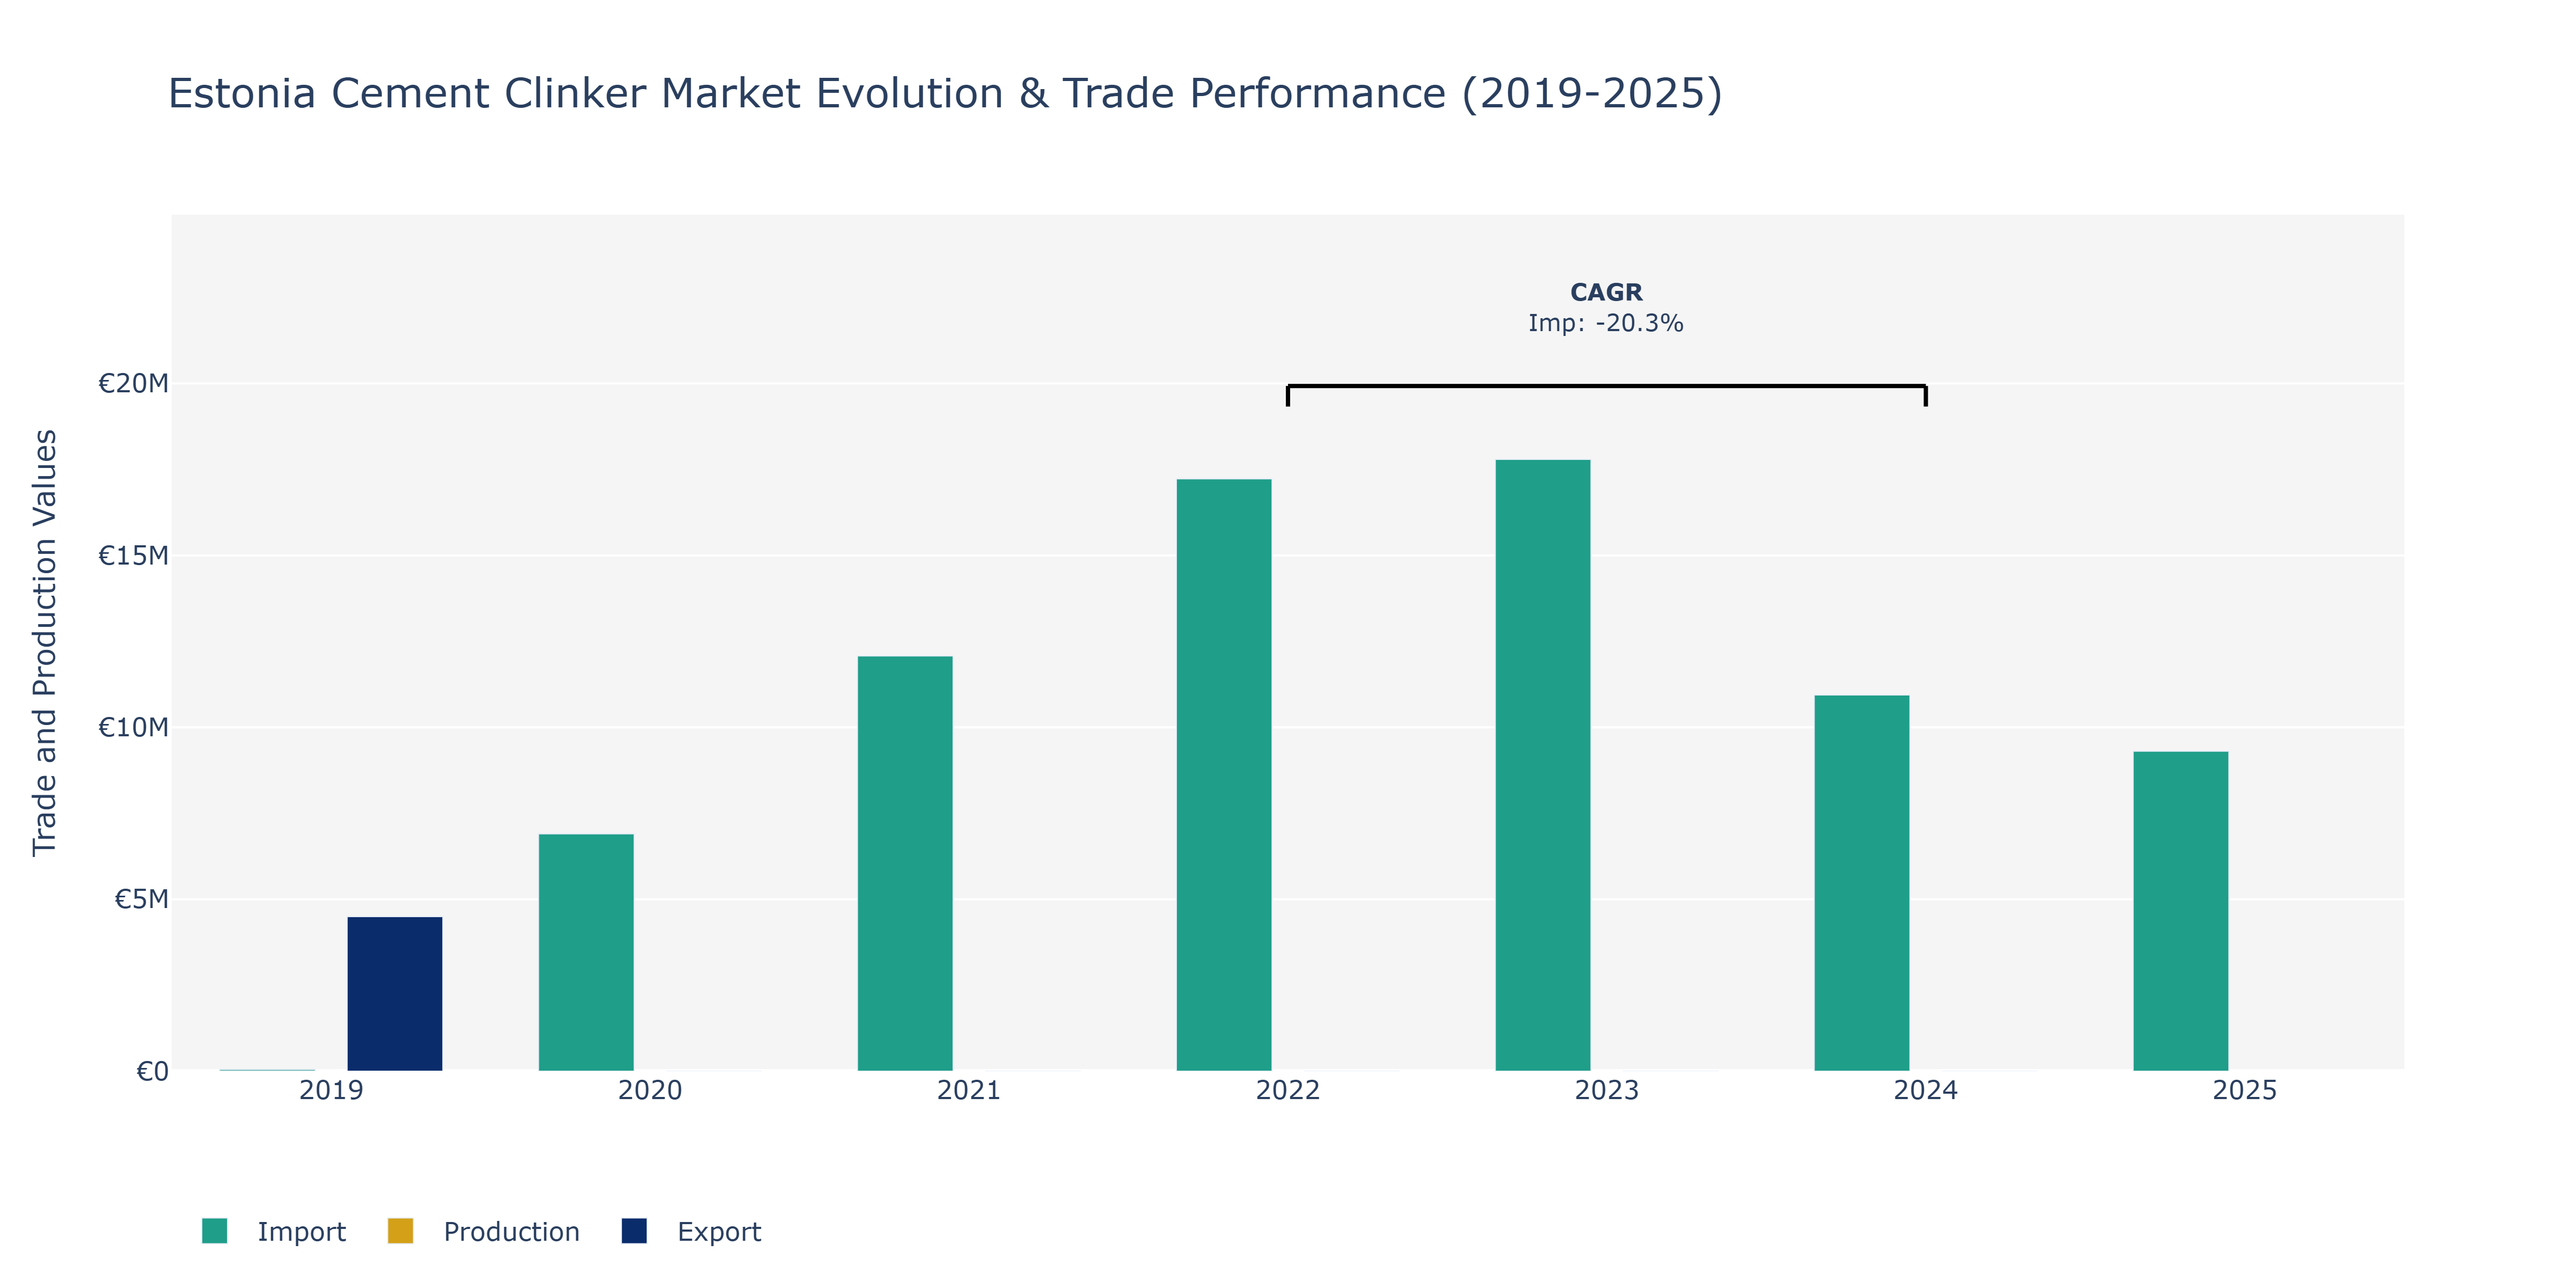
In the Estonia Cement Clinker Market, exports consistently surpassed imports and production levels from 2019 to 2025. Exports started at €4.5 million in 2019 and remained the highest among the three metrics throughout the period. Imports experienced fluctuations, with a significant increase from €49.2 thousand in 2019 to a peak of €17.79 million in 2023, followed by a decline in 2024 to €10.94 million and then a slight drop to €9.31 million in 2025. On the other hand, production levels began at €4.7 million in 2019, indicating a steady contribution to the market. The surge in imports until 2023 could be attributed to infrastructural development projects in Estonia, leading to increased demand for raw materials like cement clinker. The subsequent decline in 2024 might be due to completion of specific projects or shifts in construction activities. The stable production levels reflect a consistent local supply to meet demand, supporting the overall market equilibrium.
Key Highlights of the Report:
- Estonia Cement Clinker Market Outlook
- Market Size of Estonia Cement Clinker Market, 2025
- Forecast of Estonia Cement Clinker Market, 2032
- Historical Data and Forecast of Estonia Cement Clinker Revenues & Volume for the Period 2022 - 2032F
- Estonia Cement Clinker Market Trend Evolution
- Estonia Cement Clinker Market Drivers and Challenges
- Estonia Cement Clinker Price Trends
- Estonia Cement Clinker Porter`s Five Forces
- Estonia Cement Clinker Industry Life Cycle
- Historical Data and Forecast of Estonia Cement Clinker Market Revenues & Volume By Product Type for the Period 2022 - 2032F
- Historical Data and Forecast of Estonia Cement Clinker Market Revenues & Volume By White Clinker for the Period 2022 - 2032F
- Historical Data and Forecast of Estonia Cement Clinker Market Revenues & Volume By Portland Clinker for the Period 2022 - 2032F
- Historical Data and Forecast of Estonia Cement Clinker Market Revenues & Volume By Sulfate Resistant Clinker for the Period 2022 - 2032F
- Historical Data and Forecast of Estonia Cement Clinker Market Revenues & Volume By Other for the Period 2022 - 2032F
- Historical Data and Forecast of Estonia Cement Clinker Market Revenues & Volume By Applications for the Period 2022 - 2032F
- Historical Data and Forecast of Estonia Cement Clinker Market Revenues & Volume By Residential for the Period 2022 - 2032F
- Historical Data and Forecast of Estonia Cement Clinker Market Revenues & Volume By Non-residential for the Period 2022 - 2032F
- Historical Data and Forecast of Estonia Cement Clinker Market Revenues & Volume By Infrastructure for the Period 2022 - 2032F
- Estonia Cement Clinker Import Export Trade Statistics
- Market Opportunity Assessment By Product Type
- Market Opportunity Assessment By Applications
- Estonia Cement Clinker Top Companies Market Share
- Estonia Cement Clinker Competitive Benchmarking By Technical and Operational Parameters
- Estonia Cement Clinker Company Profiles
- Estonia Cement Clinker Key Strategic Recommendations
Frequently Asked Questions About the Market Study (FAQs):
6Wresearch actively monitors the Estonia Cement Clinker Market and publishes its comprehensive annual report, highlighting emerging trends, growth drivers, revenue analysis, and forecast outlook. Our insights help businesses to make data-backed strategic decisions with ongoing market dynamics. Our analysts track relevent industries related to the Estonia Cement Clinker Market, allowing our clients with actionable intelligence and reliable forecasts tailored to emerging regional needs.
Yes, we provide customisation as per your requirements. To learn more, feel free to contact us on sales@6wresearch.com
1 Executive Summary |
2 Introduction |
2.1 Key Highlights of the Report |
2.2 Report Description |
2.3 Market Scope & Segmentation |
2.4 Research Methodology |
2.5 Assumptions |
3 Estonia Cement Clinker Market Overview |
3.1 Estonia Country Macro Economic Indicators |
3.2 Estonia Cement Clinker Market Revenues & Volume, 2022 & 2032F |
3.3 Estonia Cement Clinker Market - Industry Life Cycle |
3.4 Estonia Cement Clinker Market - Porter's Five Forces |
3.5 Estonia Cement Clinker Market Revenues & Volume Share, By Product Type, 2022 & 2032F |
3.6 Estonia Cement Clinker Market Revenues & Volume Share, By Applications, 2022 & 2032F |
4 Estonia Cement Clinker Market Dynamics |
4.1 Impact Analysis |
4.2 Market Drivers |
4.2.1 Growth in construction activities in Estonia |
4.2.2 Increasing infrastructure development projects |
4.2.3 Demand for sustainable and eco-friendly construction materials |
4.3 Market Restraints |
4.3.1 Fluctuating raw material prices |
4.3.2 Regulatory challenges related to environmental compliance |
4.3.3 Competition from alternative building materials like steel and wood |
5 Estonia Cement Clinker Market Trends |
6 Estonia Cement Clinker Market Segmentations |
6.1 Estonia Cement Clinker Market, By Product Type |
6.1.1 Overview and Analysis |
6.1.2 Estonia Cement Clinker Market Revenues & Volume, By White Clinker, 2022 - 2032F |
6.1.3 Estonia Cement Clinker Market Revenues & Volume, By Portland Clinker, 2022 - 2032F |
6.1.4 Estonia Cement Clinker Market Revenues & Volume, By Sulfate Resistant Clinker, 2022 - 2032F |
6.1.5 Estonia Cement Clinker Market Revenues & Volume, By Other, 2022 - 2032F |
6.2 Estonia Cement Clinker Market, By Applications |
6.2.1 Overview and Analysis |
6.2.2 Estonia Cement Clinker Market Revenues & Volume, By Residential, 2022 - 2032F |
6.2.3 Estonia Cement Clinker Market Revenues & Volume, By Non-residential, 2022 - 2032F |
6.2.4 Estonia Cement Clinker Market Revenues & Volume, By Infrastructure, 2022 - 2032F |
7 Estonia Cement Clinker Market Import-Export Trade Statistics |
7.1 Estonia Cement Clinker Market Export to Major Countries |
7.2 Estonia Cement Clinker Market Imports from Major Countries |
8 Estonia Cement Clinker Market Key Performance Indicators |
8.1 Energy efficiency improvements in cement clinker production |
8.2 Adoption rate of eco-friendly cement clinker technologies |
8.3 Investment in research and development for innovative cement clinker products |
9 Estonia Cement Clinker Market - Opportunity Assessment |
9.1 Estonia Cement Clinker Market Opportunity Assessment, By Product Type, 2022 & 2032F |
9.2 Estonia Cement Clinker Market Opportunity Assessment, By Applications, 2022 & 2032F |
10 Estonia Cement Clinker Market - Competitive Landscape |
10.1 Estonia Cement Clinker Market Revenue Share, By Companies, 2025 |
10.2 Estonia Cement Clinker Market Competitive Benchmarking, By Operating and Technical Parameters |
11 Company Profiles |
12 Recommendations | 13 Disclaimer |
Global Go To Market Strategy - 2030
Export potential enables firms to identify high-growth global markets with greater confidence by combining advanced trade intelligence with a structured quantitative methodology. The framework analyzes emerging demand trends and country-level import patterns while integrating macroeconomic and trade datasets such as GDP and population forecasts, bilateral import–export flows, tariff structures, elasticity differentials between developed and developing economies, geographic distance, and import demand projections. Using weighted trade values from 2020–2024 as the base period to project country-to-country export potential for 2030, these inputs are operationalized through calculated drivers such as gravity model parameters, tariff impact factors, and projected GDP per-capita growth. Through an analysis of hidden potentials, demand hotspots, and market conditions that are most favorable to success, this method enables firms to focus on target countries, maximize returns, and global expansion with data, backed by accuracy.
By factoring in the projected importer demand gap that is currently unmet and could be potential opportunity, it identifies the potential for the Exporter (Country) among 190 countries, against the general trade analysis, which identifies the biggest importer or exporter.
To discover high-growth global markets and optimize your business strategy:
Click Here
Pricing
- Single User License$ 1,995
- Department License$ 2,400
- Site License$ 3,120
- Global License$ 3,795

Leadership Perspectives from Industry Events
Search
Thought Leadership and Analyst Meet


Our Clients
6WResearch In News
- ADAS in India: How Automatic Emergency Braking, Blind Spot Detection & Driver Monitoring are Transforming Road Safety
- Doha a strategic location for EV manufacturing hub: IPA Qatar
- Demand for luxury TVs surging in the GCC, says Samsung
- Empowering Growth: The Thriving Journey of Bangladesh’s Cable Industry
- Demand for luxury TVs surging in the GCC, says Samsung
- Video call with a traditional healer? Once unthinkable, it’s now common in South Africa
Latest Reports
- Poland Fire Protection Systems Market (2026-2032)
- Cape Verde Portable Hand-Thrown Extinguisher Market (2026-2032)
- Canada Portable Hand-Thrown Extinguisher Market (2026-2032)
- Cameroon Portable Hand-Thrown Extinguisher Market (2026-2032)
- Burundi Portable Hand-Thrown Extinguisher Market (2026-2032)
- Burkina Faso Portable Hand-Thrown Extinguisher Market (2026-2032)
- Bulgaria Portable Hand-Thrown Extinguisher Market (2026-2032)
- Brunei Portable Hand-Thrown Extinguisher Market (2026-2032)
- Botswana Portable Hand-Thrown Extinguisher Market (2026-2032)
- Bosnia and Herzegovina Portable Hand-Thrown Extinguisher Market (2026-2032)
Industry Events and Analyst Meet

HIMTEX 2026

India Refining Summit 2026

India EV Show 2026

EV tech India Expo 2026

Auto Tech Asia 2026
Whitepaper
- Middle East & Africa Commercial Security Market Click here to view more.
- Middle East & Africa Fire Safety Systems & Equipment Market Click here to view more.
- GCC Drone Market Click here to view more.
- Middle East Lighting Fixture Market Click here to view more.
- GCC Physical & Perimeter Security Market Click here to view more.