Estonia Cleansing Lotion Market (2026-2032) | Size, Outlook, Trends, Companies, Forecast, Analysis, Revenue, Value, Segmentation, Growth, Industry & Share
Market Forecast By Product Type (Face Cleansing Lotion, Body Cleansing Lotion), By Category (Organic, Non-organic), By Skin Type (Dry Skin, Oily Skin, Sensitive Skin, Normal Skin, Others), By End-users (Women, Men, Unisex), By End-use (Personal Use, Commercial), By Price (Low, Medium, High), By Distribution Channel (Online, Offline) And Competitive Landscape
| Product Code: ETC5258054 | Publication Date: Nov 2023 | Updated Date: Apr 2026 | Product Type: Market Research Report | |
| Publisher: 6Wresearch | Author: Ravi Bhandari | No. of Pages: 60 | No. of Figures: 30 | No. of Tables: 5 |
Estonia Cleansing Lotion Market Size (2020-2030)
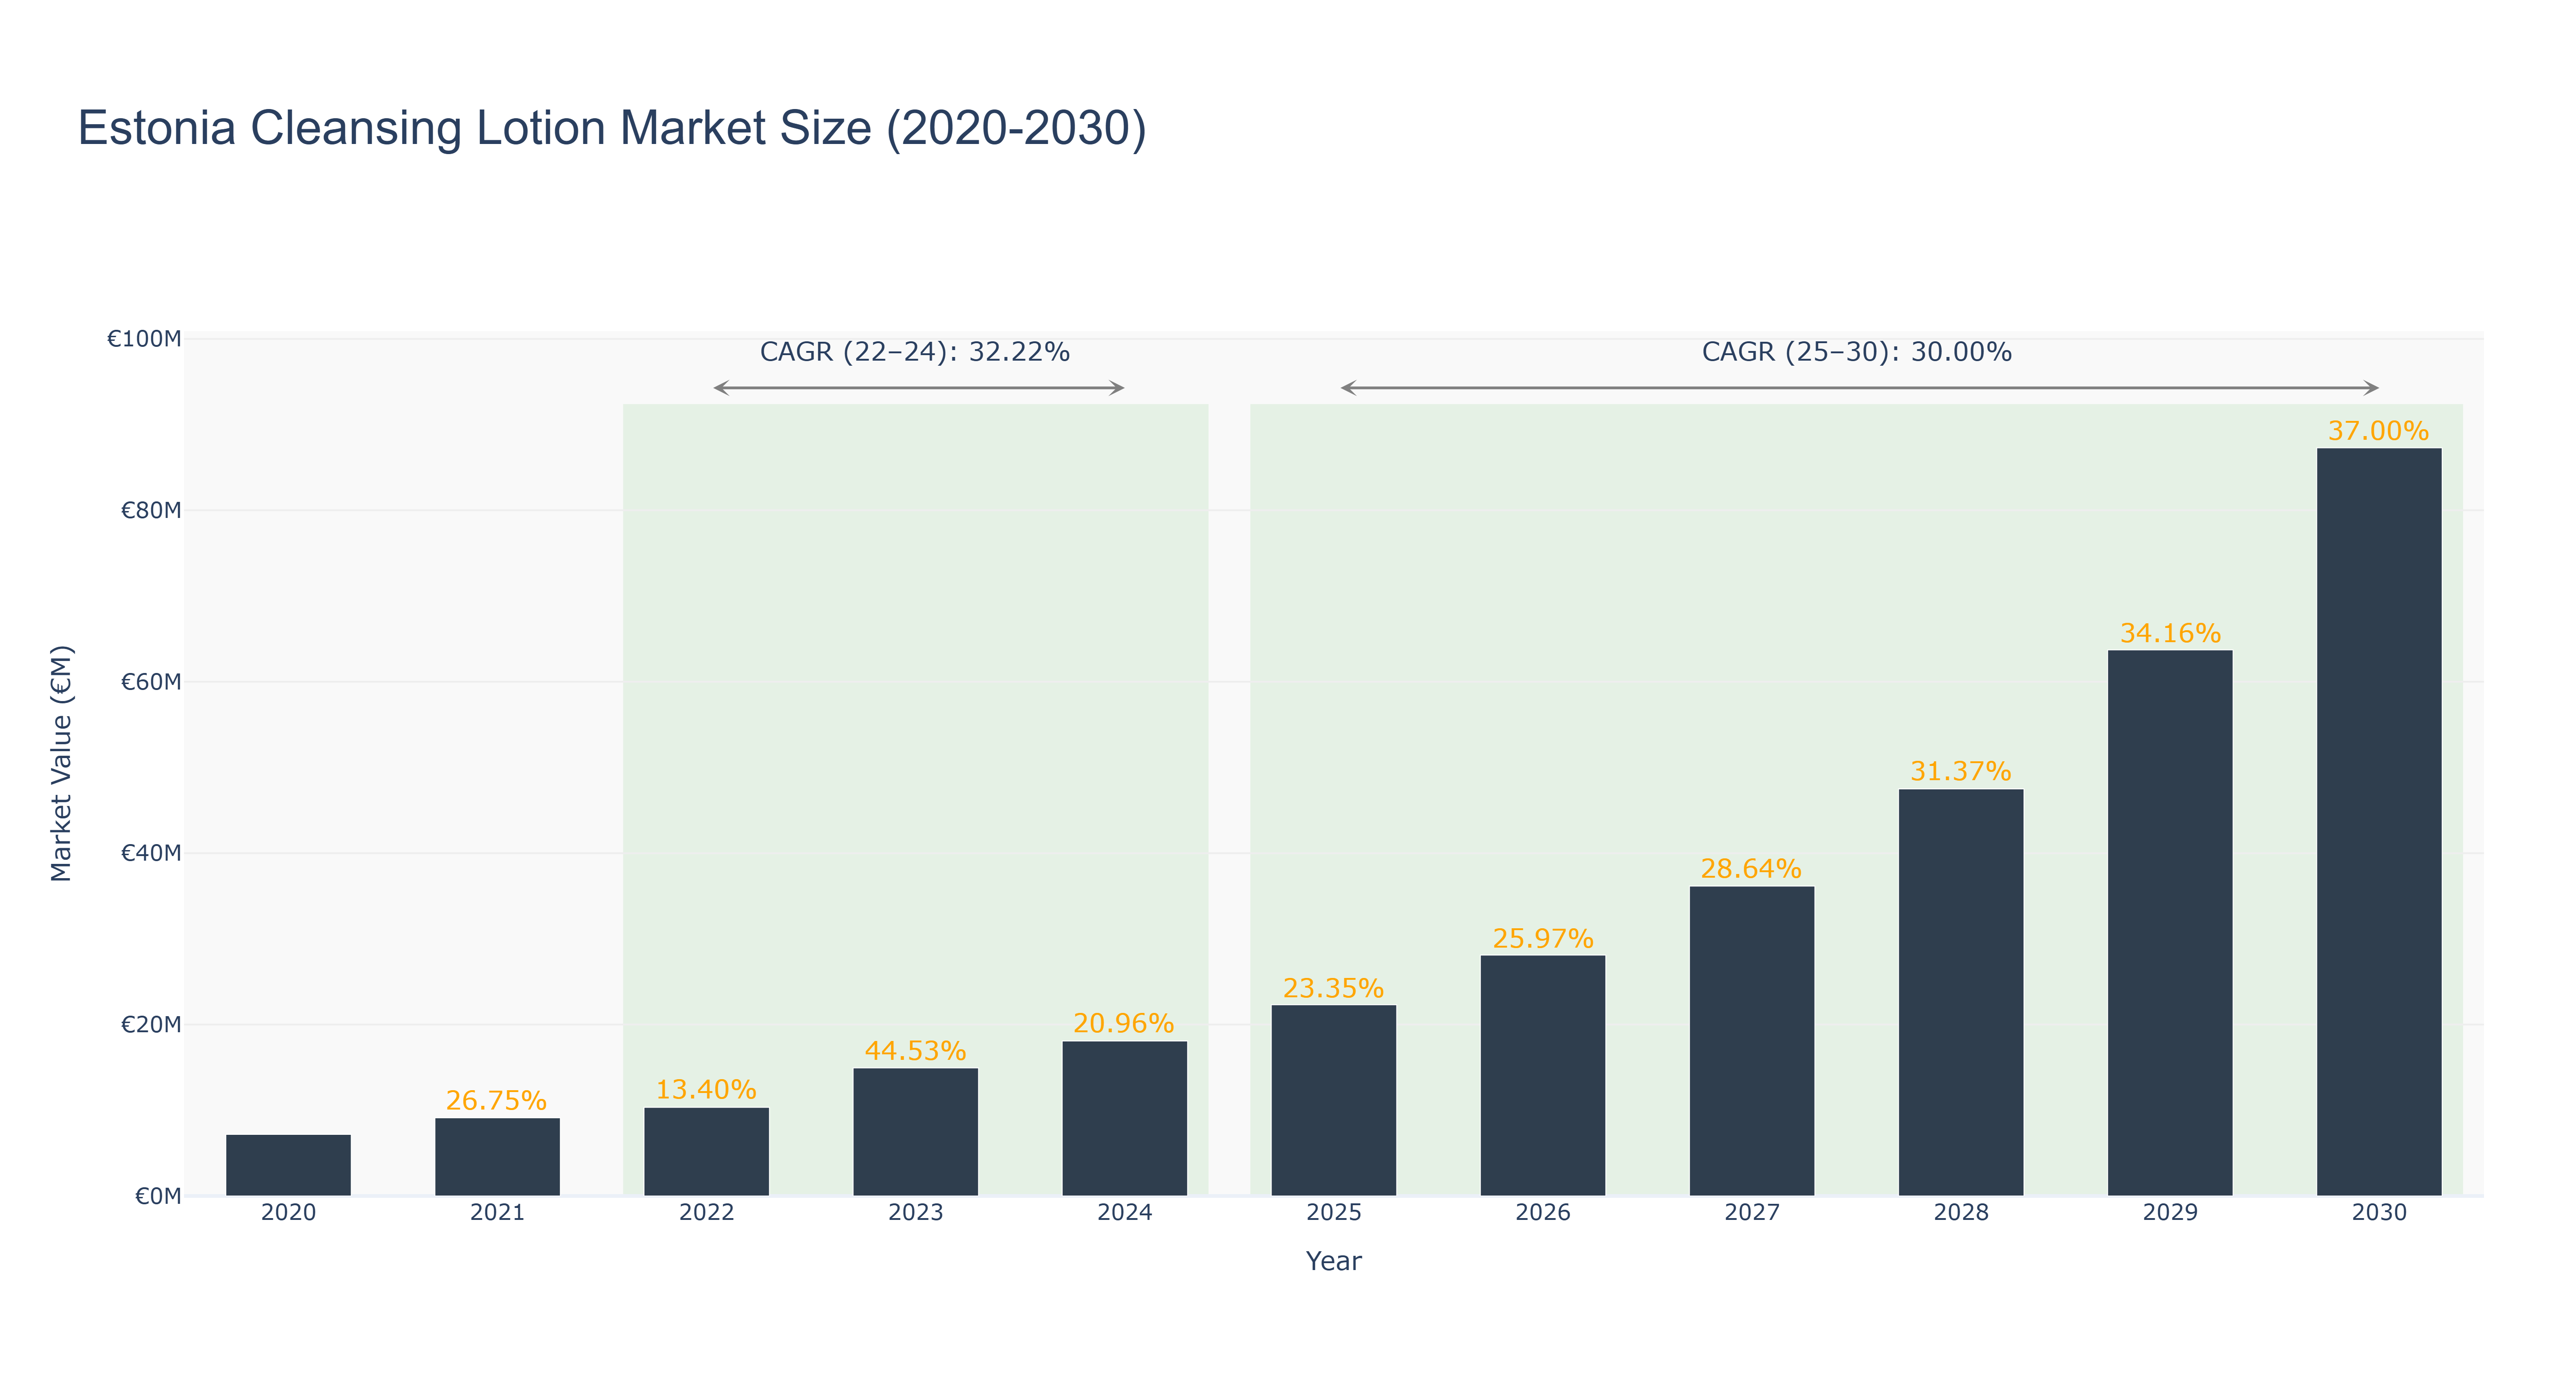
The Estonia Cleansing Lotion Market has demonstrated strong growth, with the market size reaching €10.34 million in 2022 and peaking at €18.08 million in 2024, reflecting a notable CAGR of 32.22% from 2022 to 2024. This growth can be attributed to increasing consumer awareness regarding skincare and a rising demand for natural and organic cleansing products. Looking ahead, the market is projected to continue its upward trajectory with a forecasted market size of €22.31 million in 2025, expanding to €87.29 million by 2030, at a CAGR of 30.00%. This anticipated growth will be driven by innovations in product formulations, the launch of eco-friendly packaging, and an expanding distribution network. Additionally, the growing influence of e-commerce is expected to facilitate increased accessibility and convenience for consumers, further contributing to the market's robust expansion.
Estonia Cleansing Lotion Market: Production & Trade Performance (2019-2025)
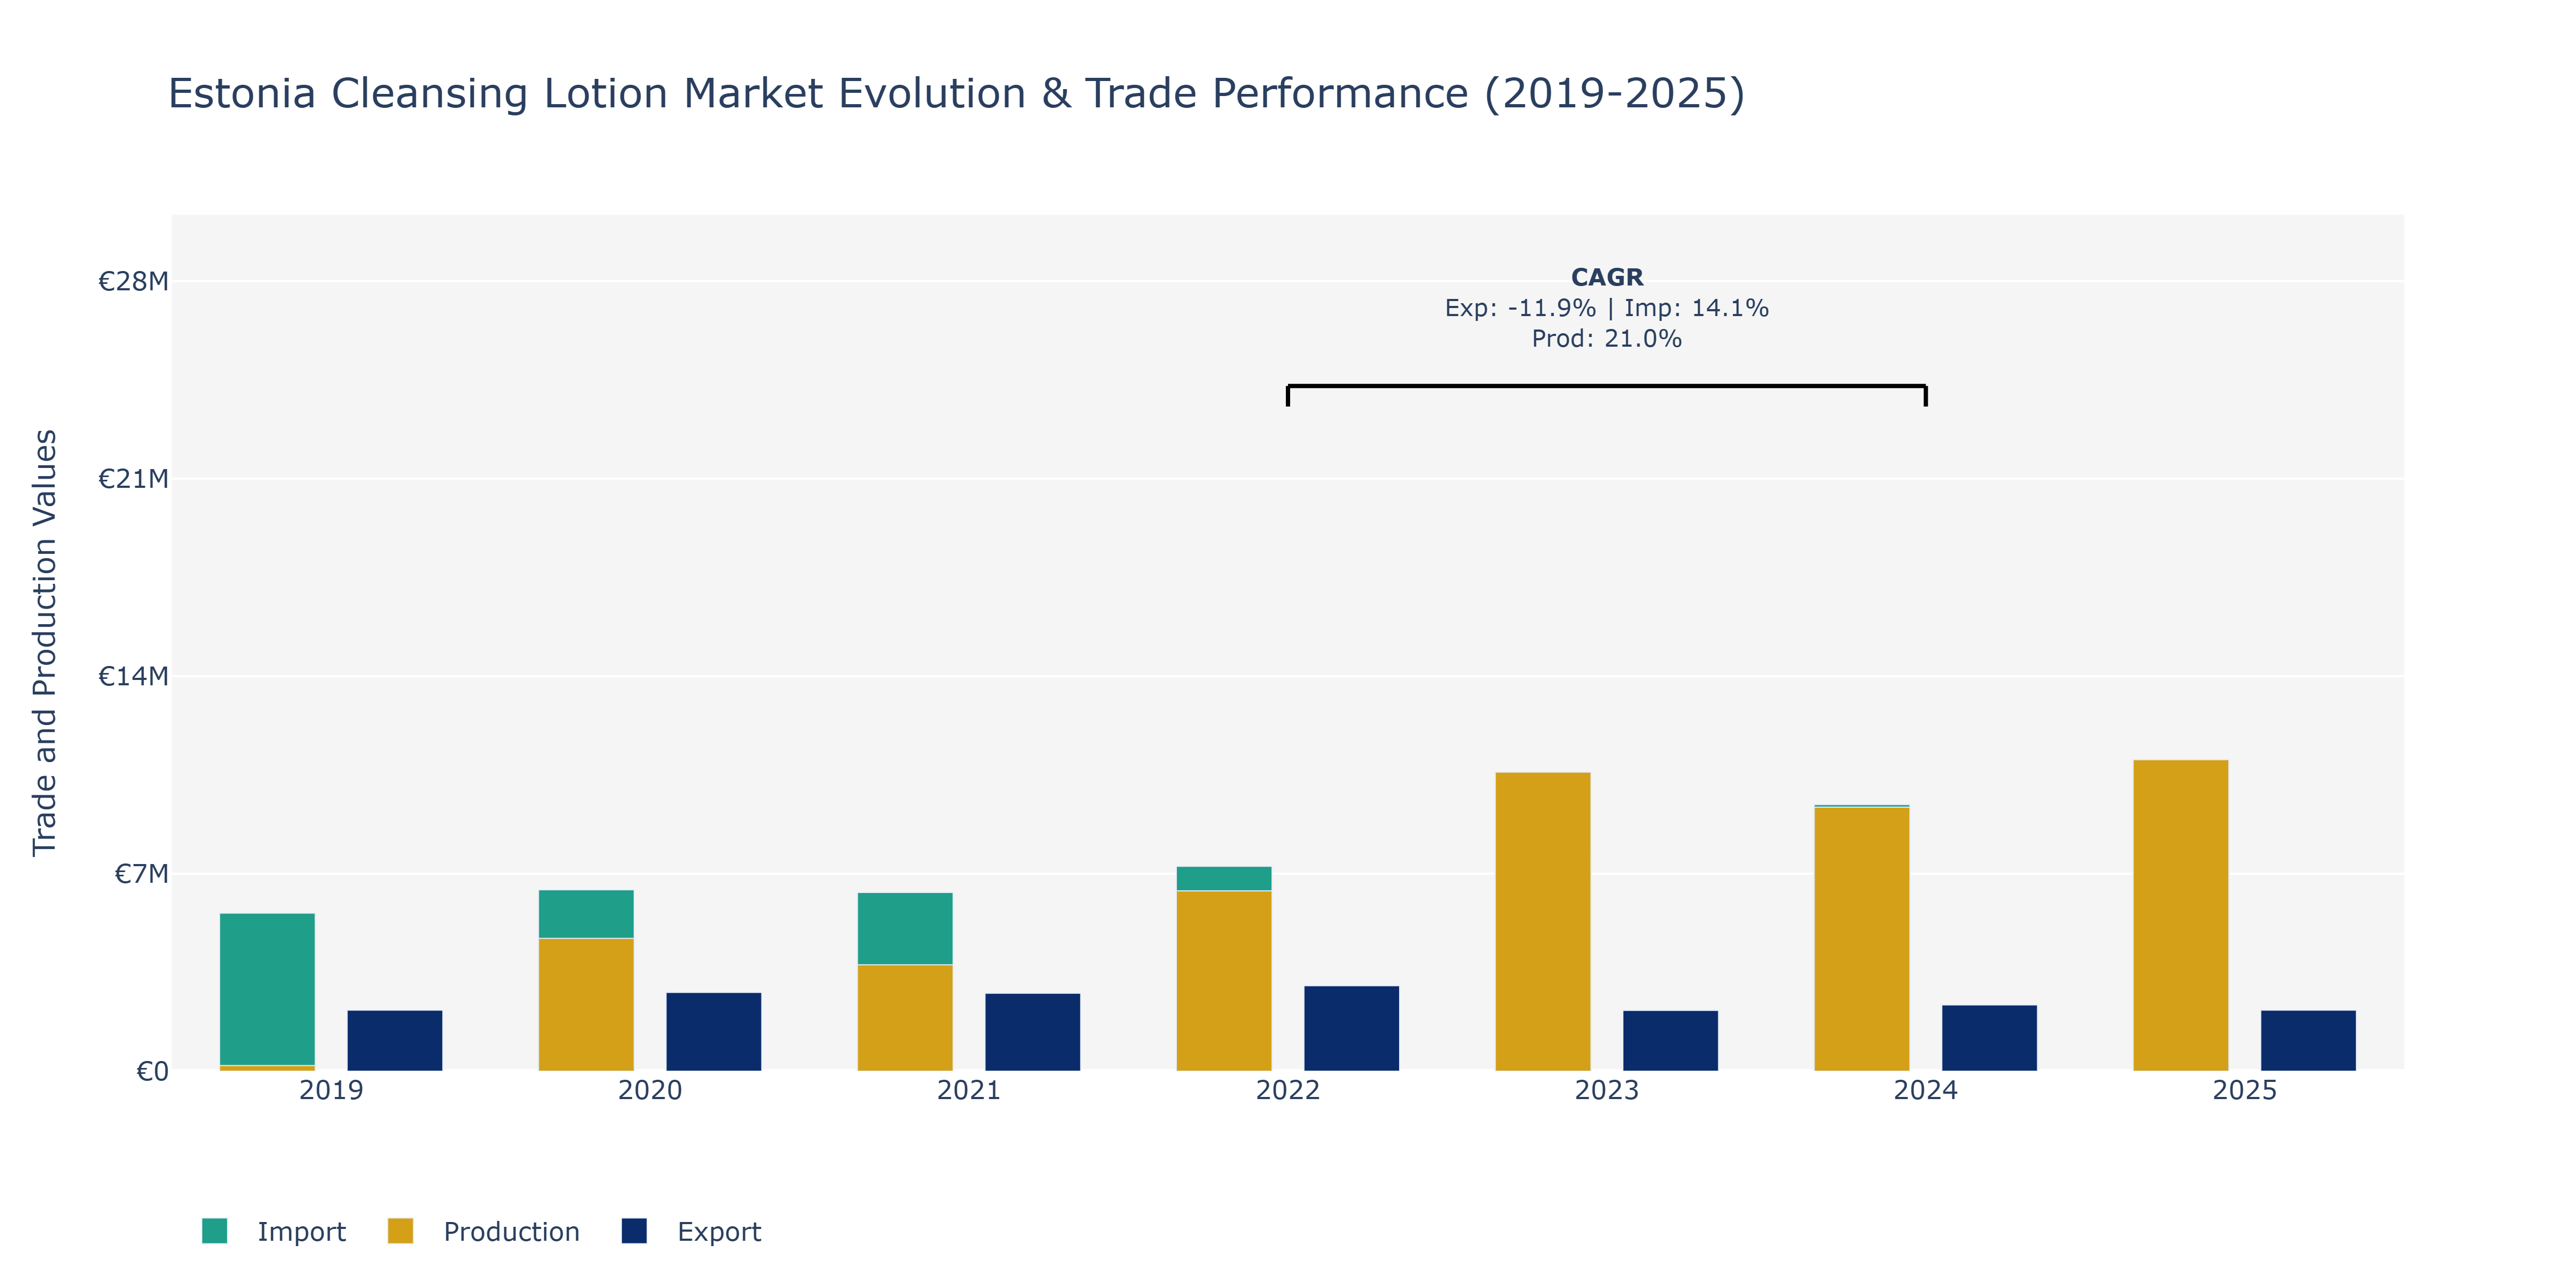
In the Estonia Cleansing Lotion Market, exports showcased fluctuations over the years, reaching a peak of €3.03 million in 2022 before declining to €2.35 million in 2024. This decline could be attributed to potential shifts in demand dynamics, competitive pricing strategies, or changes in market access. Imports steadily increased from €5.6 million in 2019 to €10.64 million in 2025, reflecting a growing reliance on imported raw materials or finished products. Production surged from €201.52 million in 2019 to €11.04 billion in 2025, indicating a significant expansion in manufacturing capacity, likely driven by increased domestic consumption and potential market penetration strategies. The notable production CAGR of 20.99% from 2022 to 2024 indicates a robust industry growth trajectory, potentially supported by product innovation and heightened consumer awareness of skincare products in the region. These trends highlight the market's evolving dynamics and the need for market players to adapt to changing consumer preferences and global economic conditions.
Key Highlights of the Report:
- Estonia Cleansing Lotion Market Outlook
- Market Size of Estonia Cleansing Lotion Market, 2025
- Forecast of Estonia Cleansing Lotion Market, 2032
- Historical Data and Forecast of Estonia Cleansing Lotion Revenues & Volume for the Period 2022 - 2032F
- Estonia Cleansing Lotion Market Trend Evolution
- Estonia Cleansing Lotion Market Drivers and Challenges
- Estonia Cleansing Lotion Price Trends
- Estonia Cleansing Lotion Porter`s Five Forces
- Estonia Cleansing Lotion Industry Life Cycle
- Historical Data and Forecast of Estonia Cleansing Lotion Market Revenues & Volume By Product Type for the Period 2022 - 2032F
- Historical Data and Forecast of Estonia Cleansing Lotion Market Revenues & Volume By Face Cleansing Lotion for the Period 2022 - 2032F
- Historical Data and Forecast of Estonia Cleansing Lotion Market Revenues & Volume By Body Cleansing Lotion for the Period 2022 - 2032F
- Historical Data and Forecast of Estonia Cleansing Lotion Market Revenues & Volume By Category for the Period 2022 - 2032F
- Historical Data and Forecast of Estonia Cleansing Lotion Market Revenues & Volume By Organic for the Period 2022 - 2032F
- Historical Data and Forecast of Estonia Cleansing Lotion Market Revenues & Volume By Non-organic for the Period 2022 - 2032F
- Historical Data and Forecast of Estonia Cleansing Lotion Market Revenues & Volume By Skin Type for the Period 2022 - 2032F
- Historical Data and Forecast of Estonia Cleansing Lotion Market Revenues & Volume By Dry Skin for the Period 2022 - 2032F
- Historical Data and Forecast of Estonia Cleansing Lotion Market Revenues & Volume By Oily Skin for the Period 2022 - 2032F
- Historical Data and Forecast of Estonia Cleansing Lotion Market Revenues & Volume By Sensitive Skin for the Period 2022 - 2032F
- Historical Data and Forecast of Estonia Cleansing Lotion Market Revenues & Volume By Normal Skin for the Period 2022 - 2032F
- Historical Data and Forecast of Estonia Cleansing Lotion Market Revenues & Volume By Others for the Period 2022 - 2032F
- Historical Data and Forecast of Estonia Cleansing Lotion Market Revenues & Volume By End-users for the Period 2022 - 2032F
- Historical Data and Forecast of Estonia Cleansing Lotion Market Revenues & Volume By Women for the Period 2022 - 2032F
- Historical Data and Forecast of Estonia Cleansing Lotion Market Revenues & Volume By Men for the Period 2022 - 2032F
- Historical Data and Forecast of Estonia Cleansing Lotion Market Revenues & Volume By Unisex for the Period 2022 - 2032F
- Historical Data and Forecast of Estonia Cleansing Lotion Market Revenues & Volume By End-use for the Period 2022 - 2032F
- Historical Data and Forecast of Estonia Cleansing Lotion Market Revenues & Volume By Personal Use for the Period 2022 - 2032F
- Historical Data and Forecast of Estonia Cleansing Lotion Market Revenues & Volume By Commercial for the Period 2022 - 2032F
- Historical Data and Forecast of Estonia Cleansing Lotion Market Revenues & Volume By Price for the Period 2022 - 2032F
- Historical Data and Forecast of Estonia Cleansing Lotion Market Revenues & Volume By Low for the Period 2022 - 2032F
- Historical Data and Forecast of Estonia Cleansing Lotion Market Revenues & Volume By Medium for the Period 2022 - 2032F
- Historical Data and Forecast of Estonia Cleansing Lotion Market Revenues & Volume By High for the Period 2022 - 2032F
- Historical Data and Forecast of Estonia Cleansing Lotion Market Revenues & Volume By Distribution Channel for the Period 2022 - 2032F
- Historical Data and Forecast of Estonia Cleansing Lotion Market Revenues & Volume By Online for the Period 2022 - 2032F
- Historical Data and Forecast of Estonia Cleansing Lotion Market Revenues & Volume By Offline for the Period 2022 - 2032F
- Estonia Cleansing Lotion Import Export Trade Statistics
- Market Opportunity Assessment By Product Type
- Market Opportunity Assessment By Category
- Market Opportunity Assessment By Skin Type
- Market Opportunity Assessment By End-users
- Market Opportunity Assessment By End-use
- Market Opportunity Assessment By Price
- Market Opportunity Assessment By Distribution Channel
- Estonia Cleansing Lotion Top Companies Market Share
- Estonia Cleansing Lotion Competitive Benchmarking By Technical and Operational Parameters
- Estonia Cleansing Lotion Company Profiles
- Estonia Cleansing Lotion Key Strategic Recommendations
Frequently Asked Questions About the Market Study (FAQs):
6Wresearch actively monitors the Estonia Cleansing Lotion Market and publishes its comprehensive annual report, highlighting emerging trends, growth drivers, revenue analysis, and forecast outlook. Our insights help businesses to make data-backed strategic decisions with ongoing market dynamics. Our analysts track relevent industries related to the Estonia Cleansing Lotion Market, allowing our clients with actionable intelligence and reliable forecasts tailored to emerging regional needs.
Yes, we provide customisation as per your requirements. To learn more, feel free to contact us on sales@6wresearch.com
1 Executive Summary |
2 Introduction |
2.1 Key Highlights of the Report |
2.2 Report Description |
2.3 Market Scope & Segmentation |
2.4 Research Methodology |
2.5 Assumptions |
3 Estonia Cleansing Lotion Market Overview |
3.1 Estonia Country Macro Economic Indicators |
3.2 Estonia Cleansing Lotion Market Revenues & Volume, 2022 & 2032F |
3.3 Estonia Cleansing Lotion Market - Industry Life Cycle |
3.4 Estonia Cleansing Lotion Market - Porter's Five Forces |
3.5 Estonia Cleansing Lotion Market Revenues & Volume Share, By Product Type, 2022 & 2032F |
3.6 Estonia Cleansing Lotion Market Revenues & Volume Share, By Category, 2022 & 2032F |
3.7 Estonia Cleansing Lotion Market Revenues & Volume Share, By Skin Type, 2022 & 2032F |
3.8 Estonia Cleansing Lotion Market Revenues & Volume Share, By End-users, 2022 & 2032F |
3.9 Estonia Cleansing Lotion Market Revenues & Volume Share, By End-use, 2022 & 2032F |
3.10 Estonia Cleansing Lotion Market Revenues & Volume Share, By Price, 2022 & 2032F |
3.11 Estonia Cleansing Lotion Market Revenues & Volume Share, By Distribution Channel, 2022 & 2032F |
4 Estonia Cleansing Lotion Market Dynamics |
4.1 Impact Analysis |
4.2 Market Drivers |
4.2.1 Increasing awareness about skincare and personal hygiene |
4.2.2 Growing demand for organic and natural skincare products |
4.2.3 Rising disposable income leading to higher spending on personal care products |
4.3 Market Restraints |
4.3.1 Competition from established cleansing lotion brands |
4.3.2 Price sensitivity of consumers |
4.3.3 Regulatory challenges related to product ingredients and labeling requirements |
5 Estonia Cleansing Lotion Market Trends |
6 Estonia Cleansing Lotion Market Segmentations |
6.1 Estonia Cleansing Lotion Market, By Product Type |
6.1.1 Overview and Analysis |
6.1.2 Estonia Cleansing Lotion Market Revenues & Volume, By Face Cleansing Lotion, 2022 - 2032F |
6.1.3 Estonia Cleansing Lotion Market Revenues & Volume, By Body Cleansing Lotion, 2022 - 2032F |
6.2 Estonia Cleansing Lotion Market, By Category |
6.2.1 Overview and Analysis |
6.2.2 Estonia Cleansing Lotion Market Revenues & Volume, By Organic, 2022 - 2032F |
6.2.3 Estonia Cleansing Lotion Market Revenues & Volume, By Non-organic, 2022 - 2032F |
6.3 Estonia Cleansing Lotion Market, By Skin Type |
6.3.1 Overview and Analysis |
6.3.2 Estonia Cleansing Lotion Market Revenues & Volume, By Dry Skin, 2022 - 2032F |
6.3.3 Estonia Cleansing Lotion Market Revenues & Volume, By Oily Skin, 2022 - 2032F |
6.3.4 Estonia Cleansing Lotion Market Revenues & Volume, By Sensitive Skin, 2022 - 2032F |
6.3.5 Estonia Cleansing Lotion Market Revenues & Volume, By Normal Skin, 2022 - 2032F |
6.3.6 Estonia Cleansing Lotion Market Revenues & Volume, By Others, 2022 - 2032F |
6.4 Estonia Cleansing Lotion Market, By End-users |
6.4.1 Overview and Analysis |
6.4.2 Estonia Cleansing Lotion Market Revenues & Volume, By Women, 2022 - 2032F |
6.4.3 Estonia Cleansing Lotion Market Revenues & Volume, By Men, 2022 - 2032F |
6.4.4 Estonia Cleansing Lotion Market Revenues & Volume, By Unisex, 2022 - 2032F |
6.5 Estonia Cleansing Lotion Market, By End-use |
6.5.1 Overview and Analysis |
6.5.2 Estonia Cleansing Lotion Market Revenues & Volume, By Personal Use, 2022 - 2032F |
6.5.3 Estonia Cleansing Lotion Market Revenues & Volume, By Commercial, 2022 - 2032F |
6.6 Estonia Cleansing Lotion Market, By Price |
6.6.1 Overview and Analysis |
6.6.2 Estonia Cleansing Lotion Market Revenues & Volume, By Low, 2022 - 2032F |
6.6.3 Estonia Cleansing Lotion Market Revenues & Volume, By Medium, 2022 - 2032F |
6.6.4 Estonia Cleansing Lotion Market Revenues & Volume, By High, 2022 - 2032F |
6.7 Estonia Cleansing Lotion Market, By Distribution Channel |
6.7.1 Overview and Analysis |
6.7.2 Estonia Cleansing Lotion Market Revenues & Volume, By Online, 2022 - 2032F |
6.7.3 Estonia Cleansing Lotion Market Revenues & Volume, By Offline, 2022 - 2032F |
7 Estonia Cleansing Lotion Market Import-Export Trade Statistics |
7.1 Estonia Cleansing Lotion Market Export to Major Countries |
7.2 Estonia Cleansing Lotion Market Imports from Major Countries |
8 Estonia Cleansing Lotion Market Key Performance Indicators |
8.1 Consumer satisfaction ratings for cleansing lotions |
8.2 Number of new product launches and innovations in the market |
8.3 Growth in online sales and e-commerce presence for cleansing lotions |
9 Estonia Cleansing Lotion Market - Opportunity Assessment |
9.1 Estonia Cleansing Lotion Market Opportunity Assessment, By Product Type, 2022 & 2032F |
9.2 Estonia Cleansing Lotion Market Opportunity Assessment, By Category, 2022 & 2032F |
9.3 Estonia Cleansing Lotion Market Opportunity Assessment, By Skin Type, 2022 & 2032F |
9.4 Estonia Cleansing Lotion Market Opportunity Assessment, By End-users, 2022 & 2032F |
9.5 Estonia Cleansing Lotion Market Opportunity Assessment, By End-use, 2022 & 2032F |
9.6 Estonia Cleansing Lotion Market Opportunity Assessment, By Price, 2022 & 2032F |
9.7 Estonia Cleansing Lotion Market Opportunity Assessment, By Distribution Channel, 2022 & 2032F |
10 Estonia Cleansing Lotion Market - Competitive Landscape |
10.1 Estonia Cleansing Lotion Market Revenue Share, By Companies, 2025 |
10.2 Estonia Cleansing Lotion Market Competitive Benchmarking, By Operating and Technical Parameters |
11 Company Profiles |
12 Recommendations | 13 Disclaimer |
Global Go To Market Strategy - 2030
Export potential enables firms to identify high-growth global markets with greater confidence by combining advanced trade intelligence with a structured quantitative methodology. The framework analyzes emerging demand trends and country-level import patterns while integrating macroeconomic and trade datasets such as GDP and population forecasts, bilateral import–export flows, tariff structures, elasticity differentials between developed and developing economies, geographic distance, and import demand projections. Using weighted trade values from 2020–2024 as the base period to project country-to-country export potential for 2030, these inputs are operationalized through calculated drivers such as gravity model parameters, tariff impact factors, and projected GDP per-capita growth. Through an analysis of hidden potentials, demand hotspots, and market conditions that are most favorable to success, this method enables firms to focus on target countries, maximize returns, and global expansion with data, backed by accuracy.
By factoring in the projected importer demand gap that is currently unmet and could be potential opportunity, it identifies the potential for the Exporter (Country) among 190 countries, against the general trade analysis, which identifies the biggest importer or exporter.
To discover high-growth global markets and optimize your business strategy:
Click Here
Pricing
- Single User License$ 1,995
- Department License$ 2,400
- Site License$ 3,120
- Global License$ 3,795

Leadership Perspectives from Industry Events
Search
Thought Leadership and Analyst Meet


Our Clients
6WResearch In News
- Doha a strategic location for EV manufacturing hub: IPA Qatar
- Demand for luxury TVs surging in the GCC, says Samsung
- Empowering Growth: The Thriving Journey of Bangladesh’s Cable Industry
- Demand for luxury TVs surging in the GCC, says Samsung
- Video call with a traditional healer? Once unthinkable, it’s now common in South Africa
- Intelligent Buildings To Smooth GCC’s Path To Net Zero
Latest Reports
- Taiwan Airport Wireless Infrastructure Market (2026-2032)
- Vietnam Airport Wireless Infrastructure Market (2026-2032)
- Thailand Airport Wireless Infrastructure Market (2026-2032)
- South Korea Airport Wireless Infrastructure Market (2026-2032)
- Romania Airport Wireless Infrastructure Market (2026-2032)
- Qatar Airport Wireless Infrastructure Market (2026-2032)
- Philippines Airport Wireless Infrastructure Market (2026-2032)
- Japan Airport Wireless Infrastructure Market (2026-2032)
- Taiwan Airport Winter Services Market (2026-2032)
- Vietnam Airport Winter Services Market (2026-2032)
Industry Events and Analyst Meet

HIMTEX 2026

India Refining Summit 2026

India EV Show 2026

EV tech India Expo 2026

Auto Tech Asia 2026
Whitepaper
- Middle East & Africa Commercial Security Market Click here to view more.
- Middle East & Africa Fire Safety Systems & Equipment Market Click here to view more.
- GCC Drone Market Click here to view more.
- Middle East Lighting Fixture Market Click here to view more.
- GCC Physical & Perimeter Security Market Click here to view more.