Estonia Knitwear Market (2026-2032) | Segmentation, Companies, Outlook, Size, Forecast, Growth, Trends, Analysis, Revenue, Value, Share & Industry
Market Forecast By Product Type (Innerwear, T-Shirts & Shirts, Sweaters & Jackets, Sweatshirts & Hoodies, Shorts & Trousers, Evening Dresses, Suits, & Leggings, Accessories), By Material Type (Natural, Synthetic, Blended), By Applications (Outerwear, Innerwear, Sportswear, Others), By Consumer Group (Men, Women, Kids), By Distribution Channel (Online , Offline) And Competitive Landscape
| Product Code: ETC5376690 | Publication Date: Nov 2023 | Updated Date: Apr 2026 | Product Type: Market Research Report | |
| Publisher: 6Wresearch | Author: Ravi Bhandari | No. of Pages: 60 | No. of Figures: 30 | No. of Tables: 5 |
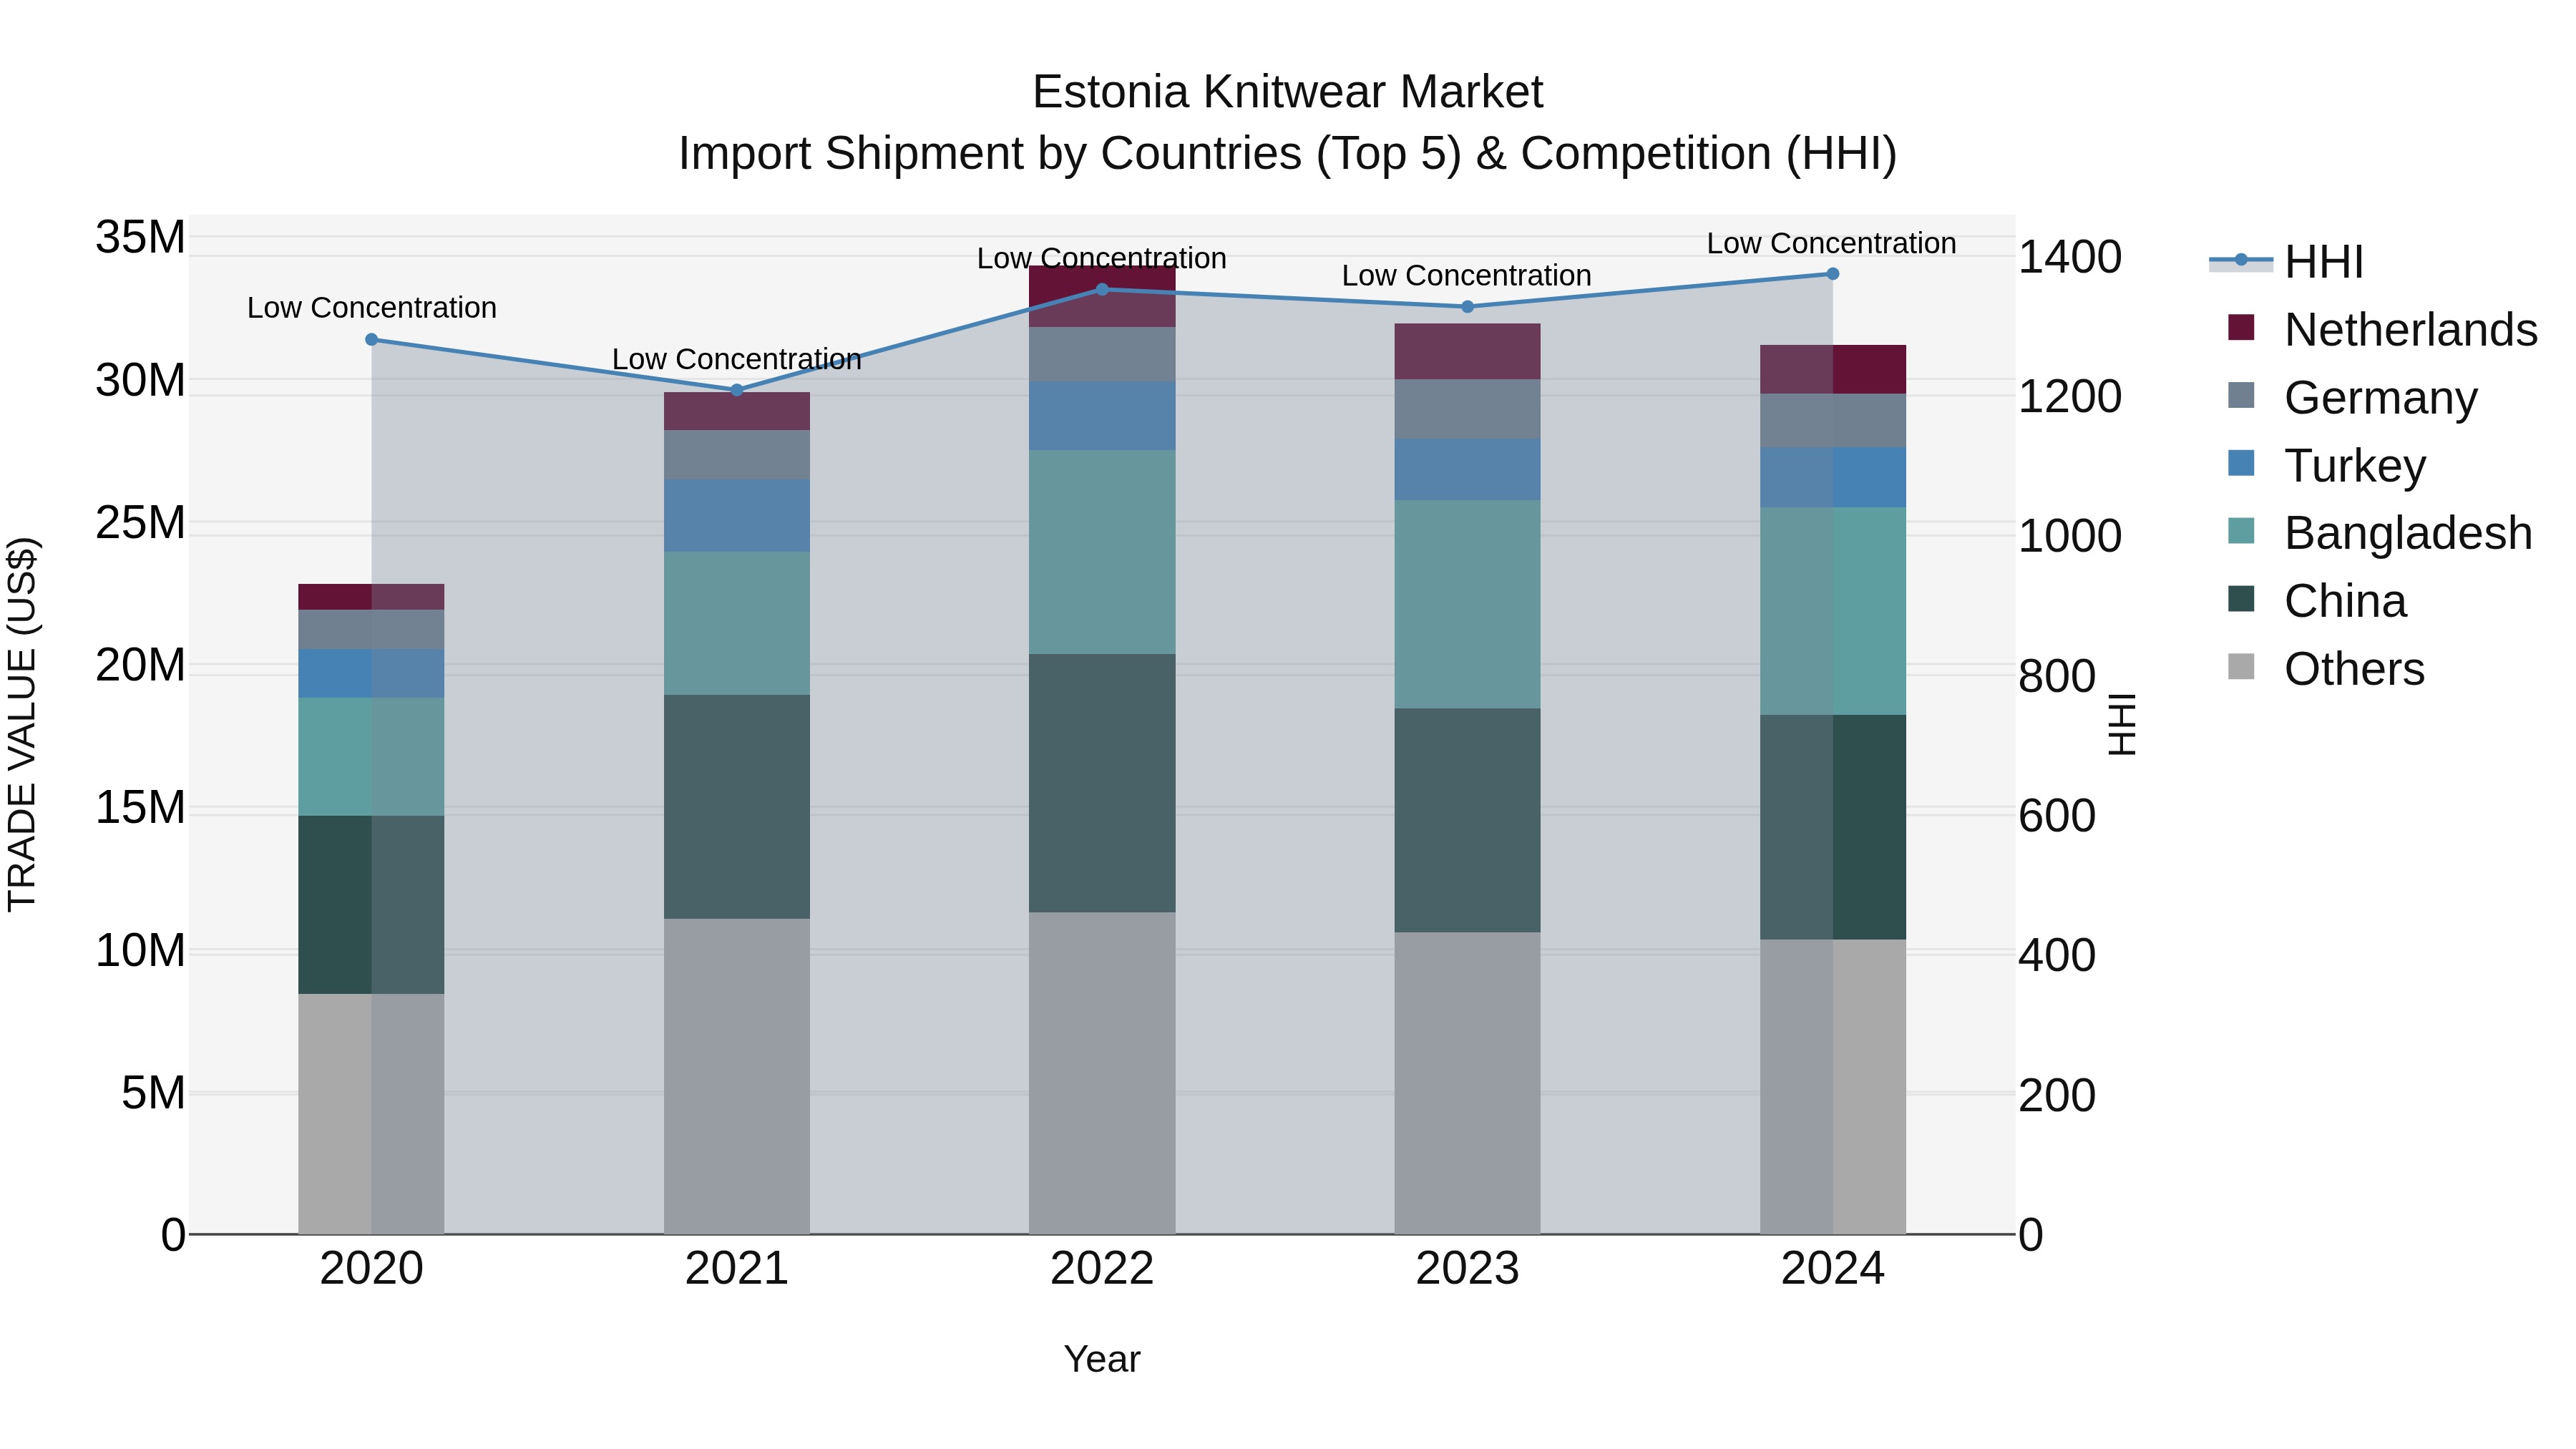
Estonia Knitwear Market Top 5 Importing Countries and Market Competition (HHI) Analysis
In 2024, Estonia saw a steady flow of knitwear imports, with top suppliers including China, Bangladesh, Turkey, Germany, and the Netherlands. The market exhibited low concentration, indicating a diverse range of sources for knitwear products. Despite a slight decline in growth rate from 2023 to 2024, the compound annual growth rate (CAGR) over the period from 2020 to 2024 remained strong at 8.15%. This data suggests a resilient market for knitwear imports in Estonia, with a healthy mix of suppliers contributing to its growth.
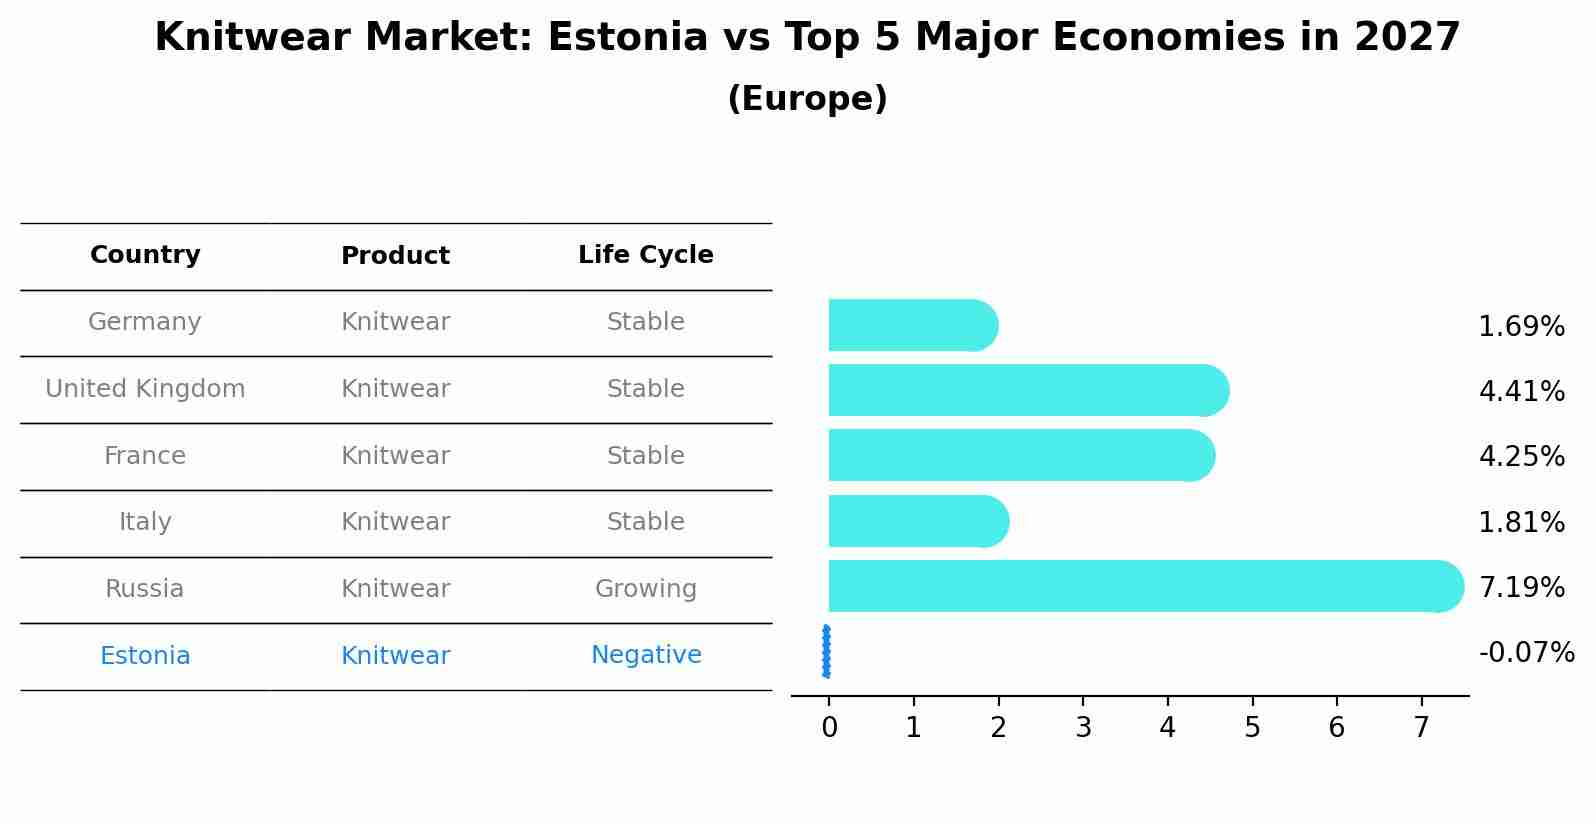
Knitwear Market: Estonia vs Top 5 Major Economies in 2027 (Europe)
The Knitwear market in Estonia is projected to grow at a negative growth rate of -0.07% by 2027, within the Europe region led by Germany, along with other countries like United Kingdom, France, Italy and Russia, collectively shaping a dynamic and evolving market environment driven by innovation and increasing adoption of emerging technologies.
Key Highlights of the Report:
- Estonia Knitwear Market Outlook
- Market Size of Estonia Knitwear Market, 2025
- Forecast of Estonia Knitwear Market, 2032
- Historical Data and Forecast of Estonia Knitwear Revenues & Volume for the Period 2022 - 2032F
- Estonia Knitwear Market Trend Evolution
- Estonia Knitwear Market Drivers and Challenges
- Estonia Knitwear Price Trends
- Estonia Knitwear Porter`s Five Forces
- Estonia Knitwear Industry Life Cycle
- Historical Data and Forecast of Estonia Knitwear Market Revenues & Volume By Product Type for the Period 2022 - 2032F
- Historical Data and Forecast of Estonia Knitwear Market Revenues & Volume By Innerwear for the Period 2022 - 2032F
- Historical Data and Forecast of Estonia Knitwear Market Revenues & Volume By T-Shirts & Shirts for the Period 2022 - 2032F
- Historical Data and Forecast of Estonia Knitwear Market Revenues & Volume By Sweaters & Jackets for the Period 2022 - 2032F
- Historical Data and Forecast of Estonia Knitwear Market Revenues & Volume By Sweatshirts & Hoodies for the Period 2022 - 2032F
- Historical Data and Forecast of Estonia Knitwear Market Revenues & Volume By Shorts & Trousers for the Period 2022 - 2032F
- Historical Data and Forecast of Estonia Knitwear Market Revenues & Volume By Evening Dresses, Suits, & Leggings for the Period 2022 - 2032F
- Historical Data and Forecast of Estonia Knitwear Market Revenues & Volume By Accessories for the Period 2022 - 2032F
- Historical Data and Forecast of Estonia Knitwear Market Revenues & Volume By Material Type for the Period 2022 - 2032F
- Historical Data and Forecast of Estonia Knitwear Market Revenues & Volume By Natural for the Period 2022 - 2032F
- Historical Data and Forecast of Estonia Knitwear Market Revenues & Volume By Synthetic for the Period 2022 - 2032F
- Historical Data and Forecast of Estonia Knitwear Market Revenues & Volume By Blended for the Period 2022 - 2032F
- Historical Data and Forecast of Estonia Knitwear Market Revenues & Volume By Applications for the Period 2022 - 2032F
- Historical Data and Forecast of Estonia Knitwear Market Revenues & Volume By Outerwear for the Period 2022 - 2032F
- Historical Data and Forecast of Estonia Knitwear Market Revenues & Volume By Innerwear for the Period 2022 - 2032F
- Historical Data and Forecast of Estonia Knitwear Market Revenues & Volume By Sportswear for the Period 2022 - 2032F
- Historical Data and Forecast of Estonia Knitwear Market Revenues & Volume By Others for the Period 2022 - 2032F
- Historical Data and Forecast of Estonia Knitwear Market Revenues & Volume By Consumer Group for the Period 2022 - 2032F
- Historical Data and Forecast of Estonia Knitwear Market Revenues & Volume By Men for the Period 2022 - 2032F
- Historical Data and Forecast of Estonia Knitwear Market Revenues & Volume By Women for the Period 2022 - 2032F
- Historical Data and Forecast of Estonia Knitwear Market Revenues & Volume By Kids for the Period 2022 - 2032F
- Historical Data and Forecast of Estonia Knitwear Market Revenues & Volume By Distribution Channel for the Period 2022 - 2032F
- Historical Data and Forecast of Estonia Knitwear Market Revenues & Volume By Online for the Period 2022 - 2032F
- Historical Data and Forecast of Estonia Knitwear Market Revenues & Volume By Offline for the Period 2022 - 2032F
- Estonia Knitwear Import Export Trade Statistics
- Market Opportunity Assessment By Product Type
- Market Opportunity Assessment By Material Type
- Market Opportunity Assessment By Applications
- Market Opportunity Assessment By Consumer Group
- Market Opportunity Assessment By Distribution Channel
- Estonia Knitwear Top Companies Market Share
- Estonia Knitwear Competitive Benchmarking By Technical and Operational Parameters
- Estonia Knitwear Company Profiles
- Estonia Knitwear Key Strategic Recommendations
Frequently Asked Questions About the Market Study (FAQs):
6Wresearch actively monitors the Estonia Knitwear Market and publishes its comprehensive annual report, highlighting emerging trends, growth drivers, revenue analysis, and forecast outlook. Our insights help businesses to make data-backed strategic decisions with ongoing market dynamics. Our analysts track relevent industries related to the Estonia Knitwear Market, allowing our clients with actionable intelligence and reliable forecasts tailored to emerging regional needs.
Yes, we provide customisation as per your requirements. To learn more, feel free to contact us on sales@6wresearch.com
1 Executive Summary |
2 Introduction |
2.1 Key Highlights of the Report |
2.2 Report Description |
2.3 Market Scope & Segmentation |
2.4 Research Methodology |
2.5 Assumptions |
3 Estonia Knitwear Market Overview |
3.1 Estonia Country Macro Economic Indicators |
3.2 Estonia Knitwear Market Revenues & Volume, 2022 & 2032F |
3.3 Estonia Knitwear Market - Industry Life Cycle |
3.4 Estonia Knitwear Market - Porter's Five Forces |
3.5 Estonia Knitwear Market Revenues & Volume Share, By Product Type, 2022 & 2032F |
3.6 Estonia Knitwear Market Revenues & Volume Share, By Material Type, 2022 & 2032F |
3.7 Estonia Knitwear Market Revenues & Volume Share, By Applications, 2022 & 2032F |
3.8 Estonia Knitwear Market Revenues & Volume Share, By Consumer Group, 2022 & 2032F |
3.9 Estonia Knitwear Market Revenues & Volume Share, By Distribution Channel, 2022 & 2032F |
4 Estonia Knitwear Market Dynamics |
4.1 Impact Analysis |
4.2 Market Drivers |
4.2.1 Growing popularity of sustainable and eco-friendly fashion choices |
4.2.2 Increasing disposable income and changing consumer preferences |
4.2.3 Rise in online retail channels and e-commerce platforms |
4.3 Market Restraints |
4.3.1 Intense competition from international knitwear brands |
4.3.2 Fluctuating raw material prices and supply chain disruptions |
5 Estonia Knitwear Market Trends |
6 Estonia Knitwear Market Segmentations |
6.1 Estonia Knitwear Market, By Product Type |
6.1.1 Overview and Analysis |
6.1.2 Estonia Knitwear Market Revenues & Volume, By Innerwear, 2022 - 2032F |
6.1.3 Estonia Knitwear Market Revenues & Volume, By T-Shirts & Shirts, 2022 - 2032F |
6.1.4 Estonia Knitwear Market Revenues & Volume, By Sweaters & Jackets, 2022 - 2032F |
6.1.5 Estonia Knitwear Market Revenues & Volume, By Sweatshirts & Hoodies, 2022 - 2032F |
6.1.6 Estonia Knitwear Market Revenues & Volume, By Shorts & Trousers, 2022 - 2032F |
6.1.7 Estonia Knitwear Market Revenues & Volume, By Evening Dresses, Suits, & Leggings, 2022 - 2032F |
6.2 Estonia Knitwear Market, By Material Type |
6.2.1 Overview and Analysis |
6.2.2 Estonia Knitwear Market Revenues & Volume, By Natural, 2022 - 2032F |
6.2.3 Estonia Knitwear Market Revenues & Volume, By Synthetic, 2022 - 2032F |
6.2.4 Estonia Knitwear Market Revenues & Volume, By Blended, 2022 - 2032F |
6.3 Estonia Knitwear Market, By Applications |
6.3.1 Overview and Analysis |
6.3.2 Estonia Knitwear Market Revenues & Volume, By Outerwear, 2022 - 2032F |
6.3.3 Estonia Knitwear Market Revenues & Volume, By Innerwear, 2022 - 2032F |
6.3.4 Estonia Knitwear Market Revenues & Volume, By Sportswear, 2022 - 2032F |
6.3.5 Estonia Knitwear Market Revenues & Volume, By Others, 2022 - 2032F |
6.4 Estonia Knitwear Market, By Consumer Group |
6.4.1 Overview and Analysis |
6.4.2 Estonia Knitwear Market Revenues & Volume, By Men, 2022 - 2032F |
6.4.3 Estonia Knitwear Market Revenues & Volume, By Women, 2022 - 2032F |
6.4.4 Estonia Knitwear Market Revenues & Volume, By Kids, 2022 - 2032F |
6.5 Estonia Knitwear Market, By Distribution Channel |
6.5.1 Overview and Analysis |
6.5.2 Estonia Knitwear Market Revenues & Volume, By Online , 2022 - 2032F |
6.5.3 Estonia Knitwear Market Revenues & Volume, By Offline, 2022 - 2032F |
7 Estonia Knitwear Market Import-Export Trade Statistics |
7.1 Estonia Knitwear Market Export to Major Countries |
7.2 Estonia Knitwear Market Imports from Major Countries |
8 Estonia Knitwear Market Key Performance Indicators |
8.1 Percentage of sales generated through online channels |
8.2 Number of new sustainable knitwear collections launched |
8.3 Customer satisfaction score for knitwear products |
8.4 Average production cost per unit |
8.5 Percentage of revenue reinvested in research and development for innovative knitwear designs |
9 Estonia Knitwear Market - Opportunity Assessment |
9.1 Estonia Knitwear Market Opportunity Assessment, By Product Type, 2022 & 2032F |
9.2 Estonia Knitwear Market Opportunity Assessment, By Material Type, 2022 & 2032F |
9.3 Estonia Knitwear Market Opportunity Assessment, By Applications, 2022 & 2032F |
9.4 Estonia Knitwear Market Opportunity Assessment, By Consumer Group, 2022 & 2032F |
9.5 Estonia Knitwear Market Opportunity Assessment, By Distribution Channel, 2022 & 2032F |
10 Estonia Knitwear Market - Competitive Landscape |
10.1 Estonia Knitwear Market Revenue Share, By Companies, 2025 |
10.2 Estonia Knitwear Market Competitive Benchmarking, By Operating and Technical Parameters |
11 Company Profiles |
12 Recommendations | 13 Disclaimer |
Global Go To Market Strategy - 2030
Export potential enables firms to identify high-growth global markets with greater confidence by combining advanced trade intelligence with a structured quantitative methodology. The framework analyzes emerging demand trends and country-level import patterns while integrating macroeconomic and trade datasets such as GDP and population forecasts, bilateral import–export flows, tariff structures, elasticity differentials between developed and developing economies, geographic distance, and import demand projections. Using weighted trade values from 2020–2024 as the base period to project country-to-country export potential for 2030, these inputs are operationalized through calculated drivers such as gravity model parameters, tariff impact factors, and projected GDP per-capita growth. Through an analysis of hidden potentials, demand hotspots, and market conditions that are most favorable to success, this method enables firms to focus on target countries, maximize returns, and global expansion with data, backed by accuracy.
By factoring in the projected importer demand gap that is currently unmet and could be potential opportunity, it identifies the potential for the Exporter (Country) among 190 countries, against the general trade analysis, which identifies the biggest importer or exporter.
To discover high-growth global markets and optimize your business strategy:
Click Here
Pricing
- Single User License$ 1,995
- Department License$ 2,400
- Site License$ 3,120
- Global License$ 3,795

Leadership Perspectives from Industry Events
Search
Thought Leadership and Analyst Meet


Our Clients
6WResearch In News
- Doha a strategic location for EV manufacturing hub: IPA Qatar
- Demand for luxury TVs surging in the GCC, says Samsung
- Empowering Growth: The Thriving Journey of Bangladesh’s Cable Industry
- Demand for luxury TVs surging in the GCC, says Samsung
- Video call with a traditional healer? Once unthinkable, it’s now common in South Africa
- Intelligent Buildings To Smooth GCC’s Path To Net Zero
Latest Reports
- Taiwan Airport Wireless Infrastructure Market (2026-2032)
- Vietnam Airport Wireless Infrastructure Market (2026-2032)
- Thailand Airport Wireless Infrastructure Market (2026-2032)
- South Korea Airport Wireless Infrastructure Market (2026-2032)
- Romania Airport Wireless Infrastructure Market (2026-2032)
- Qatar Airport Wireless Infrastructure Market (2026-2032)
- Philippines Airport Wireless Infrastructure Market (2026-2032)
- Japan Airport Wireless Infrastructure Market (2026-2032)
- Taiwan Airport Winter Services Market (2026-2032)
- Vietnam Airport Winter Services Market (2026-2032)
Industry Events and Analyst Meet

HIMTEX 2026

India Refining Summit 2026

India EV Show 2026

EV tech India Expo 2026

Auto Tech Asia 2026
Whitepaper
- Middle East & Africa Commercial Security Market Click here to view more.
- Middle East & Africa Fire Safety Systems & Equipment Market Click here to view more.
- GCC Drone Market Click here to view more.
- Middle East Lighting Fixture Market Click here to view more.
- GCC Physical & Perimeter Security Market Click here to view more.