Estonia NIBP Multi-Parameter Monitors Market (2026-2032) | Competitive, Segments, Opportunities, Segmentation, Industry, Companies, Pricing Analysis, Investment Trends, Strategic Insights, Growth, Revenue, Analysis, Strategy, Share, Forecast, Supply, Outlook, Size, Trends, Demand, Challenges, Restraints, Competition, Consumer Insights, Value, Drivers
Market Forecast By Device Type (Portable Monitors, Bedside Monitors, Wearable Monitors, Wireless Monitors, Handheld Monitors), By Parameter Monitored (Blood Pressure, Heart Rate, Oxygen Saturation, Temperature, Respiratory Rate), By End User (Hospitals, Specialty Clinics, Home Healthcare, Ambulatory Centers, Emergency Services) And Competitive Landscape
| Product Code: ETC12748575 | Publication Date: Apr 2025 | Updated Date: Apr 2026 | Product Type: Market Research Report | |
| Publisher: 6Wresearch | Author: Sachin Kumar Rai | No. of Pages: 65 | No. of Figures: 34 | No. of Tables: 19 |
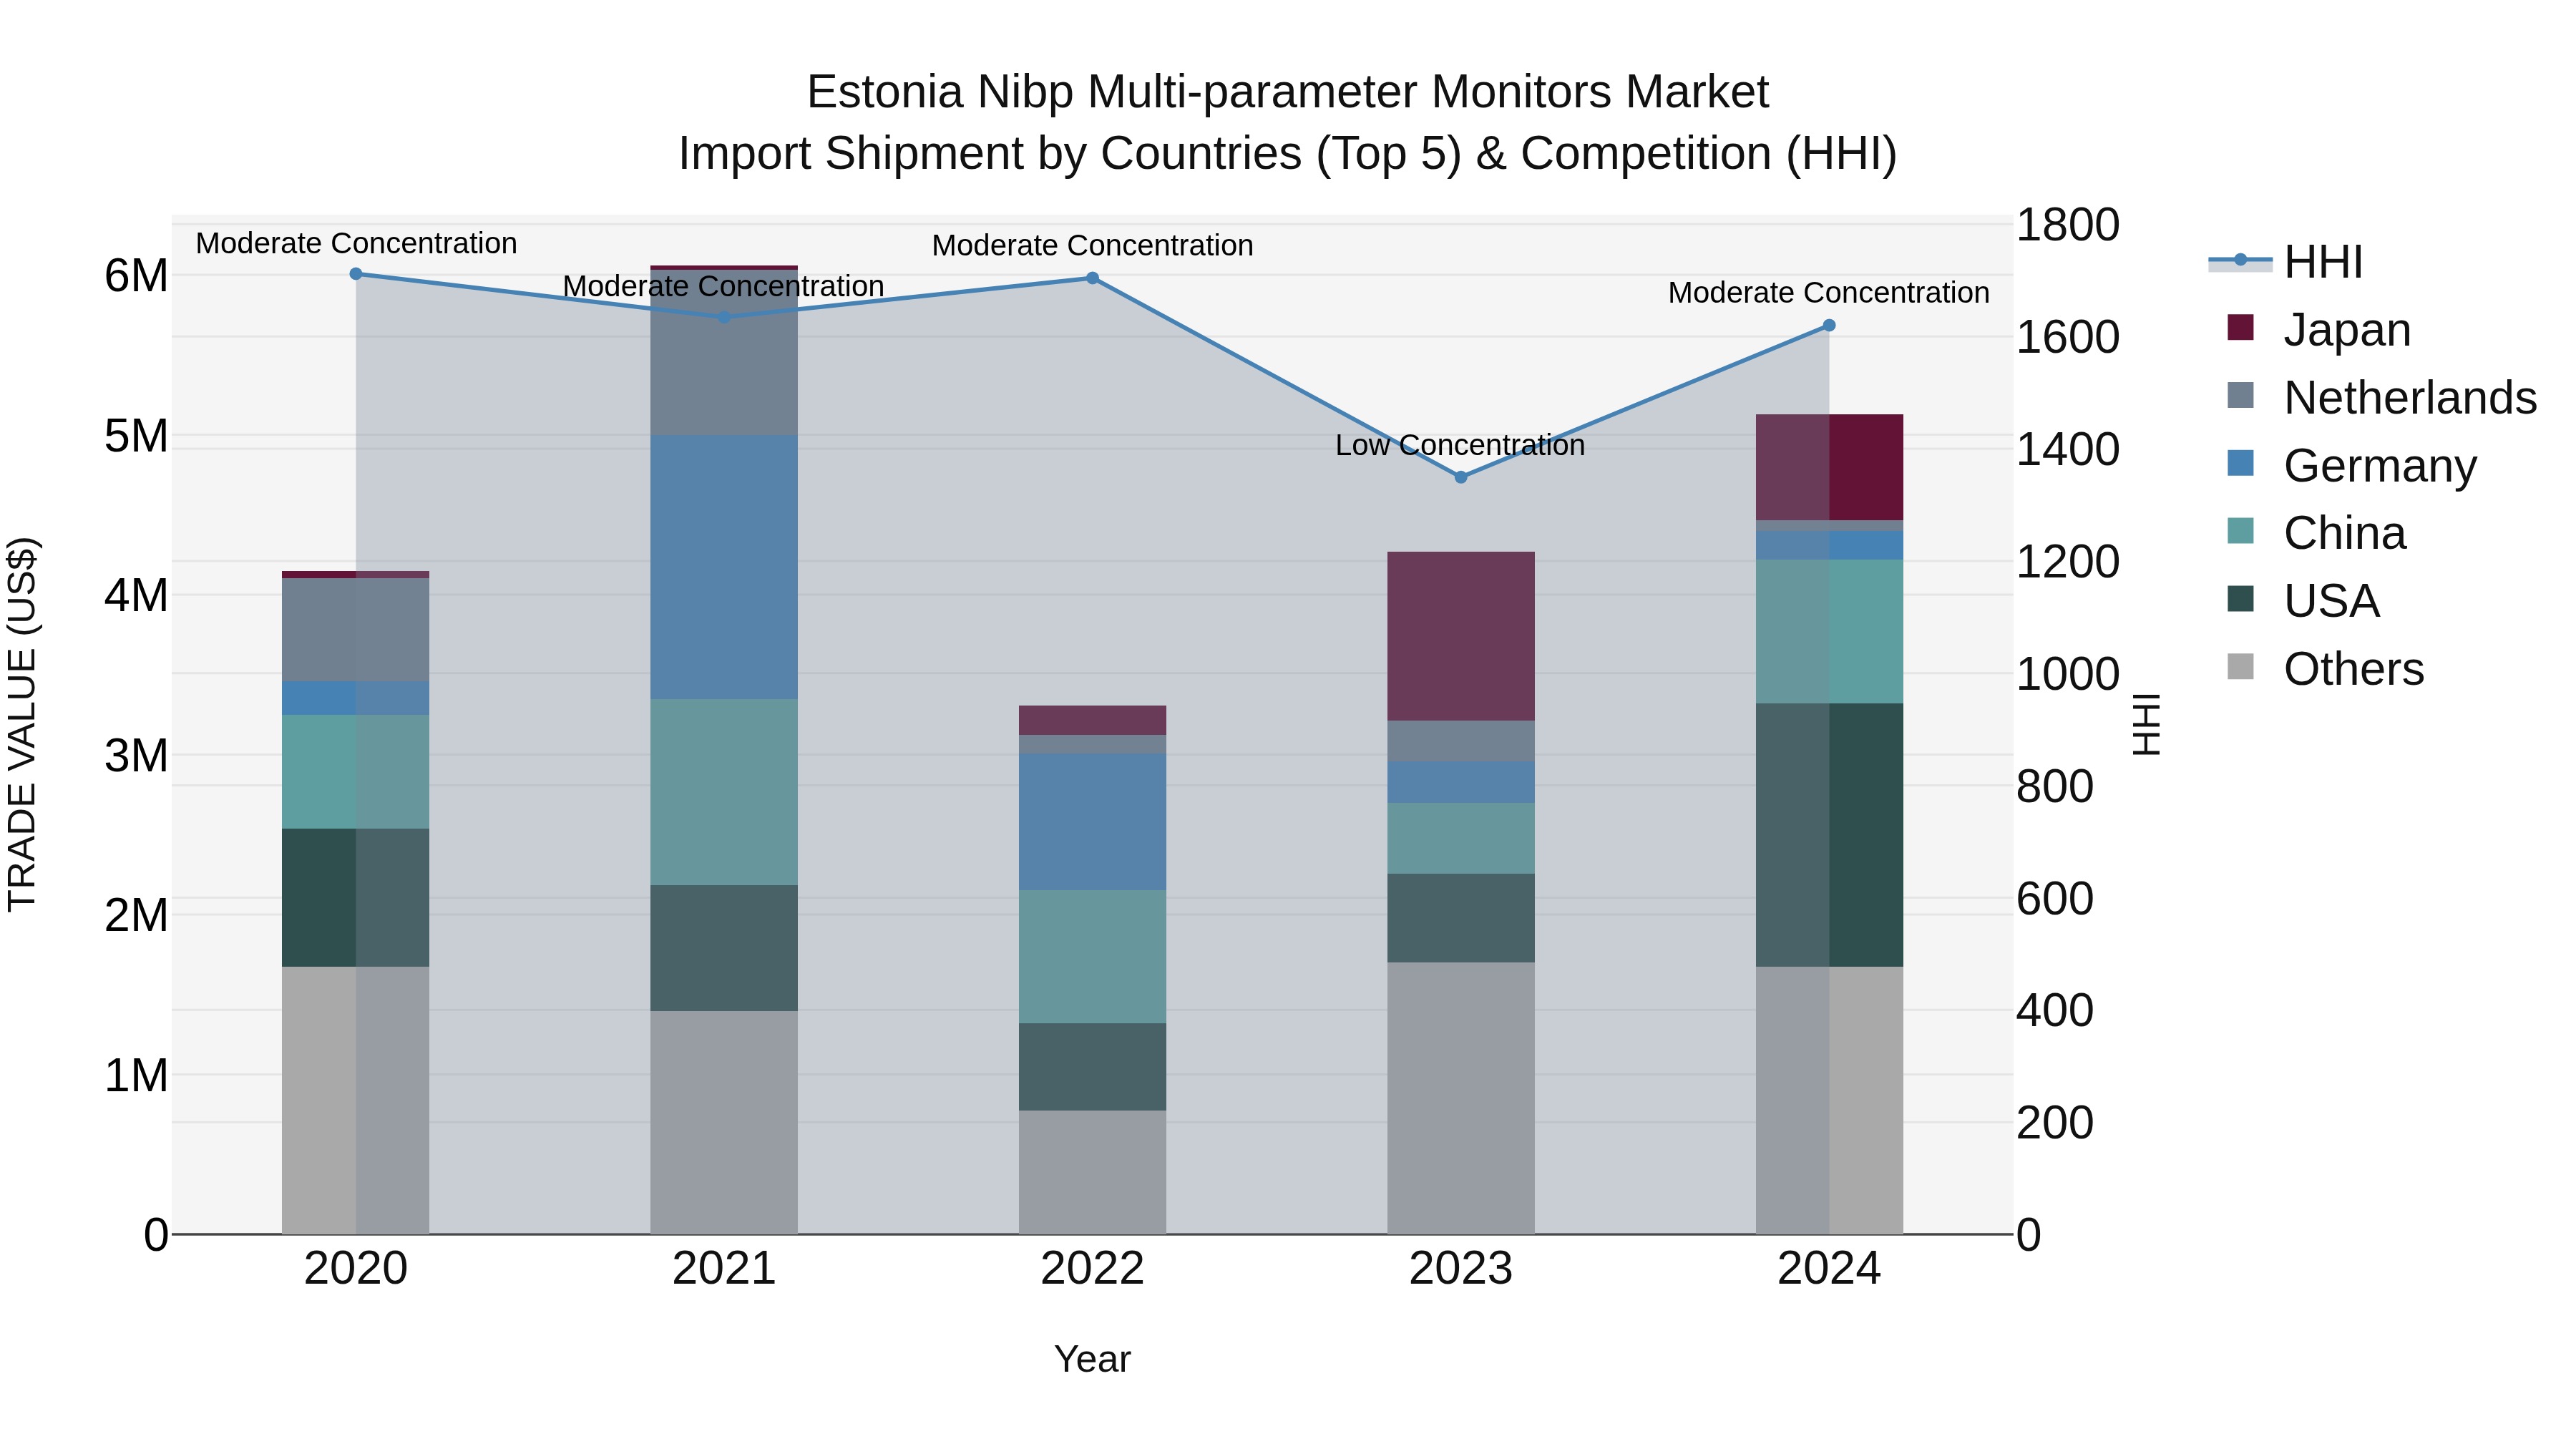
Estonia Nibp Multi-parameter Monitors Market Top 5 Importing Countries and Market Competition (HHI) Analysis
Estonia`s import shipments of NIBP multi-parameter monitors in 2024 saw significant growth, with the top exporting countries being the USA, China, Japan, Other Europe, and Israel. The market concentration, as measured by HHI, shifted from low to moderate in 2024, indicating increased competition among suppliers. The compound annual growth rate (CAGR) for the period 2020-2024 was a steady 5.46%, while the growth rate from 2023 to 2024 spiked at an impressive 20.18%. This data suggests a robust market for NIBP multi-parameter monitors in Estonia, driven by diverse international suppliers and strong demand.
Key Highlights of the Report:
- Estonia NIBP Multi-Parameter Monitors Market Outlook
- Market Size of Estonia NIBP Multi-Parameter Monitors Market, 2025
- Forecast of Estonia NIBP Multi-Parameter Monitors Market, 2032
- Historical Data and Forecast of Estonia NIBP Multi-Parameter Monitors Revenues & Volume for the Period 2022 - 2032F
- Estonia NIBP Multi-Parameter Monitors Market Trend Evolution
- Estonia NIBP Multi-Parameter Monitors Market Drivers and Challenges
- Estonia NIBP Multi-Parameter Monitors Price Trends
- Estonia NIBP Multi-Parameter Monitors Porter's Five Forces
- Estonia NIBP Multi-Parameter Monitors Industry Life Cycle
- Historical Data and Forecast of Estonia NIBP Multi-Parameter Monitors Market Revenues & Volume By Device Type for the Period 2022 - 2032F
- Historical Data and Forecast of Estonia NIBP Multi-Parameter Monitors Market Revenues & Volume By Portable Monitors for the Period 2022 - 2032F
- Historical Data and Forecast of Estonia NIBP Multi-Parameter Monitors Market Revenues & Volume By Bedside Monitors for the Period 2022 - 2032F
- Historical Data and Forecast of Estonia NIBP Multi-Parameter Monitors Market Revenues & Volume By Wearable Monitors for the Period 2022 - 2032F
- Historical Data and Forecast of Estonia NIBP Multi-Parameter Monitors Market Revenues & Volume By Wireless Monitors for the Period 2022 - 2032F
- Historical Data and Forecast of Estonia NIBP Multi-Parameter Monitors Market Revenues & Volume By Handheld Monitors for the Period 2022 - 2032F
- Historical Data and Forecast of Estonia NIBP Multi-Parameter Monitors Market Revenues & Volume By Parameter Monitored for the Period 2022 - 2032F
- Historical Data and Forecast of Estonia NIBP Multi-Parameter Monitors Market Revenues & Volume By Blood Pressure for the Period 2022 - 2032F
- Historical Data and Forecast of Estonia NIBP Multi-Parameter Monitors Market Revenues & Volume By Heart Rate for the Period 2022 - 2032F
- Historical Data and Forecast of Estonia NIBP Multi-Parameter Monitors Market Revenues & Volume By Oxygen Saturation for the Period 2022 - 2032F
- Historical Data and Forecast of Estonia NIBP Multi-Parameter Monitors Market Revenues & Volume By Temperature for the Period 2022 - 2032F
- Historical Data and Forecast of Estonia NIBP Multi-Parameter Monitors Market Revenues & Volume By Respiratory Rate for the Period 2022 - 2032F
- Historical Data and Forecast of Estonia NIBP Multi-Parameter Monitors Market Revenues & Volume By End User for the Period 2022 - 2032F
- Historical Data and Forecast of Estonia NIBP Multi-Parameter Monitors Market Revenues & Volume By Hospitals for the Period 2022 - 2032F
- Historical Data and Forecast of Estonia NIBP Multi-Parameter Monitors Market Revenues & Volume By Specialty Clinics for the Period 2022 - 2032F
- Historical Data and Forecast of Estonia NIBP Multi-Parameter Monitors Market Revenues & Volume By Home Healthcare for the Period 2022 - 2032F
- Historical Data and Forecast of Estonia NIBP Multi-Parameter Monitors Market Revenues & Volume By Ambulatory Centers for the Period 2022 - 2032F
- Historical Data and Forecast of Estonia NIBP Multi-Parameter Monitors Market Revenues & Volume By Emergency Services for the Period 2022 - 2032F
- Estonia NIBP Multi-Parameter Monitors Import Export Trade Statistics
- Market Opportunity Assessment By Device Type
- Market Opportunity Assessment By Parameter Monitored
- Market Opportunity Assessment By End User
- Estonia NIBP Multi-Parameter Monitors Top Companies Market Share
- Estonia NIBP Multi-Parameter Monitors Competitive Benchmarking By Technical and Operational Parameters
- Estonia NIBP Multi-Parameter Monitors Company Profiles
- Estonia NIBP Multi-Parameter Monitors Key Strategic Recommendations
Frequently Asked Questions About the Market Study (FAQs):
6Wresearch actively monitors the Estonia NIBP Multi-Parameter Monitors Market and publishes its comprehensive annual report, highlighting emerging trends, growth drivers, revenue analysis, and forecast outlook. Our insights help businesses to make data-backed strategic decisions with ongoing market dynamics. Our analysts track relevent industries related to the Estonia NIBP Multi-Parameter Monitors Market, allowing our clients with actionable intelligence and reliable forecasts tailored to emerging regional needs.
Yes, we provide customisation as per your requirements. To learn more, feel free to contact us on sales@6wresearch.com
1 Executive Summary |
2 Introduction |
2.1 Key Highlights of the Report |
2.2 Report Description |
2.3 Market Scope & Segmentation |
2.4 Research Methodology |
2.5 Assumptions |
3 Estonia NIBP Multi-Parameter Monitors Market Overview |
3.1 Estonia Country Macro Economic Indicators |
3.2 Estonia NIBP Multi-Parameter Monitors Market Revenues & Volume, 2022 & 2032F |
3.3 Estonia NIBP Multi-Parameter Monitors Market - Industry Life Cycle |
3.4 Estonia NIBP Multi-Parameter Monitors Market - Porter's Five Forces |
3.5 Estonia NIBP Multi-Parameter Monitors Market Revenues & Volume Share, By Device Type, 2022 & 2032F |
3.6 Estonia NIBP Multi-Parameter Monitors Market Revenues & Volume Share, By Parameter Monitored, 2022 & 2032F |
3.7 Estonia NIBP Multi-Parameter Monitors Market Revenues & Volume Share, By End User, 2022 & 2032F |
4 Estonia NIBP Multi-Parameter Monitors Market Dynamics |
4.1 Impact Analysis |
4.2 Market Drivers |
4.2.1 Increasing prevalence of chronic diseases and the need for continuous monitoring of patients' vital signs |
4.2.2 Technological advancements in multi-parameter monitors leading to improved accuracy and efficiency |
4.2.3 Growing emphasis on early detection and prevention of health issues |
4.3 Market Restraints |
4.3.1 High initial costs associated with acquiring and implementing multi-parameter monitors |
4.3.2 Limited awareness and adoption of advanced monitoring technologies in healthcare facilities |
4.3.3 Stringent regulatory requirements and standards for medical devices |
5 Estonia NIBP Multi-Parameter Monitors Market Trends |
6 Estonia NIBP Multi-Parameter Monitors Market, By Types |
6.1 Estonia NIBP Multi-Parameter Monitors Market, By Device Type |
6.1.1 Overview and Analysis |
6.1.2 Estonia NIBP Multi-Parameter Monitors Market Revenues & Volume, By Device Type, 2022 - 2032F |
6.1.3 Estonia NIBP Multi-Parameter Monitors Market Revenues & Volume, By Portable Monitors, 2022 - 2032F |
6.1.4 Estonia NIBP Multi-Parameter Monitors Market Revenues & Volume, By Bedside Monitors, 2022 - 2032F |
6.1.5 Estonia NIBP Multi-Parameter Monitors Market Revenues & Volume, By Wearable Monitors, 2022 - 2032F |
6.1.6 Estonia NIBP Multi-Parameter Monitors Market Revenues & Volume, By Wireless Monitors, 2022 - 2032F |
6.1.7 Estonia NIBP Multi-Parameter Monitors Market Revenues & Volume, By Handheld Monitors, 2022 - 2032F |
6.2 Estonia NIBP Multi-Parameter Monitors Market, By Parameter Monitored |
6.2.1 Overview and Analysis |
6.2.2 Estonia NIBP Multi-Parameter Monitors Market Revenues & Volume, By Blood Pressure, 2022 - 2032F |
6.2.3 Estonia NIBP Multi-Parameter Monitors Market Revenues & Volume, By Heart Rate, 2022 - 2032F |
6.2.4 Estonia NIBP Multi-Parameter Monitors Market Revenues & Volume, By Oxygen Saturation, 2022 - 2032F |
6.2.5 Estonia NIBP Multi-Parameter Monitors Market Revenues & Volume, By Temperature, 2022 - 2032F |
6.2.6 Estonia NIBP Multi-Parameter Monitors Market Revenues & Volume, By Respiratory Rate, 2022 - 2032F |
6.3 Estonia NIBP Multi-Parameter Monitors Market, By End User |
6.3.1 Overview and Analysis |
6.3.2 Estonia NIBP Multi-Parameter Monitors Market Revenues & Volume, By Hospitals, 2022 - 2032F |
6.3.3 Estonia NIBP Multi-Parameter Monitors Market Revenues & Volume, By Specialty Clinics, 2022 - 2032F |
6.3.4 Estonia NIBP Multi-Parameter Monitors Market Revenues & Volume, By Home Healthcare, 2022 - 2032F |
6.3.5 Estonia NIBP Multi-Parameter Monitors Market Revenues & Volume, By Ambulatory Centers, 2022 - 2032F |
6.3.6 Estonia NIBP Multi-Parameter Monitors Market Revenues & Volume, By Emergency Services, 2022 - 2032F |
7 Estonia NIBP Multi-Parameter Monitors Market Import-Export Trade Statistics |
7.1 Estonia NIBP Multi-Parameter Monitors Market Export to Major Countries |
7.2 Estonia NIBP Multi-Parameter Monitors Market Imports from Major Countries |
8 Estonia NIBP Multi-Parameter Monitors Market Key Performance Indicators |
8.1 Percentage increase in the adoption of multi-parameter monitors in healthcare facilities |
8.2 Average time saved in patient monitoring and data analysis with the use of advanced multi-parameter monitors |
8.3 Percentage reduction in medical errors and adverse events due to the implementation of multi-parameter monitors |
9 Estonia NIBP Multi-Parameter Monitors Market - Opportunity Assessment |
9.1 Estonia NIBP Multi-Parameter Monitors Market Opportunity Assessment, By Device Type, 2022 & 2032F |
9.2 Estonia NIBP Multi-Parameter Monitors Market Opportunity Assessment, By Parameter Monitored, 2022 & 2032F |
9.3 Estonia NIBP Multi-Parameter Monitors Market Opportunity Assessment, By End User, 2022 & 2032F |
10 Estonia NIBP Multi-Parameter Monitors Market - Competitive Landscape |
10.1 Estonia NIBP Multi-Parameter Monitors Market Revenue Share, By Companies, 2025 |
10.2 Estonia NIBP Multi-Parameter Monitors Market Competitive Benchmarking, By Operating and Technical Parameters |
11 Company Profiles |
12 Recommendations |
13 Disclaimer |
Export potential assessment - trade Analytics for 2030
Export potential enables firms to identify high-growth global markets with greater confidence by combining advanced trade intelligence with a structured quantitative methodology. The framework analyzes emerging demand trends and country-level import patterns while integrating macroeconomic and trade datasets such as GDP and population forecasts, bilateral import–export flows, tariff structures, elasticity differentials between developed and developing economies, geographic distance, and import demand projections. Using weighted trade values from 2020–2024 as the base period to project country-to-country export potential for 2030, these inputs are operationalized through calculated drivers such as gravity model parameters, tariff impact factors, and projected GDP per-capita growth. Through an analysis of hidden potentials, demand hotspots, and market conditions that are most favorable to success, this method enables firms to focus on target countries, maximize returns, and global expansion with data, backed by accuracy.
By factoring in the projected importer demand gap that is currently unmet and could be potential opportunity, it identifies the potential for the Exporter (Country) among 190 countries, against the general trade analysis, which identifies the biggest importer or exporter.
To discover high-growth global markets and optimize your business strategy:
Click Here
Pricing
- Single User License$ 1,995
- Department License$ 2,400
- Site License$ 3,120
- Global License$ 3,795

Search
Thought Leadership and Analyst Meet


Our Clients
Latest Reports
- Philippines Polyhydroxybutyrate-co-Hydroxyvalerate Market (2026-2032) | Trends, Insights, Challenges, Restraints, Competition, Size, Value, Forecast, Pricing, Share, Outlook, Revenue, Investment Opportunities, Strategy, Drivers, Demand, Growth, segmentation, Analysis, Companies
- Peru Polyhydroxybutyrate-co-Hydroxyvalerate Market (2026-2032) | Growth, Demand, Challenges, Share, Trends, Analysis, Pricing, Investment Opportunities, Drivers, Value, Forecast, Competition, Size, Companies, Insights, Outlook, Restraints, segmentation, Revenue, Strategy
- Pakistan Polyhydroxybutyrate-co-Hydroxyvalerate Market (2026-2032) | Restraints, segmentation, Pricing, Forecast, Share, Strategy, Competition, Trends, Insights, Drivers, Challenges, Growth, Revenue, Outlook, Value, Investment Opportunities, Companies, Size, Analysis, Demand
- Oman Polyhydroxybutyrate-co-Hydroxyvalerate Market (2026-2032) | Drivers, segmentation, Insights, Competition, Pricing, Outlook, Size, Revenue, Challenges, Forecast, Analysis, Growth, Value, Share, Trends, Investment Opportunities, Strategy, Restraints, Companies, Demand
- Nigeria Polyhydroxybutyrate-co-Hydroxyvalerate Market (2026-2032) | Value, Investment Opportunities, Analysis, Revenue, Restraints, Pricing, Outlook, Competition, Demand, Growth, Forecast, Companies, Trends, Challenges, segmentation, Drivers, Insights, Share, Size, Strategy
- Nepal Polyhydroxybutyrate-co-Hydroxyvalerate Market (2026-2032) | Insights, Analysis, Drivers, Share, Revenue, Demand, segmentation, Investment Opportunities, Competition, Forecast, Growth, Pricing, Companies, Strategy, Trends, Restraints, Challenges, Outlook, Size, Value
- Myanmar Polyhydroxybutyrate-co-Hydroxyvalerate Market (2026-2032) | Outlook, Revenue, Strategy, Restraints, Drivers, segmentation, Share, Forecast, Competition, Insights, Growth, Pricing, Size, Demand, Value, Companies, Trends, Challenges, Investment Opportunities, Analysis
- Morocco Polyhydroxybutyrate-co-Hydroxyvalerate Market (2026-2032) | Outlook, Investment Opportunities, Restraints, Strategy, Forecast, Challenges, Drivers, Growth, Companies, segmentation, Trends, Size, Competition, Revenue, Demand, Insights, Share, Analysis, Value, Pricing
- Mexico Polyhydroxybutyrate-co-Hydroxyvalerate Market (2026-2032) | Size, Drivers, Outlook, Share, Strategy, Growth, Pricing, Challenges, Companies, Demand, Value, Investment Opportunities, Restraints, Trends, Forecast, segmentation, Analysis, Insights, Competition, Revenue
- Malaysia Polyhydroxybutyrate-co-Hydroxyvalerate Market (2026-2032) | Share, segmentation, Size, Companies, Analysis, Insights, Forecast, Value, Revenue, Drivers, Restraints, Challenges, Investment Opportunities, Trends, Competition, Strategy, Demand, Growth, Outlook, Pricing
Industry Events and Analyst Meet

HIMTEX 2026

India Refining Summit 2026

India EV Show 2026

EV tech India Expo 2026

Auto Tech Asia 2026
Whitepaper
- Middle East & Africa Commercial Security Market Click here to view more.
- Middle East & Africa Fire Safety Systems & Equipment Market Click here to view more.
- GCC Drone Market Click here to view more.
- Middle East Lighting Fixture Market Click here to view more.
- GCC Physical & Perimeter Security Market Click here to view more.
6WResearch In News
- Doha a strategic location for EV manufacturing hub: IPA Qatar
- Demand for luxury TVs surging in the GCC, says Samsung
- Empowering Growth: The Thriving Journey of Bangladesh’s Cable Industry
- Demand for luxury TVs surging in the GCC, says Samsung
- Video call with a traditional healer? Once unthinkable, it’s now common in South Africa
- Intelligent Buildings To Smooth GCC’s Path To Net Zero