Estonia Particle Board Market (2026-2032) | Industry, Forecast, Companies, Revenue, Outlook, Size, Growth, Analysis, Share, Trends, Value & Segmentation
Market Forecast By Type (Standard Chipboard, Melamine Veneered Chipboard, Flooring Grade Chipboard, Wood Veneered Chipboard, Plastic Veneered Chipboard, Other), By Application (Construction, Furniture, Infrastructure, Other) And Competitive Landscape
| Product Code: ETC5226799 | Publication Date: Nov 2023 | Updated Date: Apr 2026 | Product Type: Market Research Report | |
| Publisher: 6Wresearch | Author: Shubham Padhi | No. of Pages: 60 | No. of Figures: 30 | No. of Tables: 5 |
Estonia Particle Board Market Size (2020-2030)
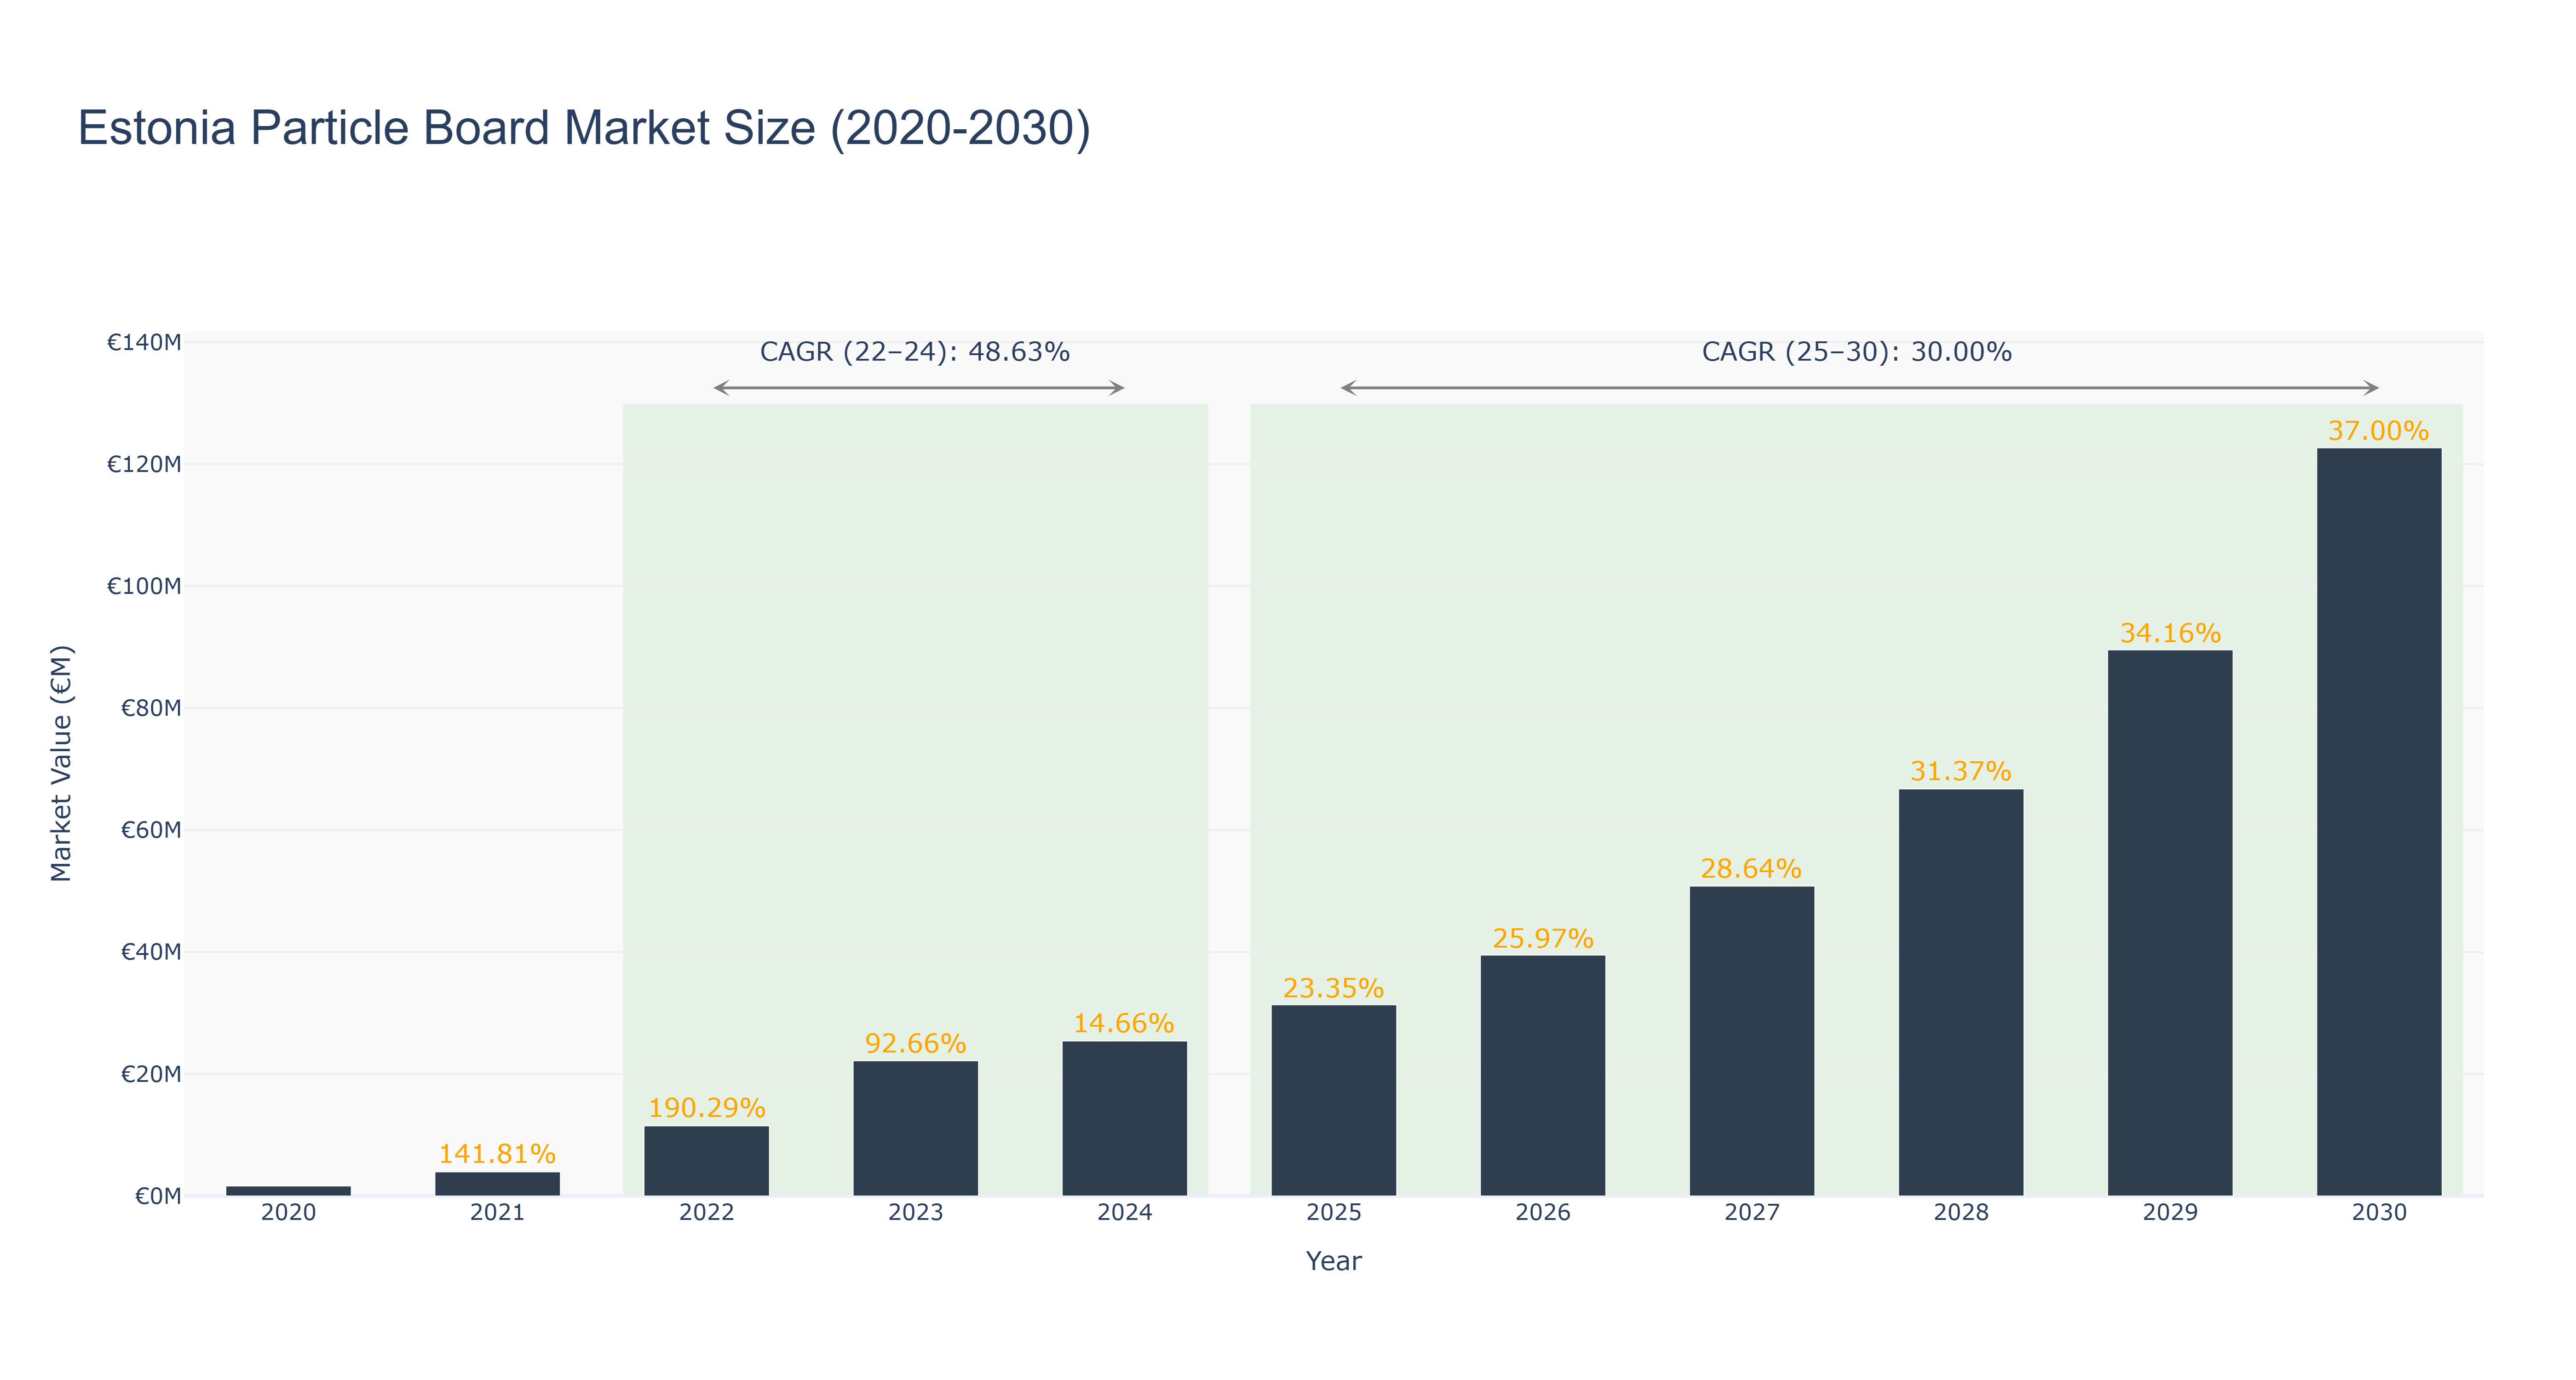
Estonia Particle Board Market has shown a remarkable growth trajectory in recent years. The market size surged from €1.64 million in 2020 to €25.42 million in 2024, experiencing a notable 48.63% CAGR. Subsequently, the market is forecasted to continue its upward trend, with an expected size of €122.68 million by 2030, driven by a steady 30.0% CAGR from 2025 onwards. The market's rapid expansion can be attributed to increasing demand for sustainable construction materials and the growing trend towards eco-friendly practices in the building industry. Looking ahead, Estonia is set to embark on a national initiative to promote the use of particle board in residential and commercial construction projects, further boosting market growth and solidifying its position as a key player in the particle board industry.
Estonia Particle Board Market: Production & Trade Performance (2019-2025)
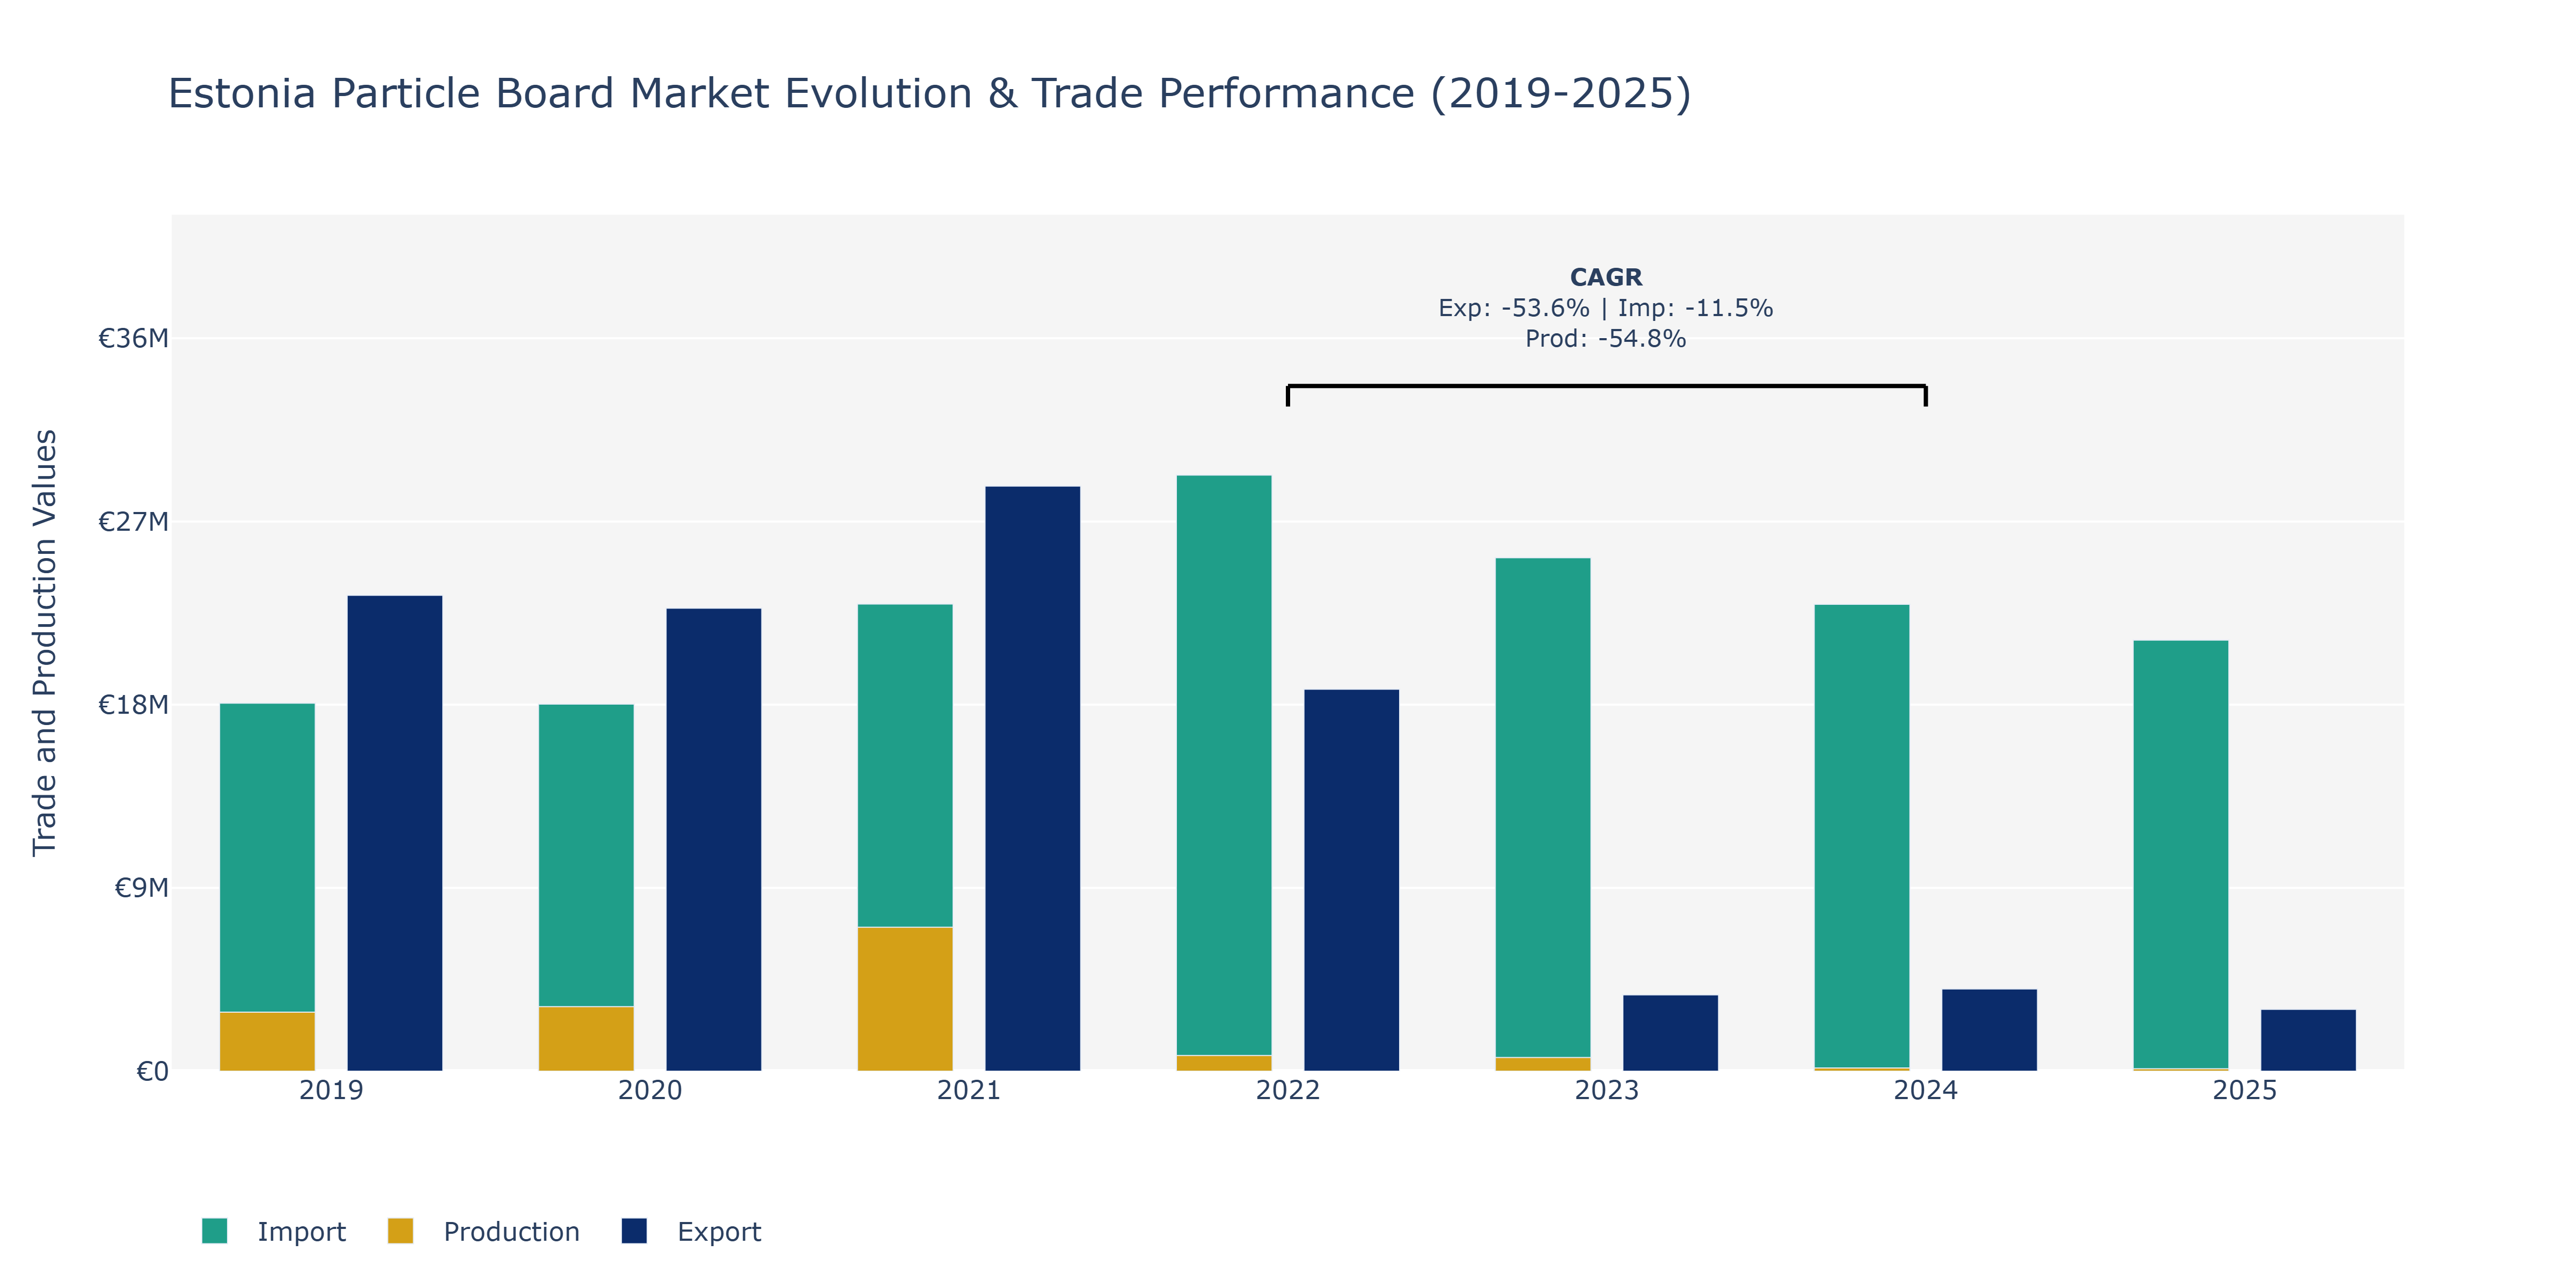
Between 2019 and 2025, the Estonia Particle Board Market witnessed diverse trends in Exports, Imports, and Production. Exports peaked at €28.74 million in 2021, reflecting a notable surge from previous years and subsequently decreased in 2022, rebounding slightly in 2025 to around €3.04 million. Imports followed a similar trajectory, reaching €29.28 million in 2022 before declining to approximately €21.18 million in 2025. Production, on the other hand, fluctuated drastically, from €7.69 million in 2022 to €118.03 million in 2025. The decline in Exports and Imports post-2021 can be attributed to global economic uncertainties impacting demand and supply chains. Meanwhile, the sharp decrease in Production can be linked to market saturation, prompting manufacturers to recalibrate operations for sustainability. To maintain competitiveness, stakeholders may consider diversifying export markets and investing in advanced production technologies to enhance efficiency and quality amidst evolving market conditions.
Key Highlights of the Report:
- Estonia Particle Board Market Outlook
- Market Size of Estonia Particle Board Market, 2025
- Forecast of Estonia Particle Board Market, 2032
- Historical Data and Forecast of Estonia Particle Board Revenues & Volume for the Period 2022 - 2032F
- Estonia Particle Board Market Trend Evolution
- Estonia Particle Board Market Drivers and Challenges
- Estonia Particle Board Price Trends
- Estonia Particle Board Porter`s Five Forces
- Estonia Particle Board Industry Life Cycle
- Historical Data and Forecast of Estonia Particle Board Market Revenues & Volume By Type for the Period 2022 - 2032F
- Historical Data and Forecast of Estonia Particle Board Market Revenues & Volume By Standard Chipboard for the Period 2022 - 2032F
- Historical Data and Forecast of Estonia Particle Board Market Revenues & Volume By Melamine Veneered Chipboard for the Period 2022 - 2032F
- Historical Data and Forecast of Estonia Particle Board Market Revenues & Volume By Flooring Grade Chipboard for the Period 2022 - 2032F
- Historical Data and Forecast of Estonia Particle Board Market Revenues & Volume By Wood Veneered Chipboard for the Period 2022 - 2032F
- Historical Data and Forecast of Estonia Particle Board Market Revenues & Volume By Plastic Veneered Chipboard for the Period 2022 - 2032F
- Historical Data and Forecast of Estonia Particle Board Market Revenues & Volume By Other for the Period 2022 - 2032F
- Historical Data and Forecast of Estonia Particle Board Market Revenues & Volume By Application for the Period 2022 - 2032F
- Historical Data and Forecast of Estonia Particle Board Market Revenues & Volume By Construction for the Period 2022 - 2032F
- Historical Data and Forecast of Estonia Particle Board Market Revenues & Volume By Furniture for the Period 2022 - 2032F
- Historical Data and Forecast of Estonia Particle Board Market Revenues & Volume By Infrastructure for the Period 2022 - 2032F
- Historical Data and Forecast of Estonia Particle Board Market Revenues & Volume By Other for the Period 2022 - 2032F
- Estonia Particle Board Import Export Trade Statistics
- Market Opportunity Assessment By Type
- Market Opportunity Assessment By Application
- Estonia Particle Board Top Companies Market Share
- Estonia Particle Board Competitive Benchmarking By Technical and Operational Parameters
- Estonia Particle Board Company Profiles
- Estonia Particle Board Key Strategic Recommendations
Frequently Asked Questions About the Market Study (FAQs):
6Wresearch actively monitors the Estonia Particle Board Market and publishes its comprehensive annual report, highlighting emerging trends, growth drivers, revenue analysis, and forecast outlook. Our insights help businesses to make data-backed strategic decisions with ongoing market dynamics. Our analysts track relevent industries related to the Estonia Particle Board Market, allowing our clients with actionable intelligence and reliable forecasts tailored to emerging regional needs.
Yes, we provide customisation as per your requirements. To learn more, feel free to contact us on sales@6wresearch.com
1 Executive Summary |
2 Introduction |
2.1 Key Highlights of the Report |
2.2 Report Description |
2.3 Market Scope & Segmentation |
2.4 Research Methodology |
2.5 Assumptions |
3 Estonia Particle Board Market Overview |
3.1 Estonia Country Macro Economic Indicators |
3.2 Estonia Particle Board Market Revenues & Volume, 2022 & 2032F |
3.3 Estonia Particle Board Market - Industry Life Cycle |
3.4 Estonia Particle Board Market - Porter's Five Forces |
3.5 Estonia Particle Board Market Revenues & Volume Share, By Type, 2022 & 2032F |
3.6 Estonia Particle Board Market Revenues & Volume Share, By Application, 2022 & 2032F |
4 Estonia Particle Board Market Dynamics |
4.1 Impact Analysis |
4.2 Market Drivers |
4.2.1 Growing demand for sustainable and eco-friendly building materials |
4.2.2 Increasing construction activities in Estonia |
4.2.3 Rise in the furniture manufacturing industry in the region |
4.3 Market Restraints |
4.3.1 Fluctuating raw material prices |
4.3.2 Intense competition from other wood-based panel products |
4.3.3 Regulatory challenges related to environmental standards and certifications |
5 Estonia Particle Board Market Trends |
6 Estonia Particle Board Market Segmentations |
6.1 Estonia Particle Board Market, By Type |
6.1.1 Overview and Analysis |
6.1.2 Estonia Particle Board Market Revenues & Volume, By Standard Chipboard, 2022 - 2032F |
6.1.3 Estonia Particle Board Market Revenues & Volume, By Melamine Veneered Chipboard, 2022 - 2032F |
6.1.4 Estonia Particle Board Market Revenues & Volume, By Flooring Grade Chipboard, 2022 - 2032F |
6.1.5 Estonia Particle Board Market Revenues & Volume, By Wood Veneered Chipboard, 2022 - 2032F |
6.1.6 Estonia Particle Board Market Revenues & Volume, By Plastic Veneered Chipboard, 2022 - 2032F |
6.1.7 Estonia Particle Board Market Revenues & Volume, By Other, 2022 - 2032F |
6.2 Estonia Particle Board Market, By Application |
6.2.1 Overview and Analysis |
6.2.2 Estonia Particle Board Market Revenues & Volume, By Construction, 2022 - 2032F |
6.2.3 Estonia Particle Board Market Revenues & Volume, By Furniture, 2022 - 2032F |
6.2.4 Estonia Particle Board Market Revenues & Volume, By Infrastructure, 2022 - 2032F |
6.2.5 Estonia Particle Board Market Revenues & Volume, By Other, 2022 - 2032F |
7 Estonia Particle Board Market Import-Export Trade Statistics |
7.1 Estonia Particle Board Market Export to Major Countries |
7.2 Estonia Particle Board Market Imports from Major Countries |
8 Estonia Particle Board Market Key Performance Indicators |
8.1 Percentage of recycled or sustainable materials used in particle board production |
8.2 Average lead time for fulfilling orders |
8.3 Percentage of market share within the furniture manufacturing sector |
8.4 Rate of innovation and introduction of new particle board products |
8.5 Customer satisfaction ratings for product quality and durability |
9 Estonia Particle Board Market - Opportunity Assessment |
9.1 Estonia Particle Board Market Opportunity Assessment, By Type, 2022 & 2032F |
9.2 Estonia Particle Board Market Opportunity Assessment, By Application, 2022 & 2032F |
10 Estonia Particle Board Market - Competitive Landscape |
10.1 Estonia Particle Board Market Revenue Share, By Companies, 2025 |
10.2 Estonia Particle Board Market Competitive Benchmarking, By Operating and Technical Parameters |
11 Company Profiles |
12 Recommendations | 13 Disclaimer |
Export potential assessment - trade Analytics for 2030
Export potential enables firms to identify high-growth global markets with greater confidence by combining advanced trade intelligence with a structured quantitative methodology. The framework analyzes emerging demand trends and country-level import patterns while integrating macroeconomic and trade datasets such as GDP and population forecasts, bilateral import–export flows, tariff structures, elasticity differentials between developed and developing economies, geographic distance, and import demand projections. Using weighted trade values from 2020–2024 as the base period to project country-to-country export potential for 2030, these inputs are operationalized through calculated drivers such as gravity model parameters, tariff impact factors, and projected GDP per-capita growth. Through an analysis of hidden potentials, demand hotspots, and market conditions that are most favorable to success, this method enables firms to focus on target countries, maximize returns, and global expansion with data, backed by accuracy.
By factoring in the projected importer demand gap that is currently unmet and could be potential opportunity, it identifies the potential for the Exporter (Country) among 190 countries, against the general trade analysis, which identifies the biggest importer or exporter.
To discover high-growth global markets and optimize your business strategy:
Click Here
Pricing
- Single User License$ 1,995
- Department License$ 2,400
- Site License$ 3,120
- Global License$ 3,795

Search
Thought Leadership and Analyst Meet


Our Clients
Latest Reports
- Canada Cloud CFD Market (2026-2032) | Size & Revenue, Industry, Growth, Competitive Landscape, Forecast, Segmentation, Value, Outlook, Trends, Share, Analysis, Companies
- Taiwan Food Delivery Platform Market (2026-2032) | Companies, Outlook, Analysis, Trends, Value, Revenue, Segmentation, Share, Forecast, Competitive Landscape, Growth, Size & Forecast
- United Kingdom (UK) Long-term Care Insurance Market (2026-2032) | Growth, Share, Consumer Insights, Drivers, Opportunities, Competition, Pricing Analysis, Segments, Restraints, Companies, Competitive, Value, Outlook, Size, Demand, Analysis, Challenges, Strategic Insights, Investment Trends, Revenue, Trends, Supply, Forecast
- United Kingdom (UK) Long Term Care Market (2026-2032) | Companies, Outlook, Analysis, Trends, Value, Revenue, Segmentation, Share, Forecast, Competitive Landscape, Growth, Size & Forecast
- Iraq Insulation and Waterproofing Market (2026-2032) | Outlook, Drivers, Growth, Size, Share, Industry, Revenue, Trends, Demand, Competitive, Strategic Insights, Opportunities, Segments, Companies, Challenges, Strategy, Consumer Insights, Analysis, Investment Trends, Value, Segmentation, Forecast, Restraints
- India Switchgear Market Outlook (2026-2032) | Size, Share, Trends, Growth, Revenue, Forecast, Analysis, Value, Outlook
- Pakistan Contraceptive Implants Market (2025-2031) | Demand, Growth, Size, Share, Industry, Pricing Analysis, Competitive, Strategic Insights, Strategy, Consumer Insights, Analysis, Investment Trends, Opportunities, Revenue, Segments, Value, Segmentation, Supply, Forecast, Restraints, Outlook, Competition, Drivers, Trends, Companies, Challenges
- Sri Lanka Packaging Market (2026-2032) | Outlook, Competition, Drivers, Trends, Demand, Pricing Analysis, Competitive, Strategic Insights, Companies, Challenges, Strategy, Consumer Insights, Analysis, Investment Trends, Opportunities, Growth, Size, Share, Industry, Revenue, Segments, Value, Segmentation, Supply, Forecast, Restraints
- India Kids Watches Market (2026-2032) | Strategy, Consumer Insights, Analysis, Investment Trends, Opportunities, Growth, Size, Share, Industry, Revenue, Segments, Value, Segmentation, Supply, Forecast, Restraints, Outlook, Competition, Drivers, Trends, Demand, Pricing Analysis, Competitive, Strategic Insights, Companies, Challenges
- Saudi Arabia Core Assurance Service Market (2025-2031) | Strategy, Consumer Insights, Analysis, Investment Trends, Opportunities, Growth, Size, Share, Industry, Revenue, Segments, Value, Segmentation, Supply, Forecast, Restraints, Outlook, Competition, Drivers, Trends, Demand, Pricing Analysis, Competitive, Strategic Insights, Companies, Challenges
Industry Events and Analyst Meet

India EV Show 2026

EV tech India Expo 2026

Auto Tech Asia 2026

Battery Tech India 2026

Smart Production Solutions Guangzhou 2026
Whitepaper
- Middle East & Africa Commercial Security Market Click here to view more.
- Middle East & Africa Fire Safety Systems & Equipment Market Click here to view more.
- GCC Drone Market Click here to view more.
- Middle East Lighting Fixture Market Click here to view more.
- GCC Physical & Perimeter Security Market Click here to view more.
6WResearch In News
- Doha a strategic location for EV manufacturing hub: IPA Qatar
- Demand for luxury TVs surging in the GCC, says Samsung
- Empowering Growth: The Thriving Journey of Bangladesh’s Cable Industry
- Demand for luxury TVs surging in the GCC, says Samsung
- Video call with a traditional healer? Once unthinkable, it’s now common in South Africa
- Intelligent Buildings To Smooth GCC’s Path To Net Zero