Estonia Personal Care Shower Bath Market (2026-2032) | Competitive, Investment Trends, Trends, Growth, Value, Industry, Segments, Consumer Insights, Restraints, Outlook, Analysis, Segmentation, Pricing Analysis, Companies, Forecast, Share, Demand, Opportunities, Strategy, Drivers, Competition, Supply, Revenue, Challenges, Strategic Insights, Size
Market Forecast By Product Type (Body Wash, Shower Gel, Bath Oils, Bubble Bath, Exfoliating Scrubs), By Function (Deep Cleansing, Moisturizing, Soothing, Aromatherapy, Skin Renewal), By Formulation (Liquid-Based, Gel-Based, Oil-Based, Foaming, Scrub-Based), By Consumer Preference (Organic, Hypoallergenic, Vegan, Chemical-Free, Natural), By Distribution Channel (Supermarkets, Online Stores, Department Stores, Pharmacies, Specialty Stores) And Competitive Landscape
| Product Code: ETC10776543 | Publication Date: Apr 2025 | Updated Date: Apr 2026 | Product Type: Market Research Report | |
| Publisher: 6Wresearch | No. of Pages: 65 | No. of Figures: 34 | No. of Tables: 19 | |
Estonia Personal Care Shower Bath Market Size (2020-2030)
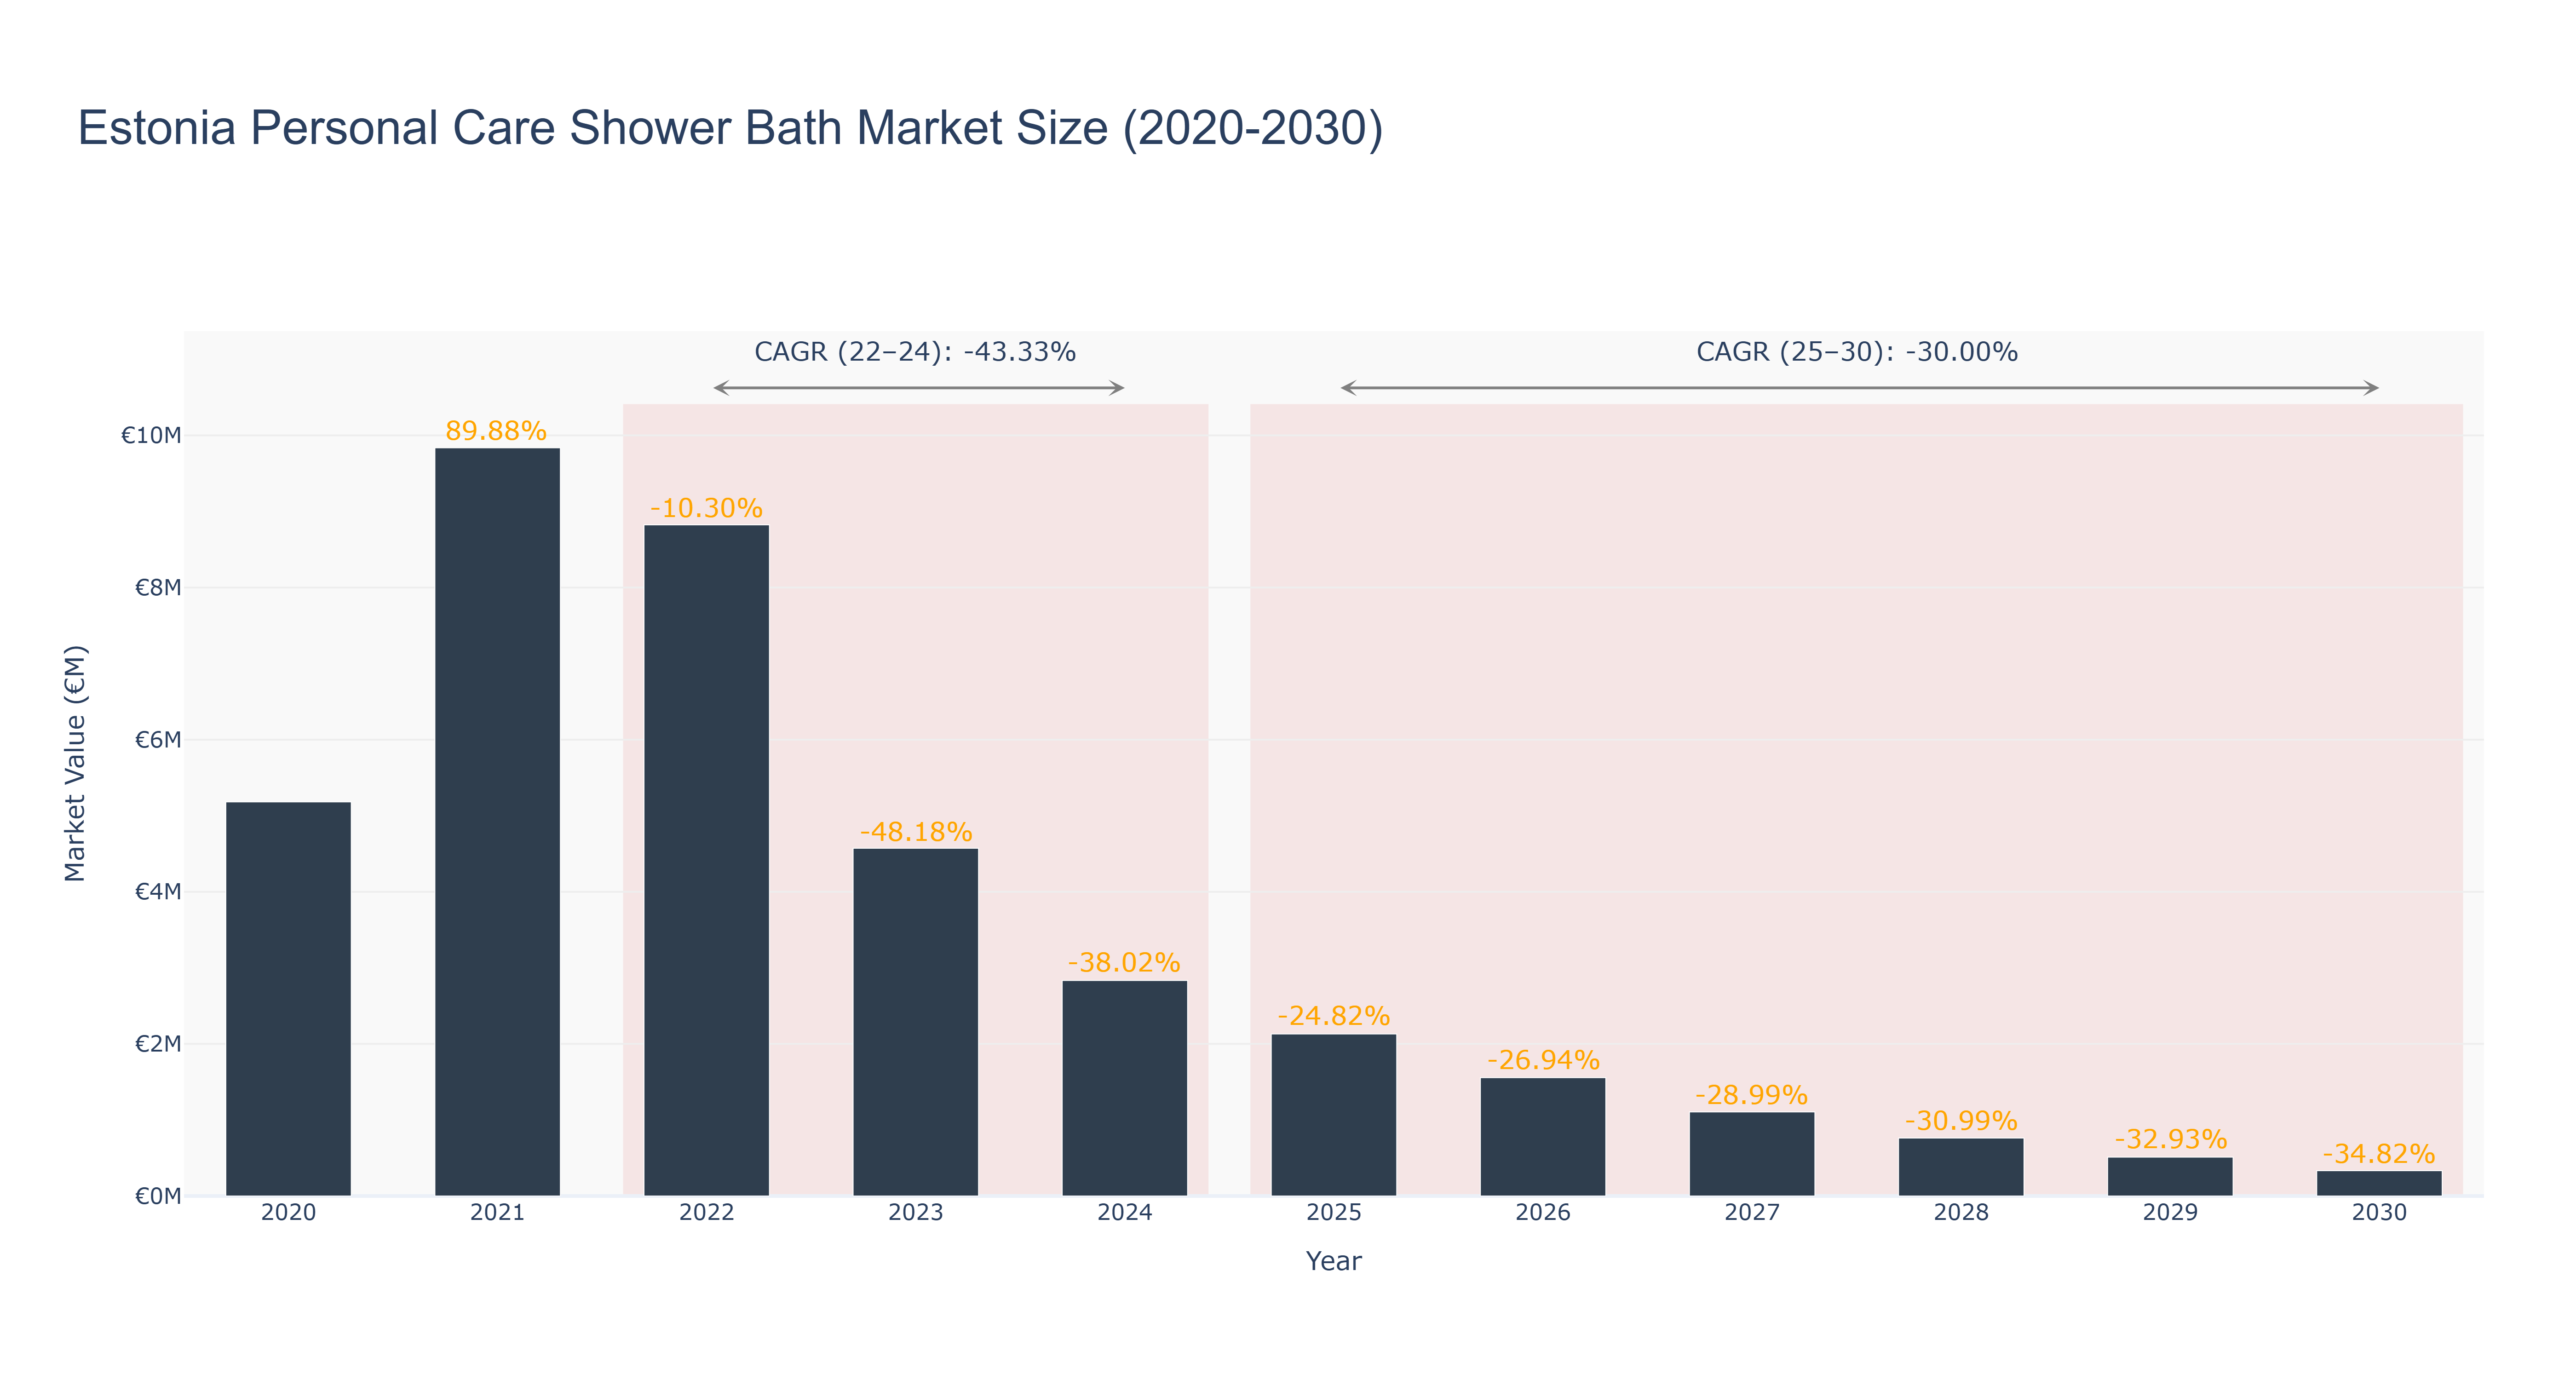
The Estonia Personal Care Shower Bath Market experienced significant fluctuations from 2020 to 2024, peaking at €9.84 million in 2021, followed by a decline to €4.57 million in 2023 and further to €2.83 million in 2024, reflecting an actual CAGR of -43.33% for the period. This downturn can be attributed to changing consumer preferences, economic pressures, and increased competition in the personal care sector. Looking ahead, the forecasted period from 2025 to 2030 indicates a continued decline, with projected market sizes decreasing from €2.13 million in 2025 to €333.38 thousand by 2030, translating to a CAGR of -30.00%. This trend suggests that industry players may need to innovate and diversify their offerings to adapt to evolving market dynamics and consumer needs. Without significant market interventions or new product launches, the outlook remains challenging as consumers increasingly prioritize value and sustainability in personal care products.
Estonia Personal Care Shower Bath Market: Production & Trade Performance (2019-2025)
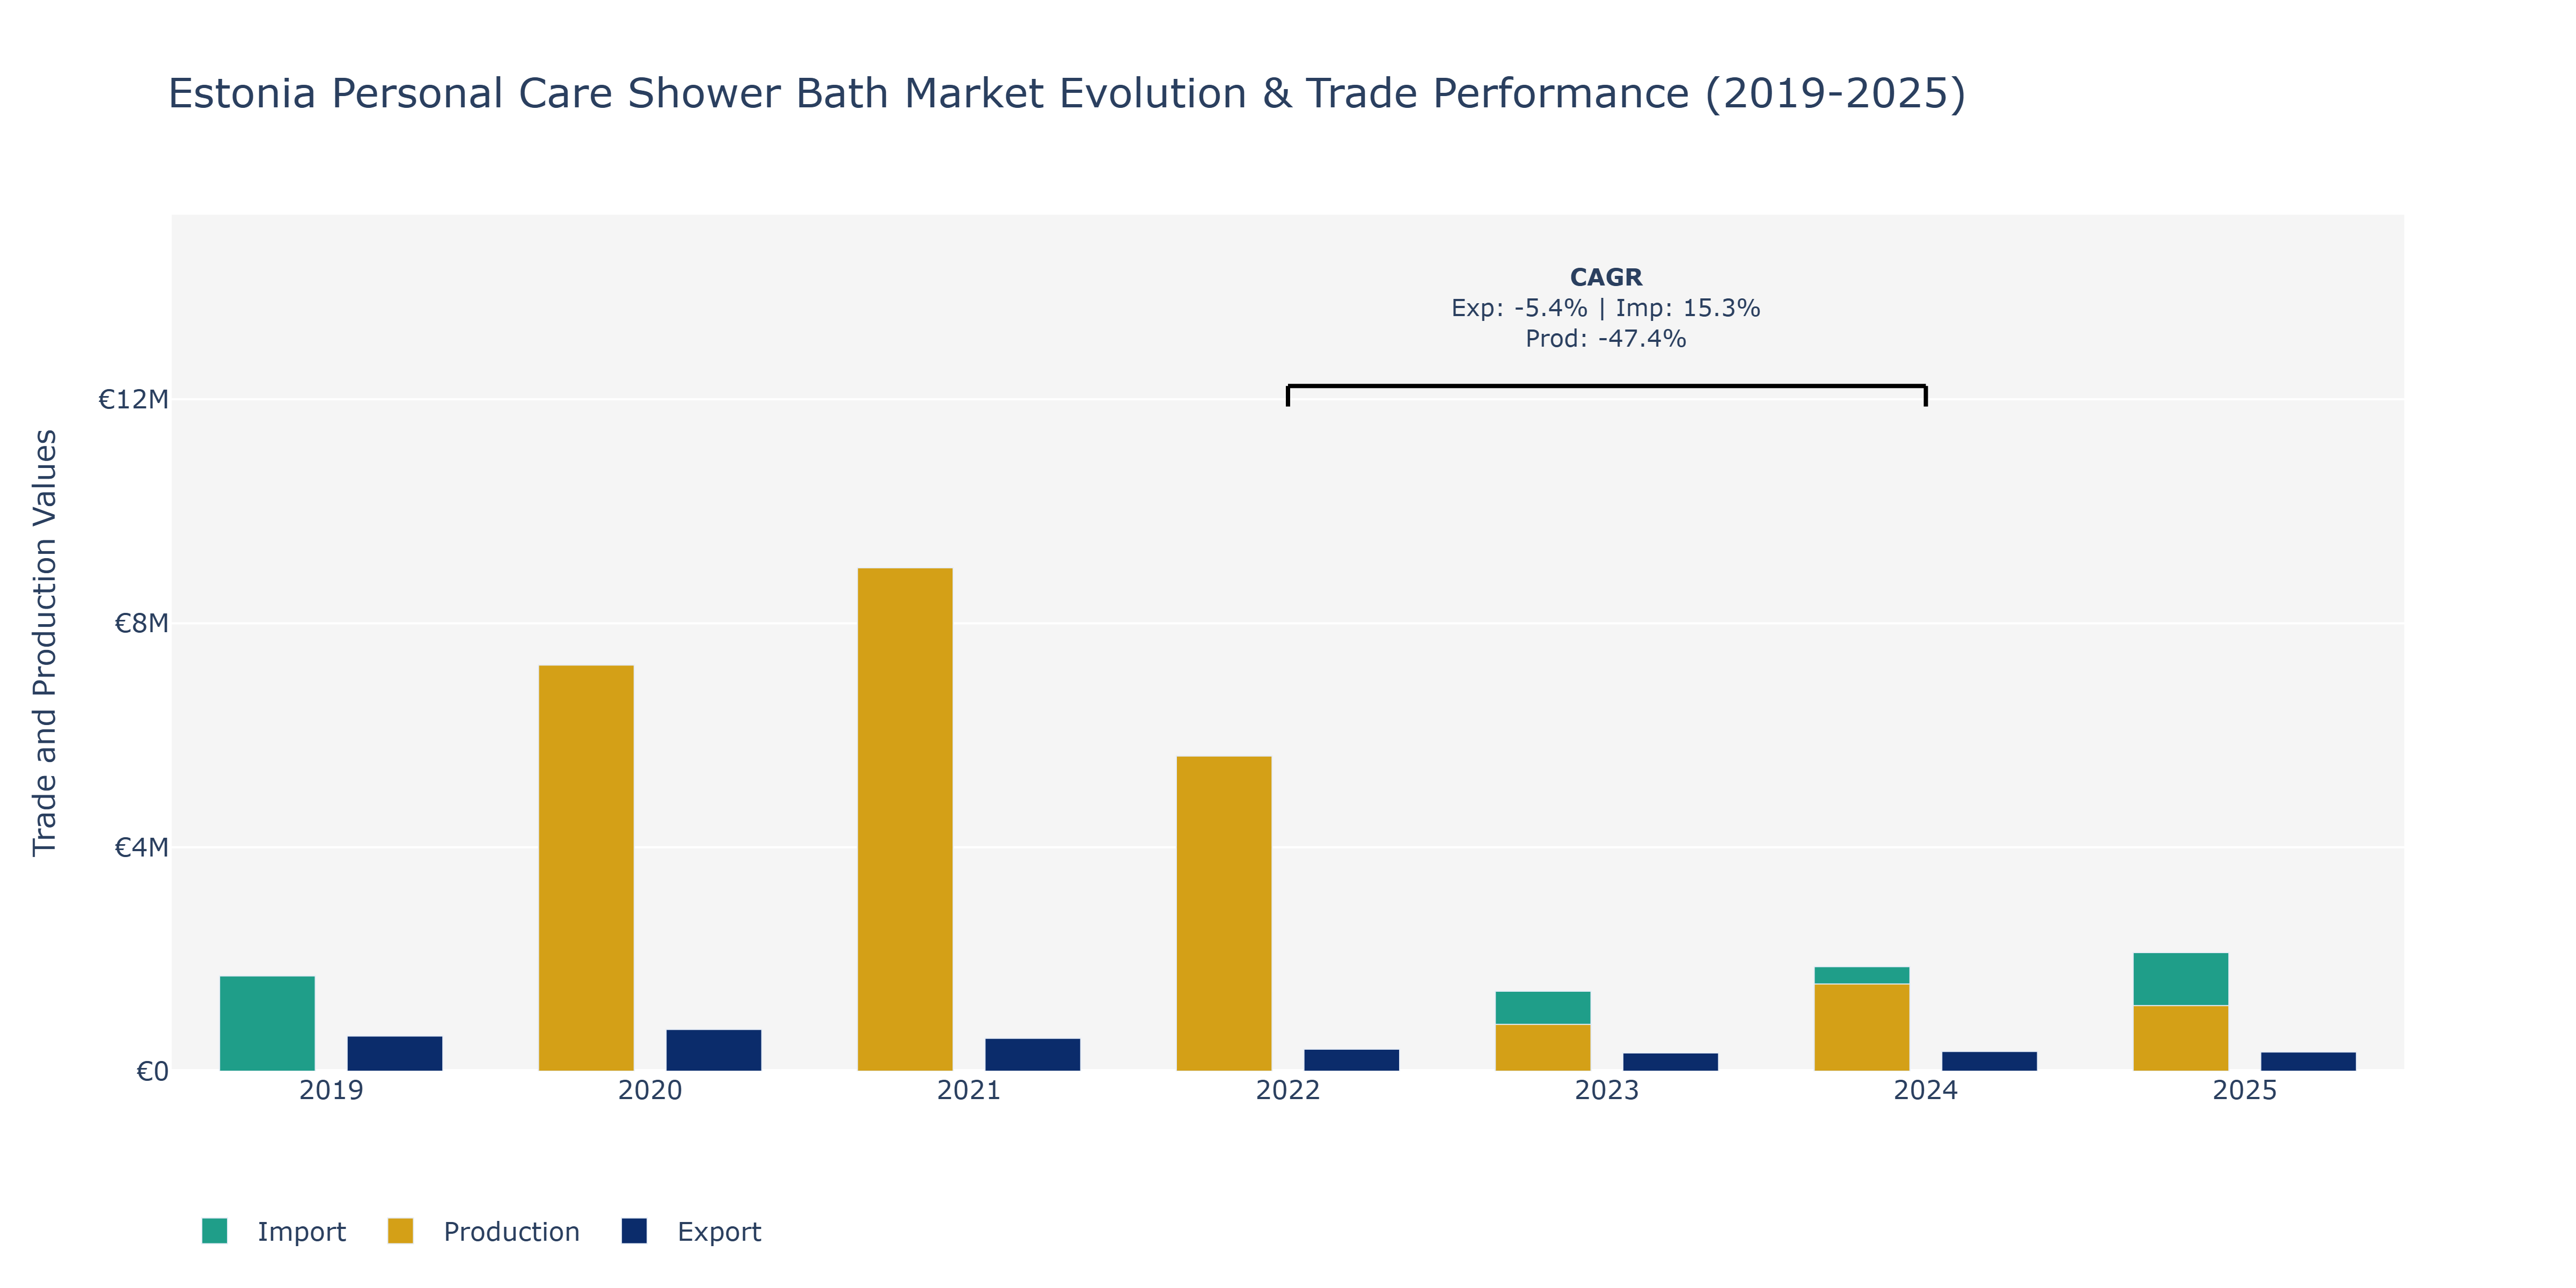
In the Estonia Personal Care Shower Bath Market, from 2019 to 2025, there were notable fluctuations in the metrics of Exports, Imports, and Production. In 2019, Imports were significantly higher than Exports, indicating a reliance on foreign products. However, by 2020, both Exports and Imports saw substantial increases, showing a potential boost in international trade. Production also spiked in 2020, reflecting domestic manufacturing capabilities. The years following exhibited varied trends with a decline in Exports and Imports in 2021, possibly due to economic factors impacting demand. Meanwhile, Production peaked in 2021, suggesting a focus on local manufacturing. The subsequent years witnessed a downward trend in Exports and Imports, possibly influenced by changing consumer preferences or global market dynamics. The sharp decline in Production from 2022 to 2023 could be attributed to restructuring or operational challenges within the industry. Real-world developments such as shifting consumer preferences towards sustainable or natural products could have impacted these metrics, urging market players to adapt their strategies accordingly.
Key Highlights of the Report:
- Estonia Personal Care Shower Bath Market Outlook
- Market Size of Estonia Personal Care Shower Bath Market, 2025
- Forecast of Estonia Personal Care Shower Bath Market, 2032
- Historical Data and Forecast of Estonia Personal Care Shower Bath Revenues & Volume for the Period 2022 - 2032F
- Estonia Personal Care Shower Bath Market Trend Evolution
- Estonia Personal Care Shower Bath Market Drivers and Challenges
- Estonia Personal Care Shower Bath Price Trends
- Estonia Personal Care Shower Bath Porter's Five Forces
- Estonia Personal Care Shower Bath Industry Life Cycle
- Historical Data and Forecast of Estonia Personal Care Shower Bath Market Revenues & Volume By Product Type for the Period 2022 - 2032F
- Historical Data and Forecast of Estonia Personal Care Shower Bath Market Revenues & Volume By Body Wash for the Period 2022 - 2032F
- Historical Data and Forecast of Estonia Personal Care Shower Bath Market Revenues & Volume By Shower Gel for the Period 2022 - 2032F
- Historical Data and Forecast of Estonia Personal Care Shower Bath Market Revenues & Volume By Bath Oils for the Period 2022 - 2032F
- Historical Data and Forecast of Estonia Personal Care Shower Bath Market Revenues & Volume By Bubble Bath for the Period 2022 - 2032F
- Historical Data and Forecast of Estonia Personal Care Shower Bath Market Revenues & Volume By Exfoliating Scrubs for the Period 2022 - 2032F
- Historical Data and Forecast of Estonia Personal Care Shower Bath Market Revenues & Volume By Function for the Period 2022 - 2032F
- Historical Data and Forecast of Estonia Personal Care Shower Bath Market Revenues & Volume By Deep Cleansing for the Period 2022 - 2032F
- Historical Data and Forecast of Estonia Personal Care Shower Bath Market Revenues & Volume By Moisturizing for the Period 2022 - 2032F
- Historical Data and Forecast of Estonia Personal Care Shower Bath Market Revenues & Volume By Soothing for the Period 2022 - 2032F
- Historical Data and Forecast of Estonia Personal Care Shower Bath Market Revenues & Volume By Aromatherapy for the Period 2022 - 2032F
- Historical Data and Forecast of Estonia Personal Care Shower Bath Market Revenues & Volume By Skin Renewal for the Period 2022 - 2032F
- Historical Data and Forecast of Estonia Personal Care Shower Bath Market Revenues & Volume By Formulation for the Period 2022 - 2032F
- Historical Data and Forecast of Estonia Personal Care Shower Bath Market Revenues & Volume By Liquid-Based for the Period 2022 - 2032F
- Historical Data and Forecast of Estonia Personal Care Shower Bath Market Revenues & Volume By Gel-Based for the Period 2022 - 2032F
- Historical Data and Forecast of Estonia Personal Care Shower Bath Market Revenues & Volume By Oil-Based for the Period 2022 - 2032F
- Historical Data and Forecast of Estonia Personal Care Shower Bath Market Revenues & Volume By Foaming for the Period 2022 - 2032F
- Historical Data and Forecast of Estonia Personal Care Shower Bath Market Revenues & Volume By Scrub-Based for the Period 2022 - 2032F
- Historical Data and Forecast of Estonia Personal Care Shower Bath Market Revenues & Volume By Consumer Preference for the Period 2022 - 2032F
- Historical Data and Forecast of Estonia Personal Care Shower Bath Market Revenues & Volume By Organic for the Period 2022 - 2032F
- Historical Data and Forecast of Estonia Personal Care Shower Bath Market Revenues & Volume By Hypoallergenic for the Period 2022 - 2032F
- Historical Data and Forecast of Estonia Personal Care Shower Bath Market Revenues & Volume By Vegan for the Period 2022 - 2032F
- Historical Data and Forecast of Estonia Personal Care Shower Bath Market Revenues & Volume By Chemical-Free for the Period 2022 - 2032F
- Historical Data and Forecast of Estonia Personal Care Shower Bath Market Revenues & Volume By Natural for the Period 2022 - 2032F
- Historical Data and Forecast of Estonia Personal Care Shower Bath Market Revenues & Volume By Distribution Channel for the Period 2022 - 2032F
- Historical Data and Forecast of Estonia Personal Care Shower Bath Market Revenues & Volume By Supermarkets for the Period 2022 - 2032F
- Historical Data and Forecast of Estonia Personal Care Shower Bath Market Revenues & Volume By Online Stores for the Period 2022 - 2032F
- Historical Data and Forecast of Estonia Personal Care Shower Bath Market Revenues & Volume By Department Stores for the Period 2022 - 2032F
- Historical Data and Forecast of Estonia Personal Care Shower Bath Market Revenues & Volume By Pharmacies for the Period 2022 - 2032F
- Historical Data and Forecast of Estonia Personal Care Shower Bath Market Revenues & Volume By Specialty Stores for the Period 2022 - 2032F
- Estonia Personal Care Shower Bath Import Export Trade Statistics
- Market Opportunity Assessment By Product Type
- Market Opportunity Assessment By Function
- Market Opportunity Assessment By Formulation
- Market Opportunity Assessment By Consumer Preference
- Market Opportunity Assessment By Distribution Channel
- Estonia Personal Care Shower Bath Top Companies Market Share
- Estonia Personal Care Shower Bath Competitive Benchmarking By Technical and Operational Parameters
- Estonia Personal Care Shower Bath Company Profiles
- Estonia Personal Care Shower Bath Key Strategic Recommendations
Frequently Asked Questions About the Market Study (FAQs):
6Wresearch actively monitors the Estonia Personal Care Shower Bath Market and publishes its comprehensive annual report, highlighting emerging trends, growth drivers, revenue analysis, and forecast outlook. Our insights help businesses to make data-backed strategic decisions with ongoing market dynamics. Our analysts track relevent industries related to the Estonia Personal Care Shower Bath Market, allowing our clients with actionable intelligence and reliable forecasts tailored to emerging regional needs.
Yes, we provide customisation as per your requirements. To learn more, feel free to contact us on sales@6wresearch.com
1 Executive Summary |
2 Introduction |
2.1 Key Highlights of the Report |
2.2 Report Description |
2.3 Market Scope & Segmentation |
2.4 Research Methodology |
2.5 Assumptions |
3 Estonia Personal Care Shower Bath Market Overview |
3.1 Estonia Country Macro Economic Indicators |
3.2 Estonia Personal Care Shower Bath Market Revenues & Volume, 2022 & 2032F |
3.3 Estonia Personal Care Shower Bath Market - Industry Life Cycle |
3.4 Estonia Personal Care Shower Bath Market - Porter's Five Forces |
3.5 Estonia Personal Care Shower Bath Market Revenues & Volume Share, By Product Type, 2022 & 2032F |
3.6 Estonia Personal Care Shower Bath Market Revenues & Volume Share, By Function, 2022 & 2032F |
3.7 Estonia Personal Care Shower Bath Market Revenues & Volume Share, By Formulation, 2022 & 2032F |
3.8 Estonia Personal Care Shower Bath Market Revenues & Volume Share, By Consumer Preference, 2022 & 2032F |
3.9 Estonia Personal Care Shower Bath Market Revenues & Volume Share, By Distribution Channel, 2022 & 2032F |
4 Estonia Personal Care Shower Bath Market Dynamics |
4.1 Impact Analysis |
4.2 Market Drivers |
4.3 Market Restraints |
5 Estonia Personal Care Shower Bath Market Trends |
6 Estonia Personal Care Shower Bath Market, By Types |
6.1 Estonia Personal Care Shower Bath Market, By Product Type |
6.1.1 Overview and Analysis |
6.1.2 Estonia Personal Care Shower Bath Market Revenues & Volume, By Product Type, 2022 - 2032F |
6.1.3 Estonia Personal Care Shower Bath Market Revenues & Volume, By Body Wash, 2022 - 2032F |
6.1.4 Estonia Personal Care Shower Bath Market Revenues & Volume, By Shower Gel, 2022 - 2032F |
6.1.5 Estonia Personal Care Shower Bath Market Revenues & Volume, By Bath Oils, 2022 - 2032F |
6.1.6 Estonia Personal Care Shower Bath Market Revenues & Volume, By Bubble Bath, 2022 - 2032F |
6.1.7 Estonia Personal Care Shower Bath Market Revenues & Volume, By Exfoliating Scrubs, 2022 - 2032F |
6.2 Estonia Personal Care Shower Bath Market, By Function |
6.2.1 Overview and Analysis |
6.2.2 Estonia Personal Care Shower Bath Market Revenues & Volume, By Deep Cleansing, 2022 - 2032F |
6.2.3 Estonia Personal Care Shower Bath Market Revenues & Volume, By Moisturizing, 2022 - 2032F |
6.2.4 Estonia Personal Care Shower Bath Market Revenues & Volume, By Soothing, 2022 - 2032F |
6.2.5 Estonia Personal Care Shower Bath Market Revenues & Volume, By Aromatherapy, 2022 - 2032F |
6.2.6 Estonia Personal Care Shower Bath Market Revenues & Volume, By Skin Renewal, 2022 - 2032F |
6.3 Estonia Personal Care Shower Bath Market, By Formulation |
6.3.1 Overview and Analysis |
6.3.2 Estonia Personal Care Shower Bath Market Revenues & Volume, By Liquid-Based, 2022 - 2032F |
6.3.3 Estonia Personal Care Shower Bath Market Revenues & Volume, By Gel-Based, 2022 - 2032F |
6.3.4 Estonia Personal Care Shower Bath Market Revenues & Volume, By Oil-Based, 2022 - 2032F |
6.3.5 Estonia Personal Care Shower Bath Market Revenues & Volume, By Foaming, 2022 - 2032F |
6.3.6 Estonia Personal Care Shower Bath Market Revenues & Volume, By Scrub-Based, 2022 - 2032F |
6.4 Estonia Personal Care Shower Bath Market, By Consumer Preference |
6.4.1 Overview and Analysis |
6.4.2 Estonia Personal Care Shower Bath Market Revenues & Volume, By Organic, 2022 - 2032F |
6.4.3 Estonia Personal Care Shower Bath Market Revenues & Volume, By Hypoallergenic, 2022 - 2032F |
6.4.4 Estonia Personal Care Shower Bath Market Revenues & Volume, By Vegan, 2022 - 2032F |
6.4.5 Estonia Personal Care Shower Bath Market Revenues & Volume, By Chemical-Free, 2022 - 2032F |
6.4.6 Estonia Personal Care Shower Bath Market Revenues & Volume, By Natural, 2022 - 2032F |
6.5 Estonia Personal Care Shower Bath Market, By Distribution Channel |
6.5.1 Overview and Analysis |
6.5.2 Estonia Personal Care Shower Bath Market Revenues & Volume, By Supermarkets, 2022 - 2032F |
6.5.3 Estonia Personal Care Shower Bath Market Revenues & Volume, By Online Stores, 2022 - 2032F |
6.5.4 Estonia Personal Care Shower Bath Market Revenues & Volume, By Department Stores, 2022 - 2032F |
6.5.5 Estonia Personal Care Shower Bath Market Revenues & Volume, By Pharmacies, 2022 - 2032F |
6.5.6 Estonia Personal Care Shower Bath Market Revenues & Volume, By Specialty Stores, 2022 - 2032F |
7 Estonia Personal Care Shower Bath Market Import-Export Trade Statistics |
7.1 Estonia Personal Care Shower Bath Market Export to Major Countries |
7.2 Estonia Personal Care Shower Bath Market Imports from Major Countries |
8 Estonia Personal Care Shower Bath Market Key Performance Indicators |
9 Estonia Personal Care Shower Bath Market - Opportunity Assessment |
9.1 Estonia Personal Care Shower Bath Market Opportunity Assessment, By Product Type, 2022 & 2032F |
9.2 Estonia Personal Care Shower Bath Market Opportunity Assessment, By Function, 2022 & 2032F |
9.3 Estonia Personal Care Shower Bath Market Opportunity Assessment, By Formulation, 2022 & 2032F |
9.4 Estonia Personal Care Shower Bath Market Opportunity Assessment, By Consumer Preference, 2022 & 2032F |
9.5 Estonia Personal Care Shower Bath Market Opportunity Assessment, By Distribution Channel, 2022 & 2032F |
10 Estonia Personal Care Shower Bath Market - Competitive Landscape |
10.1 Estonia Personal Care Shower Bath Market Revenue Share, By Companies, 2025 |
10.2 Estonia Personal Care Shower Bath Market Competitive Benchmarking, By Operating and Technical Parameters |
11 Company Profiles |
12 Recommendations |
13 Disclaimer |
Export potential assessment - trade Analytics for 2030
Export potential enables firms to identify high-growth global markets with greater confidence by combining advanced trade intelligence with a structured quantitative methodology. The framework analyzes emerging demand trends and country-level import patterns while integrating macroeconomic and trade datasets such as GDP and population forecasts, bilateral import–export flows, tariff structures, elasticity differentials between developed and developing economies, geographic distance, and import demand projections. Using weighted trade values from 2020–2024 as the base period to project country-to-country export potential for 2030, these inputs are operationalized through calculated drivers such as gravity model parameters, tariff impact factors, and projected GDP per-capita growth. Through an analysis of hidden potentials, demand hotspots, and market conditions that are most favorable to success, this method enables firms to focus on target countries, maximize returns, and global expansion with data, backed by accuracy.
By factoring in the projected importer demand gap that is currently unmet and could be potential opportunity, it identifies the potential for the Exporter (Country) among 190 countries, against the general trade analysis, which identifies the biggest importer or exporter.
To discover high-growth global markets and optimize your business strategy:
Click Here
Pricing
- Single User License$ 1,995
- Department License$ 2,400
- Site License$ 3,120
- Global License$ 3,795

Search
Thought Leadership and Analyst Meet


Our Clients
Latest Reports
- India Electromagnetic Bulk Flow Meter Market (2026-2032) | Analysis, Challenges, Strategic Insights, Supply, Forecast, Growth, Share, Consumer Insights, Competitive, Value, Outlook, Size & Demand,
- India Battery Powered Bulk Flow Meter Market (2026-2032) | Outlook, Analysis, Competitive Landscape, Growth, Size, Trends, Value, Revenue, Companies, Segmentation, Share & Forecast
- Bosnia and Herzegovina Fuel-Efficient Winglets Market (2026-2032) | Growth, Competition, Strategy, Restraints, Trends, Challenges, segmentation, Value, Outlook, Investment Opportunities, Analysis, Revenue, Companies, Insights, Pricing, Size, Drivers, Demand, Share, Forecast
- Canada Cloud CFD Market (2026-2032) | Size & Revenue, Industry, Growth, Competitive Landscape, Forecast, Segmentation, Value, Outlook, Trends, Share, Analysis, Companies
- Taiwan Food Delivery Platform Market (2026-2032) | Companies, Outlook, Analysis, Trends, Value, Revenue, Segmentation, Share, Forecast, Competitive Landscape, Growth, Size & Forecast
- United Kingdom (UK) Long-term Care Insurance Market (2026-2032) | Growth, Share, Consumer Insights, Drivers, Opportunities, Competition, Pricing Analysis, Segments, Restraints, Companies, Competitive, Value, Outlook, Size, Demand, Analysis, Challenges, Strategic Insights, Investment Trends, Revenue, Trends, Supply, Forecast
- United Kingdom (UK) Long Term Care Market (2026-2032) | Companies, Outlook, Analysis, Trends, Value, Revenue, Segmentation, Share, Forecast, Competitive Landscape, Growth, Size & Forecast
- Iraq Insulation and Waterproofing Market (2026-2032) | Outlook, Drivers, Growth, Size, Share, Industry, Revenue, Trends, Demand, Competitive, Strategic Insights, Opportunities, Segments, Companies, Challenges, Strategy, Consumer Insights, Analysis, Investment Trends, Value, Segmentation, Forecast, Restraints
- India Switchgear Market Outlook (2026-2032) | Size, Share, Trends, Growth, Revenue, Forecast, Analysis, Value, Outlook
- Pakistan Contraceptive Implants Market (2025-2031) | Demand, Growth, Size, Share, Industry, Pricing Analysis, Competitive, Strategic Insights, Strategy, Consumer Insights, Analysis, Investment Trends, Opportunities, Revenue, Segments, Value, Segmentation, Supply, Forecast, Restraints, Outlook, Competition, Drivers, Trends, Companies, Challenges
Industry Events and Analyst Meet

India EV Show 2026

EV tech India Expo 2026

Auto Tech Asia 2026

Battery Tech India 2026

Smart Production Solutions Guangzhou 2026
Whitepaper
- Middle East & Africa Commercial Security Market Click here to view more.
- Middle East & Africa Fire Safety Systems & Equipment Market Click here to view more.
- GCC Drone Market Click here to view more.
- Middle East Lighting Fixture Market Click here to view more.
- GCC Physical & Perimeter Security Market Click here to view more.
6WResearch In News
- Doha a strategic location for EV manufacturing hub: IPA Qatar
- Demand for luxury TVs surging in the GCC, says Samsung
- Empowering Growth: The Thriving Journey of Bangladesh’s Cable Industry
- Demand for luxury TVs surging in the GCC, says Samsung
- Video call with a traditional healer? Once unthinkable, it’s now common in South Africa
- Intelligent Buildings To Smooth GCC’s Path To Net Zero