Estonia Processed Fruit Market (2026-2032) | Outlook, Share, Forecast, Size, Growth, Analysis, Industry, Segmentation, Companies, Trends, Value & Revenue
Market Forecast By Product (Fresh, Fresh- Cut, Canned, Frozen, Drying &Dehydration), By Processing Equipment (Pre-processing, Processing, Washing, Filling, Seasoning, Packaging) And Competitive Landscape
| Product Code: ETC5515124 | Publication Date: Nov 2023 | Updated Date: Apr 2026 | Product Type: Market Research Report | |
| Publisher: 6Wresearch | Author: Ravi Bhandari | No. of Pages: 60 | No. of Figures: 30 | No. of Tables: 5 |
Estonia Processed Fruit Market Size (2020-2030)
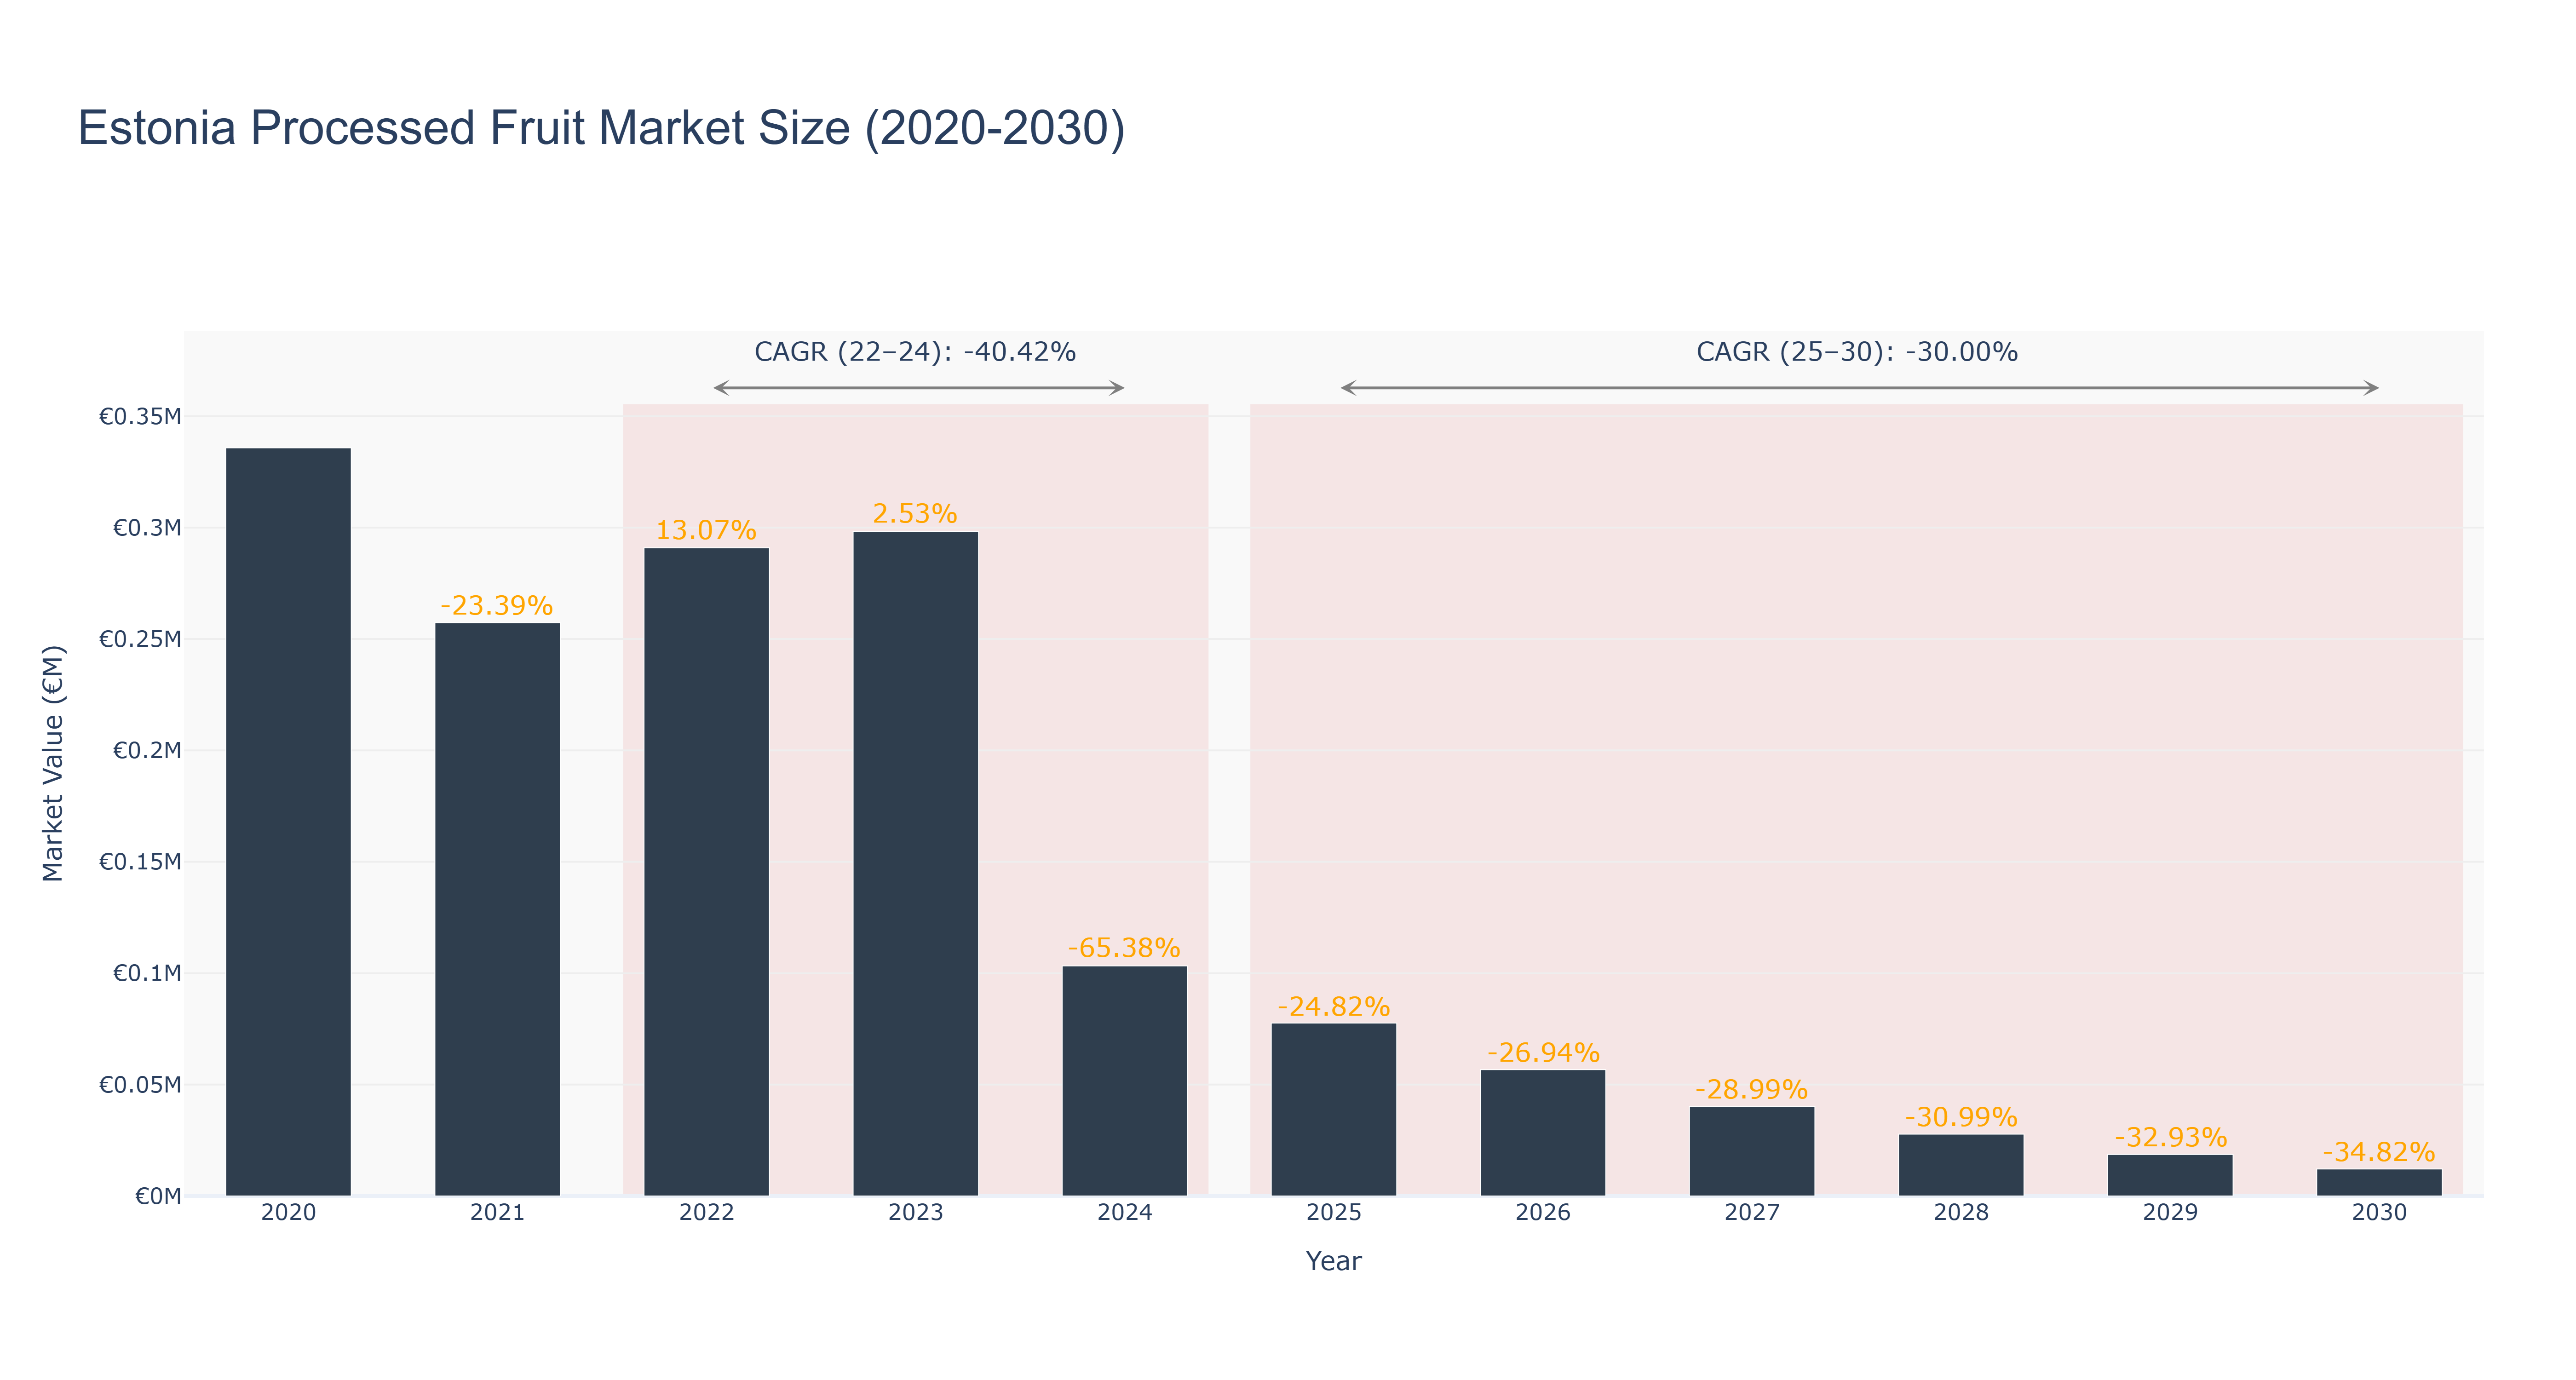
The Estonia Processed Fruit Market exhibited a peak market size of €335.82 thousand in 2020, followed by a significant decline in 2021 to €257.28 thousand, reflecting a contraction of -23.39%. The market showed some recovery in 2022 with a growth of 13.07%, reaching €290.90 thousand, but has since plateaued at €298.27 thousand in 2023, reflecting minimal growth of 2.53%. However, the actual data for 2024 forecasts a sharp decline to €103.26 thousand, resulting in a staggering CAGR of -40.42% for the period 2022-2024. Looking forward, the forecasted market size is projected to decline further, with CAGR of -30.00% from 2025 to 2030, culminating in a market size of €12.15 thousand by 2030. This downturn can be attributed to changing consumer preferences, increased competition from fresh produce, and economic pressures. The future will likely be shaped by macroeconomic trends and shifts in consumer behavior rather than specific upcoming projects within the market.
Estonia Processed Fruit Market: Production & Trade Performance (2019-2025)
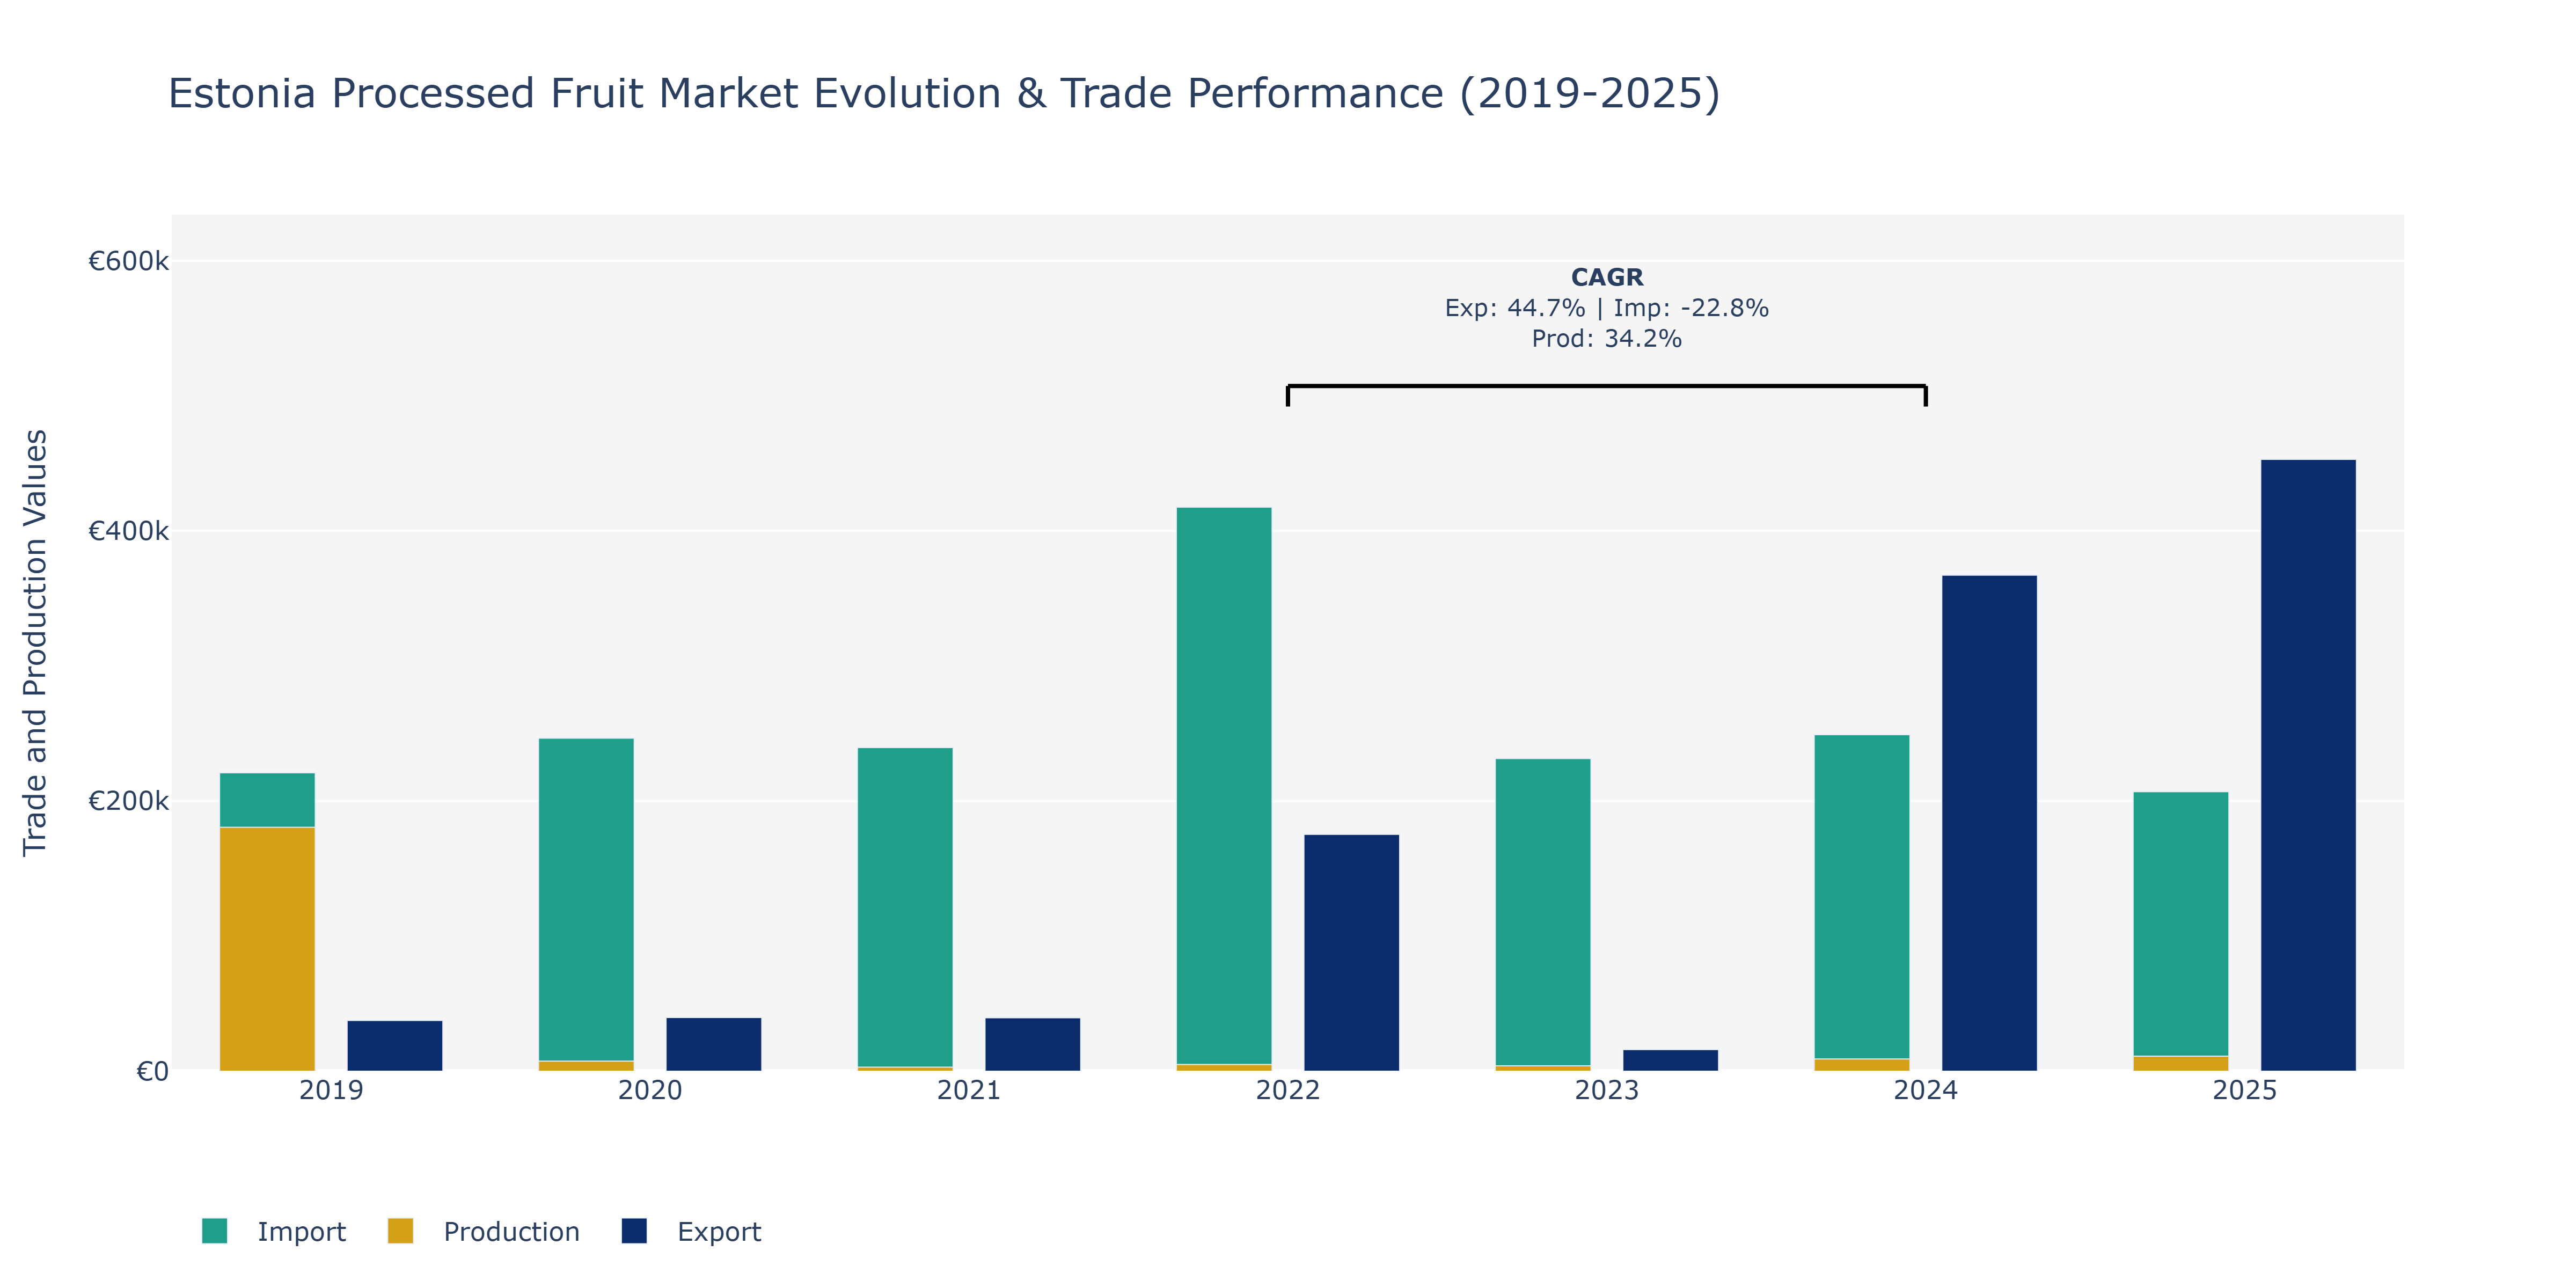
In the Estonia Processed Fruit Market, exports showed a remarkable increase from €37.55 thousand in 2019 to €453.0 thousand in 2025, representing a substantial upward trend over the years. This surge can be attributed to an enhanced focus on quality standards, product innovation, and effective marketing strategies. Imports, on the other hand, experienced fluctuations, reaching a peak of €417.63 thousand in 2022 and then declining to €206.88 thousand in 2025. These fluctuations could be influenced by changes in international trade agreements, global supply chain disruptions, and varying consumer demand patterns. Production levels also varied significantly, with a peak of €18.06 thousand in 2019 and a subsequent drop to €7.49 thousand in 2020, before gradually increasing to €11.10 thousand in 2025. This fluctuation might be a result of changing agricultural practices, weather conditions impacting harvests, and technological advancements in processing methods. The market's growth signifies a positive trajectory, indicating opportunities for market players to capitalize on evolving consumer preferences and sustainability trends in the processed fruit sector.
Key Highlights of the Report:
- Estonia Processed Fruit Market Outlook
- Market Size of Estonia Processed Fruit Market, 2025
- Forecast of Estonia Processed Fruit Market, 2032
- Historical Data and Forecast of Estonia Processed Fruit Revenues & Volume for the Period 2022 - 2032F
- Estonia Processed Fruit Market Trend Evolution
- Estonia Processed Fruit Market Drivers and Challenges
- Estonia Processed Fruit Price Trends
- Estonia Processed Fruit Porter`s Five Forces
- Estonia Processed Fruit Industry Life Cycle
- Historical Data and Forecast of Estonia Processed Fruit Market Revenues & Volume By Product for the Period 2022 - 2032F
- Historical Data and Forecast of Estonia Processed Fruit Market Revenues & Volume By Fresh for the Period 2022 - 2032F
- Historical Data and Forecast of Estonia Processed Fruit Market Revenues & Volume By Fresh- Cut for the Period 2022 - 2032F
- Historical Data and Forecast of Estonia Processed Fruit Market Revenues & Volume By Canned for the Period 2022 - 2032F
- Historical Data and Forecast of Estonia Processed Fruit Market Revenues & Volume By Frozen for the Period 2022 - 2032F
- Historical Data and Forecast of Estonia Processed Fruit Market Revenues & Volume By Drying &Dehydration for the Period 2022 - 2032F
- Historical Data and Forecast of Estonia Processed Fruit Market Revenues & Volume By Processing Equipment for the Period 2022 - 2032F
- Historical Data and Forecast of Estonia Processed Fruit Market Revenues & Volume By Pre-processing for the Period 2022 - 2032F
- Historical Data and Forecast of Estonia Processed Fruit Market Revenues & Volume By Processing for the Period 2022 - 2032F
- Historical Data and Forecast of Estonia Processed Fruit Market Revenues & Volume By Washing for the Period 2022 - 2032F
- Historical Data and Forecast of Estonia Processed Fruit Market Revenues & Volume By Filling for the Period 2022 - 2032F
- Historical Data and Forecast of Estonia Processed Fruit Market Revenues & Volume By Seasoning for the Period 2022 - 2032F
- Historical Data and Forecast of Estonia Processed Fruit Market Revenues & Volume By Packaging for the Period 2022 - 2032F
- Estonia Processed Fruit Import Export Trade Statistics
- Market Opportunity Assessment By Product
- Market Opportunity Assessment By Processing Equipment
- Estonia Processed Fruit Top Companies Market Share
- Estonia Processed Fruit Competitive Benchmarking By Technical and Operational Parameters
- Estonia Processed Fruit Company Profiles
- Estonia Processed Fruit Key Strategic Recommendations
Frequently Asked Questions About the Market Study (FAQs):
6Wresearch actively monitors the Estonia Processed Fruit Market and publishes its comprehensive annual report, highlighting emerging trends, growth drivers, revenue analysis, and forecast outlook. Our insights help businesses to make data-backed strategic decisions with ongoing market dynamics. Our analysts track relevent industries related to the Estonia Processed Fruit Market, allowing our clients with actionable intelligence and reliable forecasts tailored to emerging regional needs.
Yes, we provide customisation as per your requirements. To learn more, feel free to contact us on sales@6wresearch.com
1 Executive Summary |
2 Introduction |
2.1 Key Highlights of the Report |
2.2 Report Description |
2.3 Market Scope & Segmentation |
2.4 Research Methodology |
2.5 Assumptions |
3 Estonia Processed Fruit Market Overview |
3.1 Estonia Country Macro Economic Indicators |
3.2 Estonia Processed Fruit Market Revenues & Volume, 2022 & 2032F |
3.3 Estonia Processed Fruit Market - Industry Life Cycle |
3.4 Estonia Processed Fruit Market - Porter's Five Forces |
3.5 Estonia Processed Fruit Market Revenues & Volume Share, By Product, 2022 & 2032F |
3.6 Estonia Processed Fruit Market Revenues & Volume Share, By Processing Equipment, 2022 & 2032F |
4 Estonia Processed Fruit Market Dynamics |
4.1 Impact Analysis |
4.2 Market Drivers |
4.2.1 Growing health consciousness among consumers leading to increased demand for healthy food options. |
4.2.2 Rising disposable income levels in Estonia, enabling consumers to spend more on processed fruit products. |
4.2.3 Increasing awareness about the benefits of processed fruits in terms of convenience and longer shelf life. |
4.3 Market Restraints |
4.3.1 Seasonal availability of certain fruits leading to supply chain challenges. |
4.3.2 Fluctuating raw material prices impacting the cost of production for processed fruit manufacturers. |
4.3.3 Competition from fresh fruit alternatives impacting the market growth of processed fruits. |
5 Estonia Processed Fruit Market Trends |
6 Estonia Processed Fruit Market Segmentations |
6.1 Estonia Processed Fruit Market, By Product |
6.1.1 Overview and Analysis |
6.1.2 Estonia Processed Fruit Market Revenues & Volume, By Fresh, 2022 - 2032F |
6.1.3 Estonia Processed Fruit Market Revenues & Volume, By Fresh- Cut, 2022 - 2032F |
6.1.4 Estonia Processed Fruit Market Revenues & Volume, By Canned, 2022 - 2032F |
6.1.5 Estonia Processed Fruit Market Revenues & Volume, By Frozen, 2022 - 2032F |
6.1.6 Estonia Processed Fruit Market Revenues & Volume, By Drying &Dehydration, 2022 - 2032F |
6.2 Estonia Processed Fruit Market, By Processing Equipment |
6.2.1 Overview and Analysis |
6.2.2 Estonia Processed Fruit Market Revenues & Volume, By Pre-processing, 2022 - 2032F |
6.2.3 Estonia Processed Fruit Market Revenues & Volume, By Processing, 2022 - 2032F |
6.2.4 Estonia Processed Fruit Market Revenues & Volume, By Washing, 2022 - 2032F |
6.2.5 Estonia Processed Fruit Market Revenues & Volume, By Filling, 2022 - 2032F |
6.2.6 Estonia Processed Fruit Market Revenues & Volume, By Seasoning, 2022 - 2032F |
6.2.7 Estonia Processed Fruit Market Revenues & Volume, By Packaging, 2022 - 2032F |
7 Estonia Processed Fruit Market Import-Export Trade Statistics |
7.1 Estonia Processed Fruit Market Export to Major Countries |
7.2 Estonia Processed Fruit Market Imports from Major Countries |
8 Estonia Processed Fruit Market Key Performance Indicators |
8.1 Consumer adoption rate of processed fruit products. |
8.2 Rate of new product innovations in the processed fruit market. |
8.3 Level of investment in marketing and promotional activities for processed fruit products. |
8.4 Sustainability practices implemented by processed fruit manufacturers. |
9 Estonia Processed Fruit Market - Opportunity Assessment |
9.1 Estonia Processed Fruit Market Opportunity Assessment, By Product, 2022 & 2032F |
9.2 Estonia Processed Fruit Market Opportunity Assessment, By Processing Equipment, 2022 & 2032F |
10 Estonia Processed Fruit Market - Competitive Landscape |
10.1 Estonia Processed Fruit Market Revenue Share, By Companies, 2025 |
10.2 Estonia Processed Fruit Market Competitive Benchmarking, By Operating and Technical Parameters |
11 Company Profiles |
12 Recommendations | 13 Disclaimer |
Global Go To Market Strategy - 2030
Export potential enables firms to identify high-growth global markets with greater confidence by combining advanced trade intelligence with a structured quantitative methodology. The framework analyzes emerging demand trends and country-level import patterns while integrating macroeconomic and trade datasets such as GDP and population forecasts, bilateral import–export flows, tariff structures, elasticity differentials between developed and developing economies, geographic distance, and import demand projections. Using weighted trade values from 2020–2024 as the base period to project country-to-country export potential for 2030, these inputs are operationalized through calculated drivers such as gravity model parameters, tariff impact factors, and projected GDP per-capita growth. Through an analysis of hidden potentials, demand hotspots, and market conditions that are most favorable to success, this method enables firms to focus on target countries, maximize returns, and global expansion with data, backed by accuracy.
By factoring in the projected importer demand gap that is currently unmet and could be potential opportunity, it identifies the potential for the Exporter (Country) among 190 countries, against the general trade analysis, which identifies the biggest importer or exporter.
To discover high-growth global markets and optimize your business strategy:
Click Here
Pricing
- Single User License$ 1,995
- Department License$ 2,400
- Site License$ 3,120
- Global License$ 3,795

Leadership Perspectives from Industry Events
Search
Thought Leadership and Analyst Meet


Our Clients
6WResearch In News
- Doha a strategic location for EV manufacturing hub: IPA Qatar
- Demand for luxury TVs surging in the GCC, says Samsung
- Empowering Growth: The Thriving Journey of Bangladesh’s Cable Industry
- Demand for luxury TVs surging in the GCC, says Samsung
- Video call with a traditional healer? Once unthinkable, it’s now common in South Africa
- Intelligent Buildings To Smooth GCC’s Path To Net Zero
Latest Reports
- Taiwan Airport Wireless Infrastructure Market (2026-2032)
- Vietnam Airport Wireless Infrastructure Market (2026-2032)
- Thailand Airport Wireless Infrastructure Market (2026-2032)
- South Korea Airport Wireless Infrastructure Market (2026-2032)
- Romania Airport Wireless Infrastructure Market (2026-2032)
- Qatar Airport Wireless Infrastructure Market (2026-2032)
- Philippines Airport Wireless Infrastructure Market (2026-2032)
- Japan Airport Wireless Infrastructure Market (2026-2032)
- Taiwan Airport Winter Services Market (2026-2032)
- Vietnam Airport Winter Services Market (2026-2032)
Industry Events and Analyst Meet

HIMTEX 2026

India Refining Summit 2026

India EV Show 2026

EV tech India Expo 2026

Auto Tech Asia 2026
Whitepaper
- Middle East & Africa Commercial Security Market Click here to view more.
- Middle East & Africa Fire Safety Systems & Equipment Market Click here to view more.
- GCC Drone Market Click here to view more.
- Middle East Lighting Fixture Market Click here to view more.
- GCC Physical & Perimeter Security Market Click here to view more.