Estonia Self-Locking Nuts Market (2026-2032) | Companies, Size & Revenue, Share, Trends, Segmentation, Value, Industry, Outlook, Competitive Landscape, Growth, Forecast, Analysis
Market Forecast By Material (Steel, Brass, Aluminum, Alloy, Others), By End-use Industry (Automotive, Aerospace, Construction, Oil & Gas, Others), By Distribution Channel (Direct, Indirect, Online Sales, Offline Sales) And Competitive Landscape
| Product Code: ETC7142452 | Publication Date: Sep 2024 | Updated Date: Apr 2026 | Product Type: Market Research Report | |
| Publisher: 6Wresearch | Author: Dhaval Chaurasia | No. of Pages: 75 | No. of Figures: 35 | No. of Tables: 20 |
Estonia Self-Locking Nuts Market Size (2020-2030)

The Estonia Self-Locking Nuts Market experienced a steady growth trajectory from 2020 to 2024, reaching its peak size of €3.74 million in 2024. However, a slight decline was observed in 2023 due to economic uncertainties. The market rebounded strongly in the following years, with a forecasted size of €6.75 million in 2030, driven by a compound annual growth rate (CAGR) of 10.34% from 2025 to 2030. The market's growth can be attributed to increasing industrialization and the automotive sector's demand for self-locking nuts. In the near future, Estonia is set to invest in advanced manufacturing technologies to enhance the country's competitiveness in the global market, further boosting the self-locking nuts industry.
Estonia Self-Locking Nuts Market: Production & Trade Performance (2019-2025)
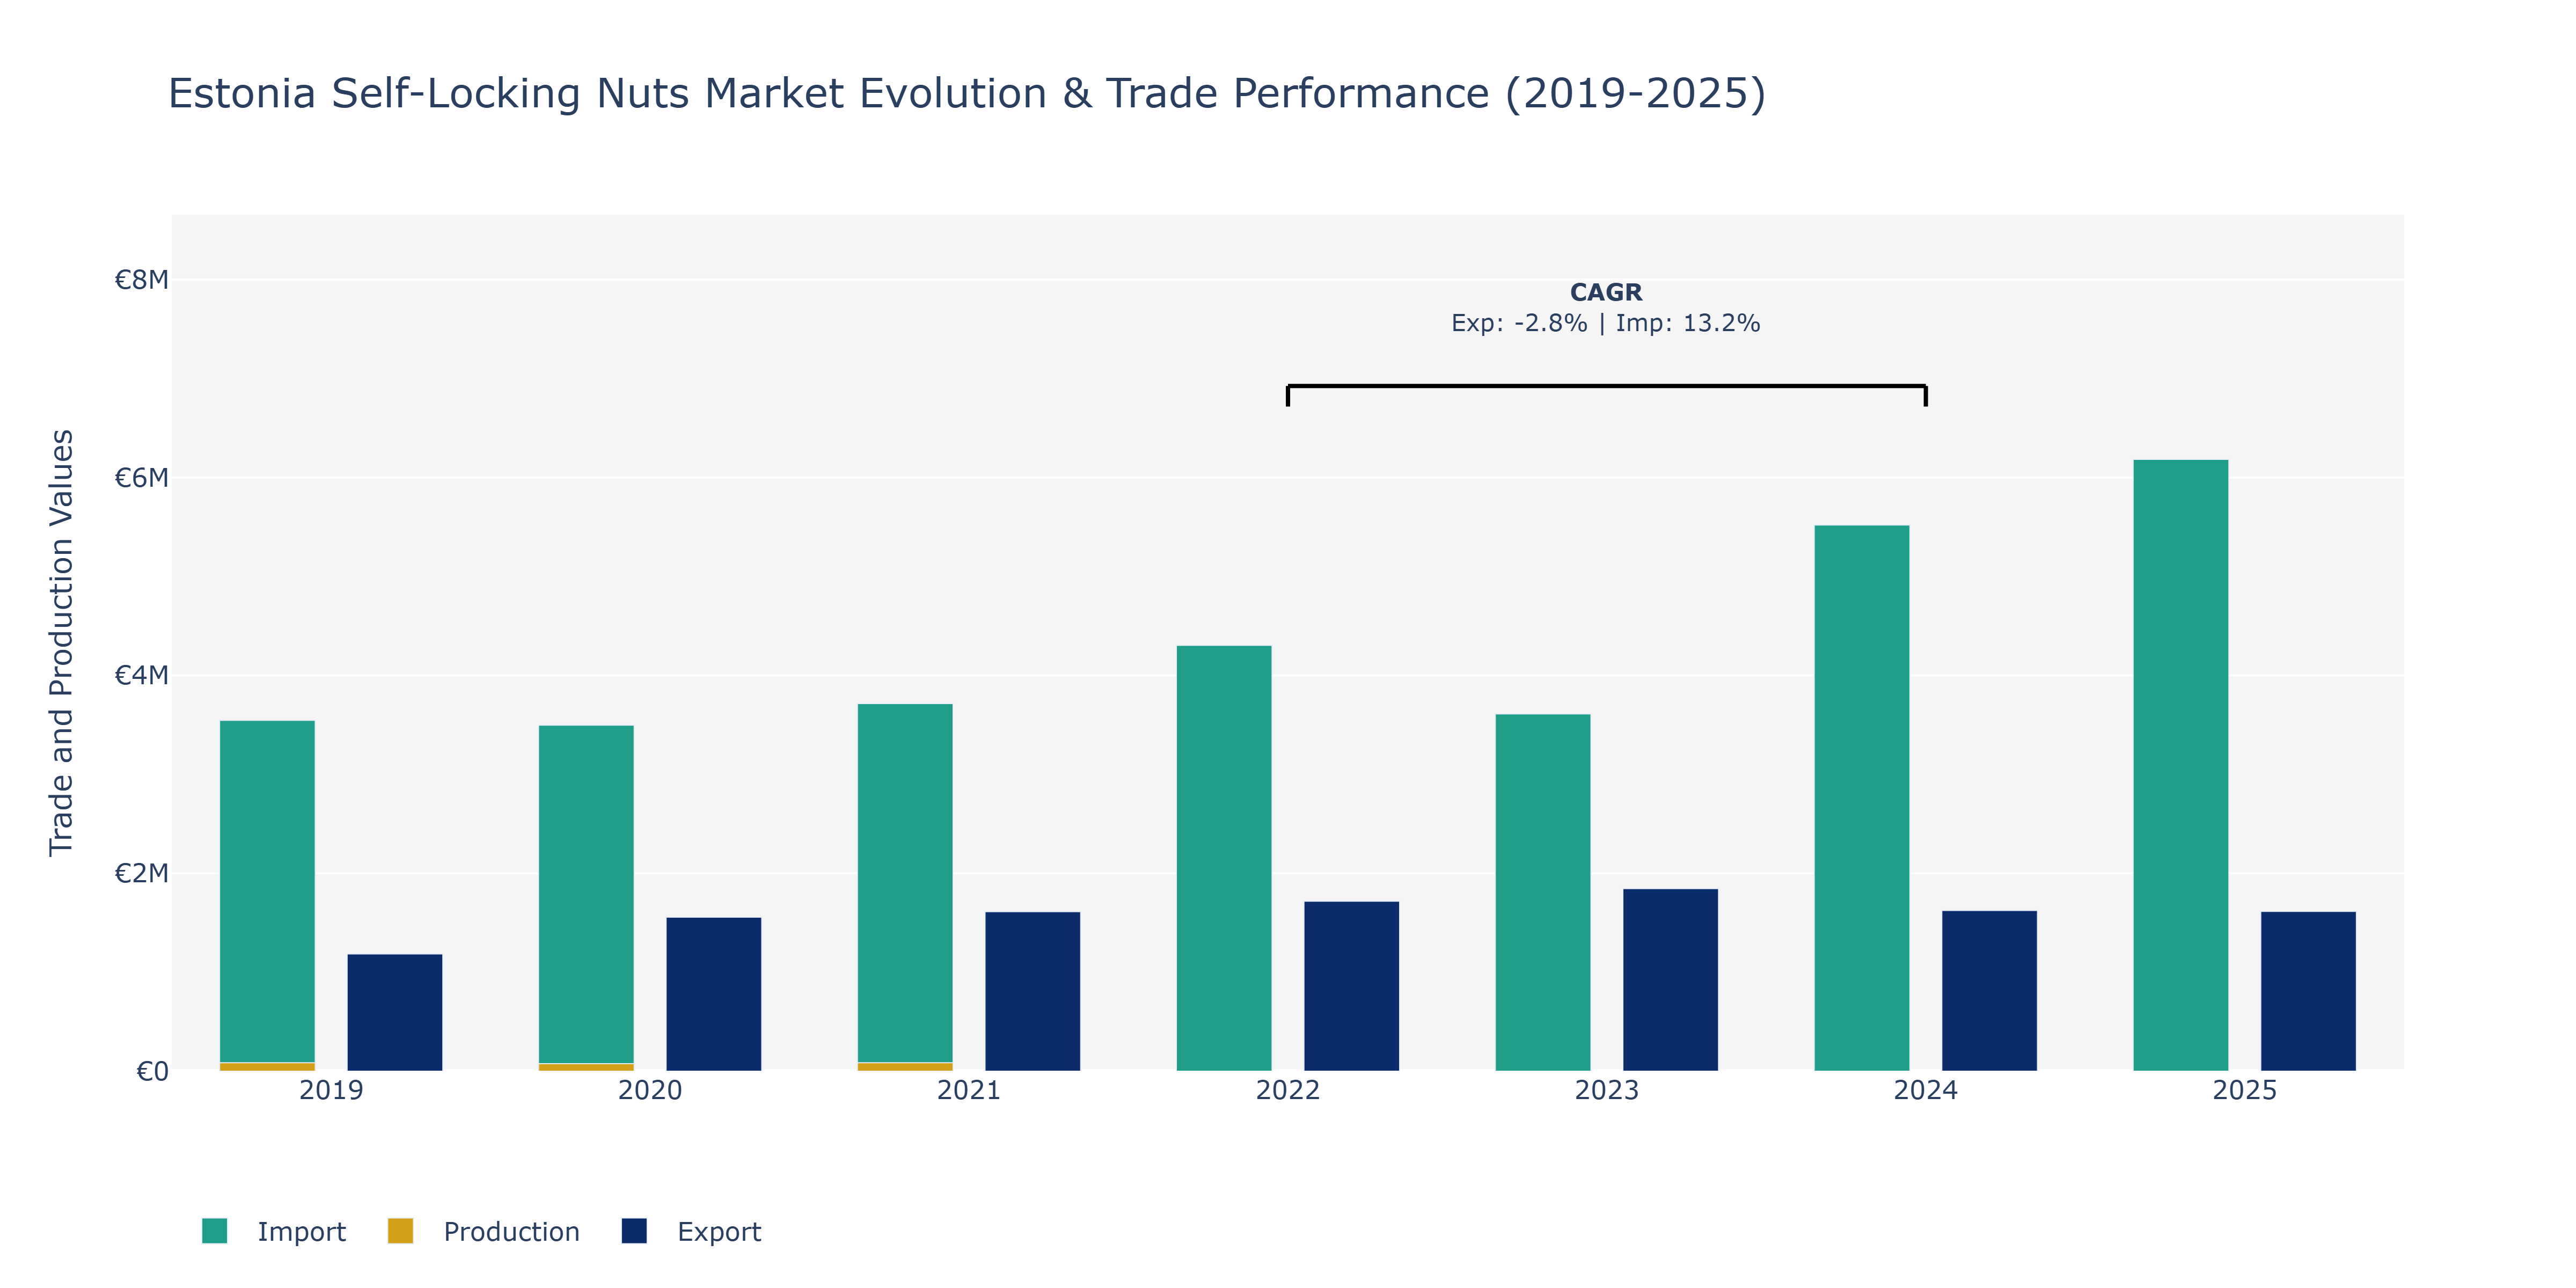
Between 2019 and 2025, the Estonia Self-Locking Nuts Market witnessed various trends in Exports, Imports, and Production. Exports showed fluctuating patterns, reaching a peak of €1.85 million in 2023 before slightly decreasing in 2024 and 2025. Conversely, Imports experienced steady growth from €3.55 million in 2019 to €6.18 million in 2025, showcasing a notable 13.24% CAGR from 2022 to 2024. Production values remained relatively stable, with a minor decline in 2020 followed by a recovery to €85 million in 2021. The surge in imports could be attributed to increased demand for self-locking nuts in the domestic market, possibly driven by infrastructure projects and machinery manufacturing. The fluctuating Export value might reflect changes in international trade dynamics or shifts in global demand for these specialized products. To sustain growth, stakeholders could focus on enhancing production efficiency and exploring new export markets while ensuring consistent quality standards to remain competitive in the evolving market landscape.
Key Highlights of the Report:
- Estonia Self-Locking Nuts Market Outlook
- Market Size of Estonia Self-Locking Nuts Market, 2025
- Forecast of Estonia Self-Locking Nuts Market, 2032
- Historical Data and Forecast of Estonia Self-Locking Nuts Revenues & Volume for the Period 2022 - 2032
- Estonia Self-Locking Nuts Market Trend Evolution
- Estonia Self-Locking Nuts Market Drivers and Challenges
- Estonia Self-Locking Nuts Price Trends
- Estonia Self-Locking Nuts Porter's Five Forces
- Estonia Self-Locking Nuts Industry Life Cycle
- Historical Data and Forecast of Estonia Self-Locking Nuts Market Revenues & Volume By Material for the Period 2022 - 2032
- Historical Data and Forecast of Estonia Self-Locking Nuts Market Revenues & Volume By Steel for the Period 2022 - 2032
- Historical Data and Forecast of Estonia Self-Locking Nuts Market Revenues & Volume By Brass for the Period 2022 - 2032
- Historical Data and Forecast of Estonia Self-Locking Nuts Market Revenues & Volume By Aluminum for the Period 2022 - 2032
- Historical Data and Forecast of Estonia Self-Locking Nuts Market Revenues & Volume By Alloy for the Period 2022 - 2032
- Historical Data and Forecast of Estonia Self-Locking Nuts Market Revenues & Volume By Others for the Period 2022 - 2032
- Historical Data and Forecast of Estonia Self-Locking Nuts Market Revenues & Volume By End-use Industry for the Period 2022 - 2032
- Historical Data and Forecast of Estonia Self-Locking Nuts Market Revenues & Volume By Automotive for the Period 2022 - 2032
- Historical Data and Forecast of Estonia Self-Locking Nuts Market Revenues & Volume By Aerospace for the Period 2022 - 2032
- Historical Data and Forecast of Estonia Self-Locking Nuts Market Revenues & Volume By Construction for the Period 2022 - 2032
- Historical Data and Forecast of Estonia Self-Locking Nuts Market Revenues & Volume By Oil & Gas for the Period 2022 - 2032
- Historical Data and Forecast of Estonia Self-Locking Nuts Market Revenues & Volume By Others for the Period 2022 - 2032
- Historical Data and Forecast of Estonia Self-Locking Nuts Market Revenues & Volume By Distribution Channel for the Period 2022 - 2032
- Historical Data and Forecast of Estonia Self-Locking Nuts Market Revenues & Volume By Direct for the Period 2022 - 2032
- Historical Data and Forecast of Estonia Self-Locking Nuts Market Revenues & Volume By Indirect for the Period 2022 - 2032
- Historical Data and Forecast of Estonia Self-Locking Nuts Market Revenues & Volume By Online Sales for the Period 2022 - 2032
- Historical Data and Forecast of Estonia Self-Locking Nuts Market Revenues & Volume By Offline Sales for the Period 2022 - 2032
- Estonia Self-Locking Nuts Import Export Trade Statistics
- Market Opportunity Assessment By Material
- Market Opportunity Assessment By End-use Industry
- Market Opportunity Assessment By Distribution Channel
- Estonia Self-Locking Nuts Top Companies Market Share
- Estonia Self-Locking Nuts Competitive Benchmarking By Technical and Operational Parameters
- Estonia Self-Locking Nuts Company Profiles
- Estonia Self-Locking Nuts Key Strategic Recommendations
Frequently Asked Questions About the Market Study (FAQs):
6Wresearch actively monitors the Estonia Self-Locking Nuts Market and publishes its comprehensive annual report, highlighting emerging trends, growth drivers, revenue analysis, and forecast outlook. Our insights help businesses to make data-backed strategic decisions with ongoing market dynamics. Our analysts track relevent industries related to the Estonia Self-Locking Nuts Market, allowing our clients with actionable intelligence and reliable forecasts tailored to emerging regional needs.
Yes, we provide customisation as per your requirements. To learn more, feel free to contact us on sales@6wresearch.com
1 Executive Summary |
2 Introduction |
2.1 Key Highlights of the Report |
2.2 Report Description |
2.3 Market Scope & Segmentation |
2.4 Research Methodology |
2.5 Assumptions |
3 Estonia Self-Locking Nuts Market Overview |
3.1 Estonia Country Macro Economic Indicators |
3.2 Estonia Self-Locking Nuts Market Revenues & Volume, 2022 & 2032F |
3.3 Estonia Self-Locking Nuts Market - Industry Life Cycle |
3.4 Estonia Self-Locking Nuts Market - Porter's Five Forces |
3.5 Estonia Self-Locking Nuts Market Revenues & Volume Share, By Material, 2022 & 2032F |
3.6 Estonia Self-Locking Nuts Market Revenues & Volume Share, By End-use Industry, 2022 & 2032F |
3.7 Estonia Self-Locking Nuts Market Revenues & Volume Share, By Distribution Channel, 2022 & 2032F |
4 Estonia Self-Locking Nuts Market Dynamics |
4.1 Impact Analysis |
4.2 Market Drivers |
4.2.1 Increasing demand for self-locking nuts in the manufacturing sector due to their effectiveness in preventing loosening and maintaining joint integrity. |
4.2.2 Growing emphasis on industrial safety standards leading to higher adoption of self-locking nuts. |
4.2.3 Rising investments in infrastructure projects in Estonia driving the demand for self-locking nuts. |
4.3 Market Restraints |
4.3.1 Fluctuating raw material prices impacting the production cost of self-locking nuts. |
4.3.2 Intense competition among market players leading to pricing pressures. |
4.3.3 Economic uncertainty affecting the overall demand for self-locking nuts in Estonia. |
5 Estonia Self-Locking Nuts Market Trends |
6 Estonia Self-Locking Nuts Market, By Types |
6.1 Estonia Self-Locking Nuts Market, By Material |
6.1.1 Overview and Analysis |
6.1.2 Estonia Self-Locking Nuts Market Revenues & Volume, By Material, 2022 - 2032F |
6.1.3 Estonia Self-Locking Nuts Market Revenues & Volume, By Steel, 2022 - 2032F |
6.1.4 Estonia Self-Locking Nuts Market Revenues & Volume, By Brass, 2022 - 2032F |
6.1.5 Estonia Self-Locking Nuts Market Revenues & Volume, By Aluminum, 2022 - 2032F |
6.1.6 Estonia Self-Locking Nuts Market Revenues & Volume, By Alloy, 2022 - 2032F |
6.1.7 Estonia Self-Locking Nuts Market Revenues & Volume, By Others, 2022 - 2032F |
6.2 Estonia Self-Locking Nuts Market, By End-use Industry |
6.2.1 Overview and Analysis |
6.2.2 Estonia Self-Locking Nuts Market Revenues & Volume, By Automotive, 2022 - 2032F |
6.2.3 Estonia Self-Locking Nuts Market Revenues & Volume, By Aerospace, 2022 - 2032F |
6.2.4 Estonia Self-Locking Nuts Market Revenues & Volume, By Construction, 2022 - 2032F |
6.2.5 Estonia Self-Locking Nuts Market Revenues & Volume, By Oil & Gas, 2022 - 2032F |
6.2.6 Estonia Self-Locking Nuts Market Revenues & Volume, By Others, 2022 - 2032F |
6.3 Estonia Self-Locking Nuts Market, By Distribution Channel |
6.3.1 Overview and Analysis |
6.3.2 Estonia Self-Locking Nuts Market Revenues & Volume, By Direct, 2022 - 2032F |
6.3.3 Estonia Self-Locking Nuts Market Revenues & Volume, By Indirect, 2022 - 2032F |
6.3.4 Estonia Self-Locking Nuts Market Revenues & Volume, By Online Sales, 2022 - 2032F |
6.3.5 Estonia Self-Locking Nuts Market Revenues & Volume, By Offline Sales, 2022 - 2032F |
7 Estonia Self-Locking Nuts Market Import-Export Trade Statistics |
7.1 Estonia Self-Locking Nuts Market Export to Major Countries |
7.2 Estonia Self-Locking Nuts Market Imports from Major Countries |
8 Estonia Self-Locking Nuts Market Key Performance Indicators |
8.1 Percentage increase in the adoption of self-locking nuts in key industries in Estonia. |
8.2 Rate of growth in the number of infrastructure projects utilizing self-locking nuts. |
8.3 Number of patents or innovations in self-locking nut technology developed within the market. |
9 Estonia Self-Locking Nuts Market - Opportunity Assessment |
9.1 Estonia Self-Locking Nuts Market Opportunity Assessment, By Material, 2022 & 2032F |
9.2 Estonia Self-Locking Nuts Market Opportunity Assessment, By End-use Industry, 2022 & 2032F |
9.3 Estonia Self-Locking Nuts Market Opportunity Assessment, By Distribution Channel, 2022 & 2032F |
10 Estonia Self-Locking Nuts Market - Competitive Landscape |
10.1 Estonia Self-Locking Nuts Market Revenue Share, By Companies, 2025 |
10.2 Estonia Self-Locking Nuts Market Competitive Benchmarking, By Operating and Technical Parameters |
11 Company Profiles |
12 Recommendations |
13 Disclaimer |
Export potential assessment - trade Analytics for 2030
Export potential enables firms to identify high-growth global markets with greater confidence by combining advanced trade intelligence with a structured quantitative methodology. The framework analyzes emerging demand trends and country-level import patterns while integrating macroeconomic and trade datasets such as GDP and population forecasts, bilateral import–export flows, tariff structures, elasticity differentials between developed and developing economies, geographic distance, and import demand projections. Using weighted trade values from 2020–2024 as the base period to project country-to-country export potential for 2030, these inputs are operationalized through calculated drivers such as gravity model parameters, tariff impact factors, and projected GDP per-capita growth. Through an analysis of hidden potentials, demand hotspots, and market conditions that are most favorable to success, this method enables firms to focus on target countries, maximize returns, and global expansion with data, backed by accuracy.
By factoring in the projected importer demand gap that is currently unmet and could be potential opportunity, it identifies the potential for the Exporter (Country) among 190 countries, against the general trade analysis, which identifies the biggest importer or exporter.
To discover high-growth global markets and optimize your business strategy:
Click Here
Pricing
- Single User License$ 1,995
- Department License$ 2,400
- Site License$ 3,120
- Global License$ 3,795

Search
Thought Leadership and Analyst Meet


Our Clients
Latest Reports
- Canada Cloud CFD Market (2026-2032) | Size & Revenue, Industry, Growth, Competitive Landscape, Forecast, Segmentation, Value, Outlook, Trends, Share, Analysis, Companies
- Taiwan Food Delivery Platform Market (2026-2032) | Companies, Outlook, Analysis, Trends, Value, Revenue, Segmentation, Share, Forecast, Competitive Landscape, Growth, Size & Forecast
- United Kingdom (UK) Long-term Care Insurance Market (2026-2032) | Growth, Share, Consumer Insights, Drivers, Opportunities, Competition, Pricing Analysis, Segments, Restraints, Companies, Competitive, Value, Outlook, Size, Demand, Analysis, Challenges, Strategic Insights, Investment Trends, Revenue, Trends, Supply, Forecast
- United Kingdom (UK) Long Term Care Market (2026-2032) | Companies, Outlook, Analysis, Trends, Value, Revenue, Segmentation, Share, Forecast, Competitive Landscape, Growth, Size & Forecast
- Iraq Insulation and Waterproofing Market (2026-2032) | Outlook, Drivers, Growth, Size, Share, Industry, Revenue, Trends, Demand, Competitive, Strategic Insights, Opportunities, Segments, Companies, Challenges, Strategy, Consumer Insights, Analysis, Investment Trends, Value, Segmentation, Forecast, Restraints
- India Switchgear Market Outlook (2026-2032) | Size, Share, Trends, Growth, Revenue, Forecast, Analysis, Value, Outlook
- Pakistan Contraceptive Implants Market (2025-2031) | Demand, Growth, Size, Share, Industry, Pricing Analysis, Competitive, Strategic Insights, Strategy, Consumer Insights, Analysis, Investment Trends, Opportunities, Revenue, Segments, Value, Segmentation, Supply, Forecast, Restraints, Outlook, Competition, Drivers, Trends, Companies, Challenges
- Sri Lanka Packaging Market (2026-2032) | Outlook, Competition, Drivers, Trends, Demand, Pricing Analysis, Competitive, Strategic Insights, Companies, Challenges, Strategy, Consumer Insights, Analysis, Investment Trends, Opportunities, Growth, Size, Share, Industry, Revenue, Segments, Value, Segmentation, Supply, Forecast, Restraints
- India Kids Watches Market (2026-2032) | Strategy, Consumer Insights, Analysis, Investment Trends, Opportunities, Growth, Size, Share, Industry, Revenue, Segments, Value, Segmentation, Supply, Forecast, Restraints, Outlook, Competition, Drivers, Trends, Demand, Pricing Analysis, Competitive, Strategic Insights, Companies, Challenges
- Saudi Arabia Core Assurance Service Market (2025-2031) | Strategy, Consumer Insights, Analysis, Investment Trends, Opportunities, Growth, Size, Share, Industry, Revenue, Segments, Value, Segmentation, Supply, Forecast, Restraints, Outlook, Competition, Drivers, Trends, Demand, Pricing Analysis, Competitive, Strategic Insights, Companies, Challenges
Industry Events and Analyst Meet

India EV Show 2026

EV tech India Expo 2026

Auto Tech Asia 2026

Battery Tech India 2026

Smart Production Solutions Guangzhou 2026
Whitepaper
- Middle East & Africa Commercial Security Market Click here to view more.
- Middle East & Africa Fire Safety Systems & Equipment Market Click here to view more.
- GCC Drone Market Click here to view more.
- Middle East Lighting Fixture Market Click here to view more.
- GCC Physical & Perimeter Security Market Click here to view more.
6WResearch In News
- Doha a strategic location for EV manufacturing hub: IPA Qatar
- Demand for luxury TVs surging in the GCC, says Samsung
- Empowering Growth: The Thriving Journey of Bangladesh’s Cable Industry
- Demand for luxury TVs surging in the GCC, says Samsung
- Video call with a traditional healer? Once unthinkable, it’s now common in South Africa
- Intelligent Buildings To Smooth GCC’s Path To Net Zero