Estonia Tall Oil Market (2025-2031) | Supply, Value, Demand, Size, Analysis, Share, Competition, Consumer Insights, Competitive, Trends, Revenue, Strategy, Challenges, Restraints, Industry, Segments, Companies, Outlook, Growth, Opportunities, Forecast, Drivers, Segmentation, Strategic Insights, Investment Trends, Pricing Analysis
Market Forecast By Product Type (Crude Tall Oil, Distilled Tall Oil, Tall Oil Fatty Acids), By Application (Adhesives, Lubricants, Surfactants), By Source (Pine Wood, Softwood, Hardwood), By Processing Method (Distillation, Fractionation, Acidulation), By End Use (Chemical Industry, Paints & Coatings, Biofuels) And Competitive Landscape
| Product Code: ETC10897695 | Publication Date: Apr 2025 | Updated Date: Apr 2026 | Product Type: Market Research Report | |
| Publisher: 6Wresearch | No. of Pages: 65 | No. of Figures: 34 | No. of Tables: 19 | |
Estonia Tall Oil Market Size (2020-2030)
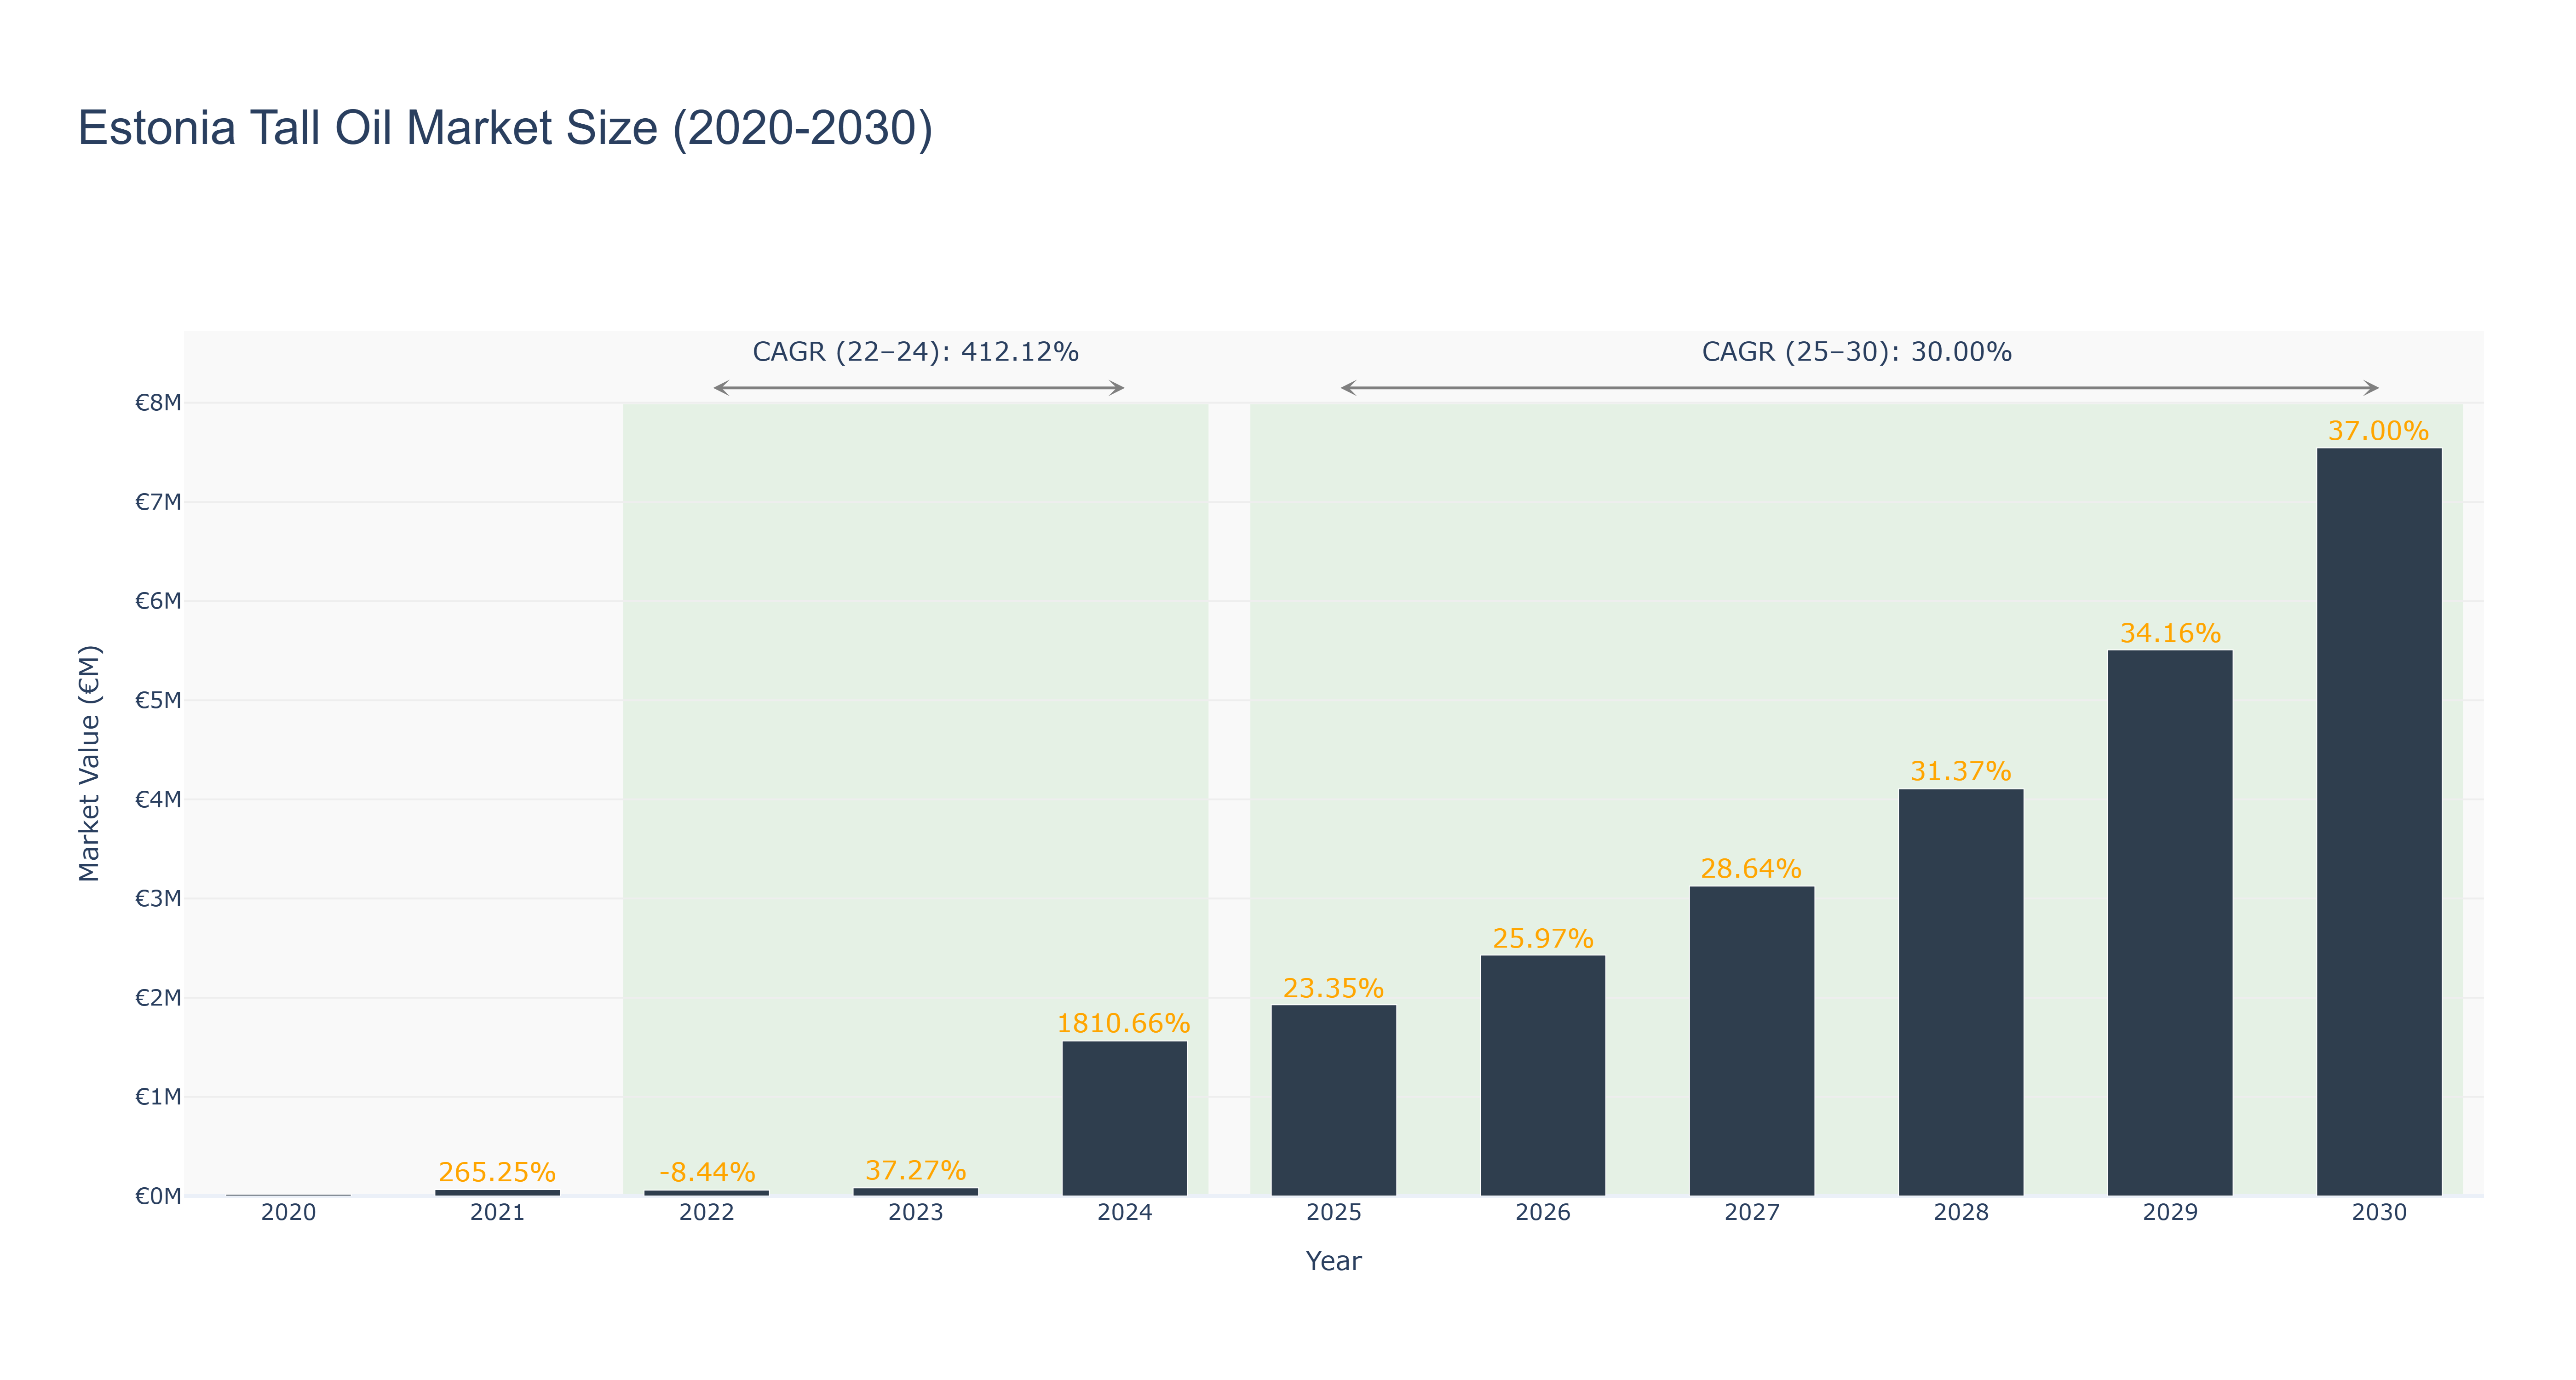
Estonia Tall Oil Market has shown a remarkable growth trajectory. The market size surged from €0.02 million in 2020 to €7.55 million in 2030, with a peak in 2029. The CAGR between 2022-2024 was an astounding 412.12%, driven by increased demand for tall oil products. Subsequently, the CAGR from 2025-2030 is projected at a steady 30.0%. The market witnessed fluctuations due to changing consumer preferences and technological advancements in tall oil extraction processes. Looking ahead, Estonia is set to launch a new sustainable tall oil production facility in 2027, aligning with the global push for eco-friendly alternatives. This development is expected to further boost market growth and solidify Estonia's position in the tall oil industry.
Estonia Tall Oil Market: Production & Trade Performance (2019-2025)
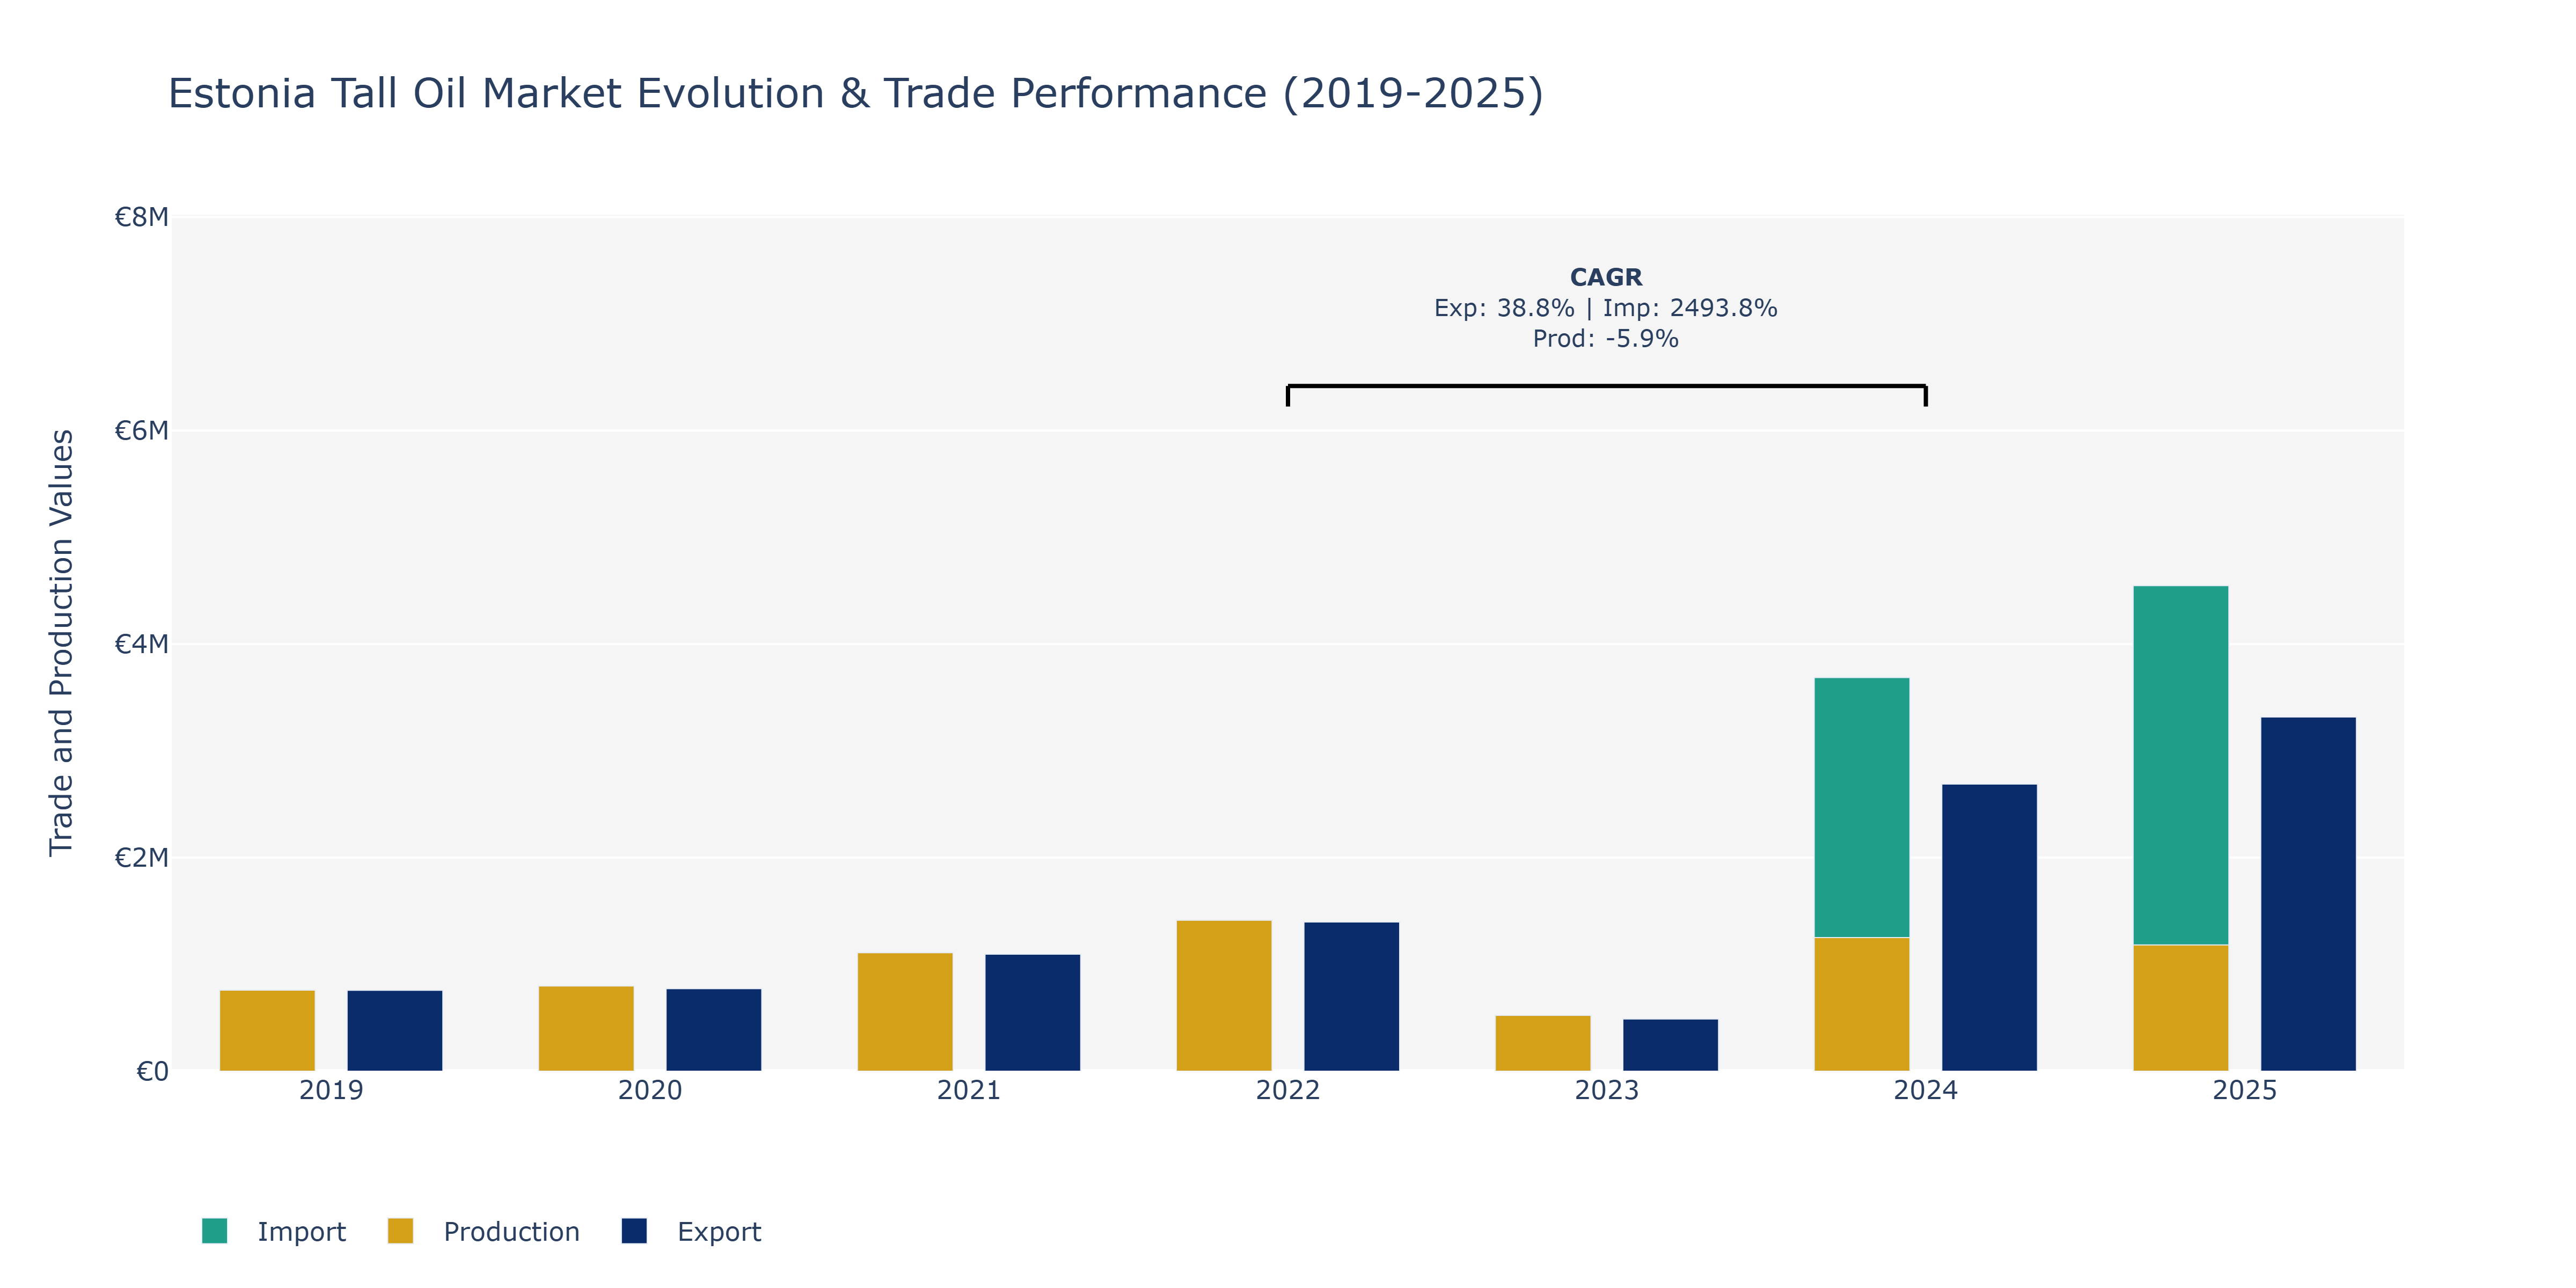
In the Estonia Tall Oil Market, exports saw a substantial upward trajectory from 2019 to 2025, with a peak in 2025 at approximately €3.32 million. This growth can be attributed to increased demand for Estonia's tall oil products globally, possibly fueled by the shift towards sustainable and renewable resources in various industries. Imports, on the other hand, fluctuated notably, reaching their highest point in 2025 at around €4.55 million, indicating a growing reliance on foreign sources. Production levels remained relatively stable, with a minor decline in 2023, possibly due to operational adjustments or market conditions. The surge in imports could be influenced by changes in domestic supply capabilities or evolving trade agreements impacting the industry landscape. To sustain market competitiveness, stakeholders may need to focus on optimizing production efficiency and exploring strategic partnerships to manage import dependencies effectively.
Key Highlights of the Report:
- Estonia Tall Oil Market Outlook
- Market Size of Estonia Tall Oil Market,2024
- Forecast of Estonia Tall Oil Market, 2031
- Historical Data and Forecast of Estonia Tall Oil Revenues & Volume for the Period 2021-2031
- Estonia Tall Oil Market Trend Evolution
- Estonia Tall Oil Market Drivers and Challenges
- Estonia Tall Oil Price Trends
- Estonia Tall Oil Porter's Five Forces
- Estonia Tall Oil Industry Life Cycle
- Historical Data and Forecast of Estonia Tall Oil Market Revenues & Volume By Product Type for the Period 2021-2031
- Historical Data and Forecast of Estonia Tall Oil Market Revenues & Volume By Crude Tall Oil for the Period 2021-2031
- Historical Data and Forecast of Estonia Tall Oil Market Revenues & Volume By Distilled Tall Oil for the Period 2021-2031
- Historical Data and Forecast of Estonia Tall Oil Market Revenues & Volume By Tall Oil Fatty Acids for the Period 2021-2031
- Historical Data and Forecast of Estonia Tall Oil Market Revenues & Volume By Application for the Period 2021-2031
- Historical Data and Forecast of Estonia Tall Oil Market Revenues & Volume By Adhesives for the Period 2021-2031
- Historical Data and Forecast of Estonia Tall Oil Market Revenues & Volume By Lubricants for the Period 2021-2031
- Historical Data and Forecast of Estonia Tall Oil Market Revenues & Volume By Surfactants for the Period 2021-2031
- Historical Data and Forecast of Estonia Tall Oil Market Revenues & Volume By Source for the Period 2021-2031
- Historical Data and Forecast of Estonia Tall Oil Market Revenues & Volume By Pine Wood for the Period 2021-2031
- Historical Data and Forecast of Estonia Tall Oil Market Revenues & Volume By Softwood for the Period 2021-2031
- Historical Data and Forecast of Estonia Tall Oil Market Revenues & Volume By Hardwood for the Period 2021-2031
- Historical Data and Forecast of Estonia Tall Oil Market Revenues & Volume By Processing Method for the Period 2021-2031
- Historical Data and Forecast of Estonia Tall Oil Market Revenues & Volume By Distillation for the Period 2021-2031
- Historical Data and Forecast of Estonia Tall Oil Market Revenues & Volume By Fractionation for the Period 2021-2031
- Historical Data and Forecast of Estonia Tall Oil Market Revenues & Volume By Acidulation for the Period 2021-2031
- Historical Data and Forecast of Estonia Tall Oil Market Revenues & Volume By End Use for the Period 2021-2031
- Historical Data and Forecast of Estonia Tall Oil Market Revenues & Volume By Chemical Industry for the Period 2021-2031
- Historical Data and Forecast of Estonia Tall Oil Market Revenues & Volume By Paints & Coatings for the Period 2021-2031
- Historical Data and Forecast of Estonia Tall Oil Market Revenues & Volume By Biofuels for the Period 2021-2031
- Estonia Tall Oil Import Export Trade Statistics
- Market Opportunity Assessment By Product Type
- Market Opportunity Assessment By Application
- Market Opportunity Assessment By Source
- Market Opportunity Assessment By Processing Method
- Market Opportunity Assessment By End Use
- Estonia Tall Oil Top Companies Market Share
- Estonia Tall Oil Competitive Benchmarking By Technical and Operational Parameters
- Estonia Tall Oil Company Profiles
- Estonia Tall Oil Key Strategic Recommendations
Frequently Asked Questions About the Market Study (FAQs):
6Wresearch actively monitors the Estonia Tall Oil Market and publishes its comprehensive annual report, highlighting emerging trends, growth drivers, revenue analysis, and forecast outlook. Our insights help businesses to make data-backed strategic decisions with ongoing market dynamics. Our analysts track relevent industries related to the Estonia Tall Oil Market, allowing our clients with actionable intelligence and reliable forecasts tailored to emerging regional needs.
Yes, we provide customisation as per your requirements. To learn more, feel free to contact us on sales@6wresearch.com
1 Executive Summary |
2 Introduction |
2.1 Key Highlights of the Report |
2.2 Report Description |
2.3 Market Scope & Segmentation |
2.4 Research Methodology |
2.5 Assumptions |
3 Estonia Tall Oil Market Overview |
3.1 Estonia Country Macro Economic Indicators |
3.2 Estonia Tall Oil Market Revenues & Volume, 2021 & 2031F |
3.3 Estonia Tall Oil Market - Industry Life Cycle |
3.4 Estonia Tall Oil Market - Porter's Five Forces |
3.5 Estonia Tall Oil Market Revenues & Volume Share, By Product Type, 2021 & 2031F |
3.6 Estonia Tall Oil Market Revenues & Volume Share, By Application, 2021 & 2031F |
3.7 Estonia Tall Oil Market Revenues & Volume Share, By Source, 2021 & 2031F |
3.8 Estonia Tall Oil Market Revenues & Volume Share, By Processing Method, 2021 & 2031F |
3.9 Estonia Tall Oil Market Revenues & Volume Share, By End Use, 2021 & 2031F |
4 Estonia Tall Oil Market Dynamics |
4.1 Impact Analysis |
4.2 Market Drivers |
4.3 Market Restraints |
5 Estonia Tall Oil Market Trends |
6 Estonia Tall Oil Market, By Types |
6.1 Estonia Tall Oil Market, By Product Type |
6.1.1 Overview and Analysis |
6.1.2 Estonia Tall Oil Market Revenues & Volume, By Product Type, 2021 - 2031F |
6.1.3 Estonia Tall Oil Market Revenues & Volume, By Crude Tall Oil, 2021 - 2031F |
6.1.4 Estonia Tall Oil Market Revenues & Volume, By Distilled Tall Oil, 2021 - 2031F |
6.1.5 Estonia Tall Oil Market Revenues & Volume, By Tall Oil Fatty Acids, 2021 - 2031F |
6.2 Estonia Tall Oil Market, By Application |
6.2.1 Overview and Analysis |
6.2.2 Estonia Tall Oil Market Revenues & Volume, By Adhesives, 2021 - 2031F |
6.2.3 Estonia Tall Oil Market Revenues & Volume, By Lubricants, 2021 - 2031F |
6.2.4 Estonia Tall Oil Market Revenues & Volume, By Surfactants, 2021 - 2031F |
6.3 Estonia Tall Oil Market, By Source |
6.3.1 Overview and Analysis |
6.3.2 Estonia Tall Oil Market Revenues & Volume, By Pine Wood, 2021 - 2031F |
6.3.3 Estonia Tall Oil Market Revenues & Volume, By Softwood, 2021 - 2031F |
6.3.4 Estonia Tall Oil Market Revenues & Volume, By Hardwood, 2021 - 2031F |
6.4 Estonia Tall Oil Market, By Processing Method |
6.4.1 Overview and Analysis |
6.4.2 Estonia Tall Oil Market Revenues & Volume, By Distillation, 2021 - 2031F |
6.4.3 Estonia Tall Oil Market Revenues & Volume, By Fractionation, 2021 - 2031F |
6.4.4 Estonia Tall Oil Market Revenues & Volume, By Acidulation, 2021 - 2031F |
6.5 Estonia Tall Oil Market, By End Use |
6.5.1 Overview and Analysis |
6.5.2 Estonia Tall Oil Market Revenues & Volume, By Chemical Industry, 2021 - 2031F |
6.5.3 Estonia Tall Oil Market Revenues & Volume, By Paints & Coatings, 2021 - 2031F |
6.5.4 Estonia Tall Oil Market Revenues & Volume, By Biofuels, 2021 - 2031F |
7 Estonia Tall Oil Market Import-Export Trade Statistics |
7.1 Estonia Tall Oil Market Export to Major Countries |
7.2 Estonia Tall Oil Market Imports from Major Countries |
8 Estonia Tall Oil Market Key Performance Indicators |
9 Estonia Tall Oil Market - Opportunity Assessment |
9.1 Estonia Tall Oil Market Opportunity Assessment, By Product Type, 2021 & 2031F |
9.2 Estonia Tall Oil Market Opportunity Assessment, By Application, 2021 & 2031F |
9.3 Estonia Tall Oil Market Opportunity Assessment, By Source, 2021 & 2031F |
9.4 Estonia Tall Oil Market Opportunity Assessment, By Processing Method, 2021 & 2031F |
9.5 Estonia Tall Oil Market Opportunity Assessment, By End Use, 2021 & 2031F |
10 Estonia Tall Oil Market - Competitive Landscape |
10.1 Estonia Tall Oil Market Revenue Share, By Companies, 2024 |
10.2 Estonia Tall Oil Market Competitive Benchmarking, By Operating and Technical Parameters |
11 Company Profiles |
12 Recommendations |
13 Disclaimer |
Export potential assessment - trade Analytics for 2030
Export potential enables firms to identify high-growth global markets with greater confidence by combining advanced trade intelligence with a structured quantitative methodology. The framework analyzes emerging demand trends and country-level import patterns while integrating macroeconomic and trade datasets such as GDP and population forecasts, bilateral import–export flows, tariff structures, elasticity differentials between developed and developing economies, geographic distance, and import demand projections. Using weighted trade values from 2020–2024 as the base period to project country-to-country export potential for 2030, these inputs are operationalized through calculated drivers such as gravity model parameters, tariff impact factors, and projected GDP per-capita growth. Through an analysis of hidden potentials, demand hotspots, and market conditions that are most favorable to success, this method enables firms to focus on target countries, maximize returns, and global expansion with data, backed by accuracy.
By factoring in the projected importer demand gap that is currently unmet and could be potential opportunity, it identifies the potential for the Exporter (Country) among 190 countries, against the general trade analysis, which identifies the biggest importer or exporter.
To discover high-growth global markets and optimize your business strategy:
Click Here
Pricing
- Single User License$ 1,995
- Department License$ 2,400
- Site License$ 3,120
- Global License$ 3,795

Search
Thought Leadership and Analyst Meet


Our Clients
Latest Reports
- Canada Cloud CFD Market (2026-2032) | Size & Revenue, Industry, Growth, Competitive Landscape, Forecast, Segmentation, Value, Outlook, Trends, Share, Analysis, Companies
- Taiwan Food Delivery Platform Market (2026-2032) | Companies, Outlook, Analysis, Trends, Value, Revenue, Segmentation, Share, Forecast, Competitive Landscape, Growth, Size & Forecast
- United Kingdom (UK) Long-term Care Insurance Market (2026-2032) | Growth, Share, Consumer Insights, Drivers, Opportunities, Competition, Pricing Analysis, Segments, Restraints, Companies, Competitive, Value, Outlook, Size, Demand, Analysis, Challenges, Strategic Insights, Investment Trends, Revenue, Trends, Supply, Forecast
- United Kingdom (UK) Long Term Care Market (2026-2032) | Companies, Outlook, Analysis, Trends, Value, Revenue, Segmentation, Share, Forecast, Competitive Landscape, Growth, Size & Forecast
- Iraq Insulation and Waterproofing Market (2026-2032) | Outlook, Drivers, Growth, Size, Share, Industry, Revenue, Trends, Demand, Competitive, Strategic Insights, Opportunities, Segments, Companies, Challenges, Strategy, Consumer Insights, Analysis, Investment Trends, Value, Segmentation, Forecast, Restraints
- India Switchgear Market Outlook (2026-2032) | Size, Share, Trends, Growth, Revenue, Forecast, Analysis, Value, Outlook
- Pakistan Contraceptive Implants Market (2025-2031) | Demand, Growth, Size, Share, Industry, Pricing Analysis, Competitive, Strategic Insights, Strategy, Consumer Insights, Analysis, Investment Trends, Opportunities, Revenue, Segments, Value, Segmentation, Supply, Forecast, Restraints, Outlook, Competition, Drivers, Trends, Companies, Challenges
- Sri Lanka Packaging Market (2026-2032) | Outlook, Competition, Drivers, Trends, Demand, Pricing Analysis, Competitive, Strategic Insights, Companies, Challenges, Strategy, Consumer Insights, Analysis, Investment Trends, Opportunities, Growth, Size, Share, Industry, Revenue, Segments, Value, Segmentation, Supply, Forecast, Restraints
- India Kids Watches Market (2026-2032) | Strategy, Consumer Insights, Analysis, Investment Trends, Opportunities, Growth, Size, Share, Industry, Revenue, Segments, Value, Segmentation, Supply, Forecast, Restraints, Outlook, Competition, Drivers, Trends, Demand, Pricing Analysis, Competitive, Strategic Insights, Companies, Challenges
- Saudi Arabia Core Assurance Service Market (2025-2031) | Strategy, Consumer Insights, Analysis, Investment Trends, Opportunities, Growth, Size, Share, Industry, Revenue, Segments, Value, Segmentation, Supply, Forecast, Restraints, Outlook, Competition, Drivers, Trends, Demand, Pricing Analysis, Competitive, Strategic Insights, Companies, Challenges
Industry Events and Analyst Meet

India EV Show 2026

EV tech India Expo 2026

Auto Tech Asia 2026

Battery Tech India 2026

Smart Production Solutions Guangzhou 2026
Whitepaper
- Middle East & Africa Commercial Security Market Click here to view more.
- Middle East & Africa Fire Safety Systems & Equipment Market Click here to view more.
- GCC Drone Market Click here to view more.
- Middle East Lighting Fixture Market Click here to view more.
- GCC Physical & Perimeter Security Market Click here to view more.
6WResearch In News
- Doha a strategic location for EV manufacturing hub: IPA Qatar
- Demand for luxury TVs surging in the GCC, says Samsung
- Empowering Growth: The Thriving Journey of Bangladesh’s Cable Industry
- Demand for luxury TVs surging in the GCC, says Samsung
- Video call with a traditional healer? Once unthinkable, it’s now common in South Africa
- Intelligent Buildings To Smooth GCC’s Path To Net Zero