Estonia Technical Glass Market (2026-2032) | Size, Investment Trends, Value, Strategy, Trends, Analysis, Share, Consumer Insights, Competition, Supply, Challenges, Outlook, Segments, Competitive, Growth, Opportunities, Industry, Drivers, Strategic Insights, Demand, Companies, Restraints, Revenue, Segmentation, Forecast, Pricing Analysis
Market Forecast By Product Type (Borosilicate Glass, Aluminosilicate Glass, Fused Quartz), By Material Type (SilicaBased, MetalOxide Based, Pure Silica), By Application (Optical Lenses, Display Screens, Laboratory Equipment), By Property (High Heat Resistance, Scratch Resistance, Chemical Stability), By End Use (Electronics, Automotive, Healthcare) And Competitive Landscape
| Product Code: ETC10903455 | Publication Date: Apr 2025 | Updated Date: Apr 2026 | Product Type: Market Research Report | |
| Publisher: 6Wresearch | No. of Pages: 65 | No. of Figures: 34 | No. of Tables: 19 | |
Estonia Technical Glass Market Size (2020-2030)
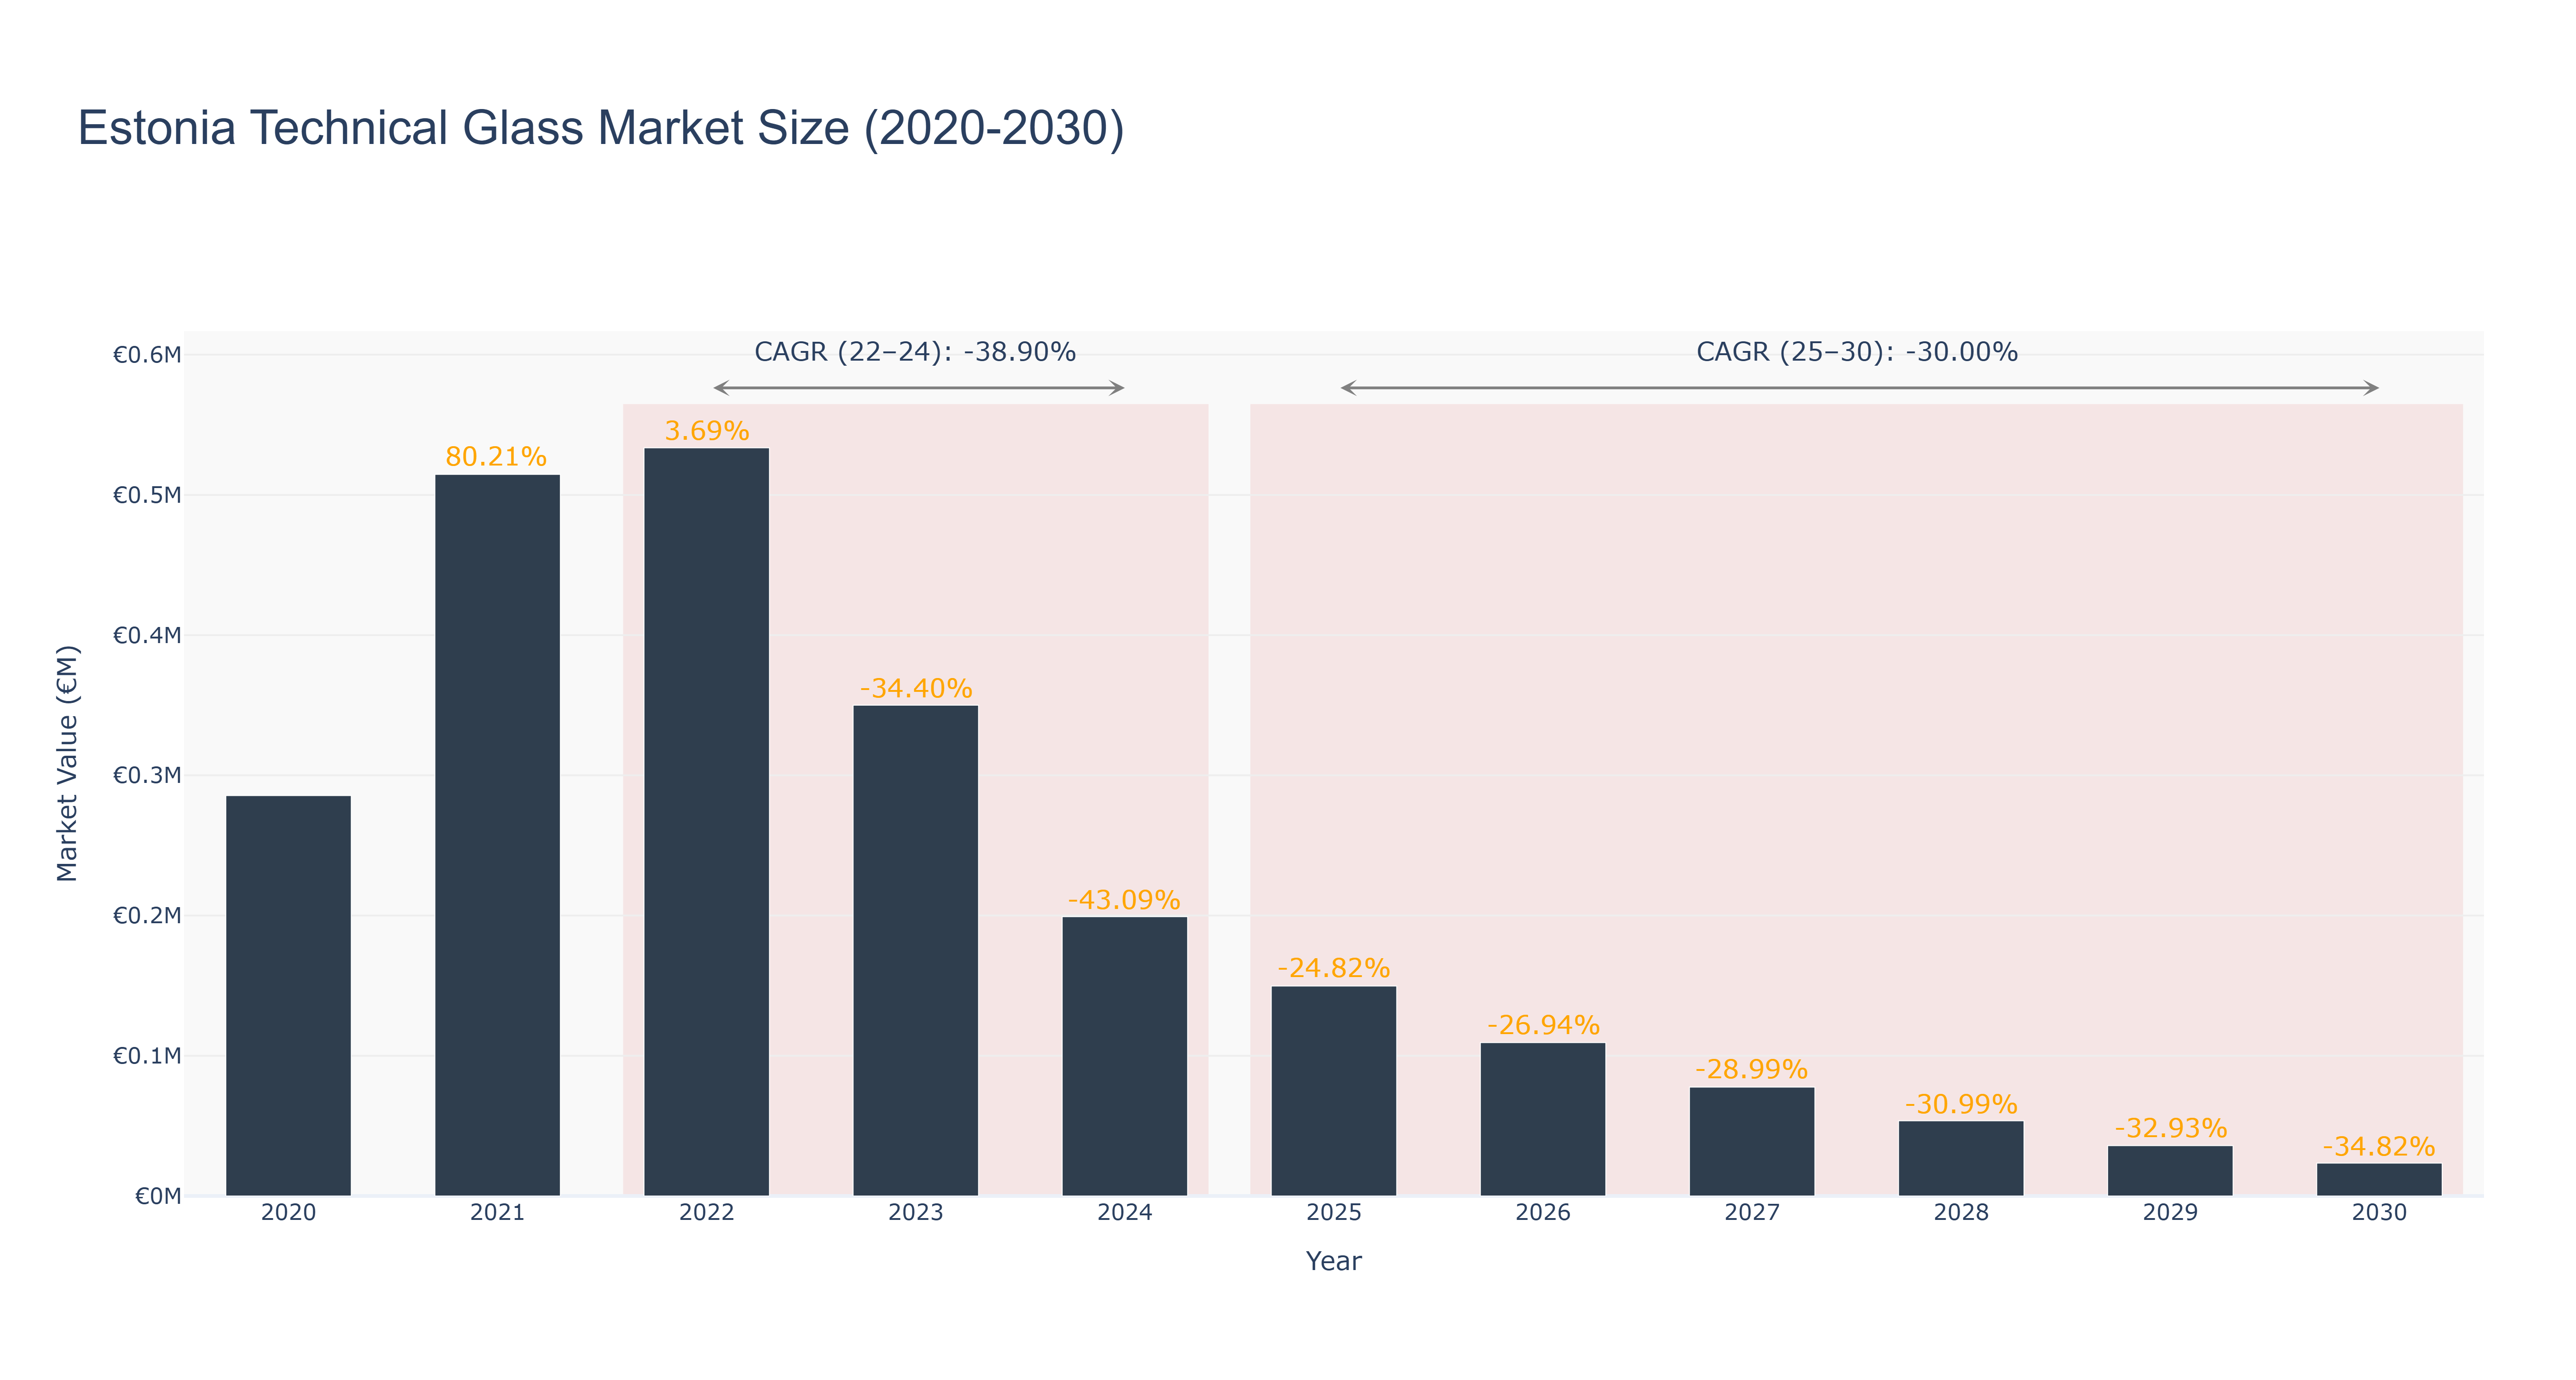
The Estonia Technical Glass Market experienced a peak market size of €0.53 million in 2022. However, the market size declined steadily over the years, reaching €0.11 million in 2026. The CAGR from 2022 to 2024 was -38.90%, while the forecasted CAGR from 2025 to 2030 is -30.0%. The market faced challenges due to a combination of factors such as economic downturns, changing consumer preferences, and increased competition. Looking ahead, Estonia's Technical Glass Market is expected to see a shift towards sustainable glass solutions to meet environmental regulations and consumer demands. Additionally, upcoming infrastructure projects in Estonia, such as the development of smart cities, are likely to drive demand for technical glass products in the near future.
Estonia Technical Glass Market: Production & Trade Performance (2019-2025)
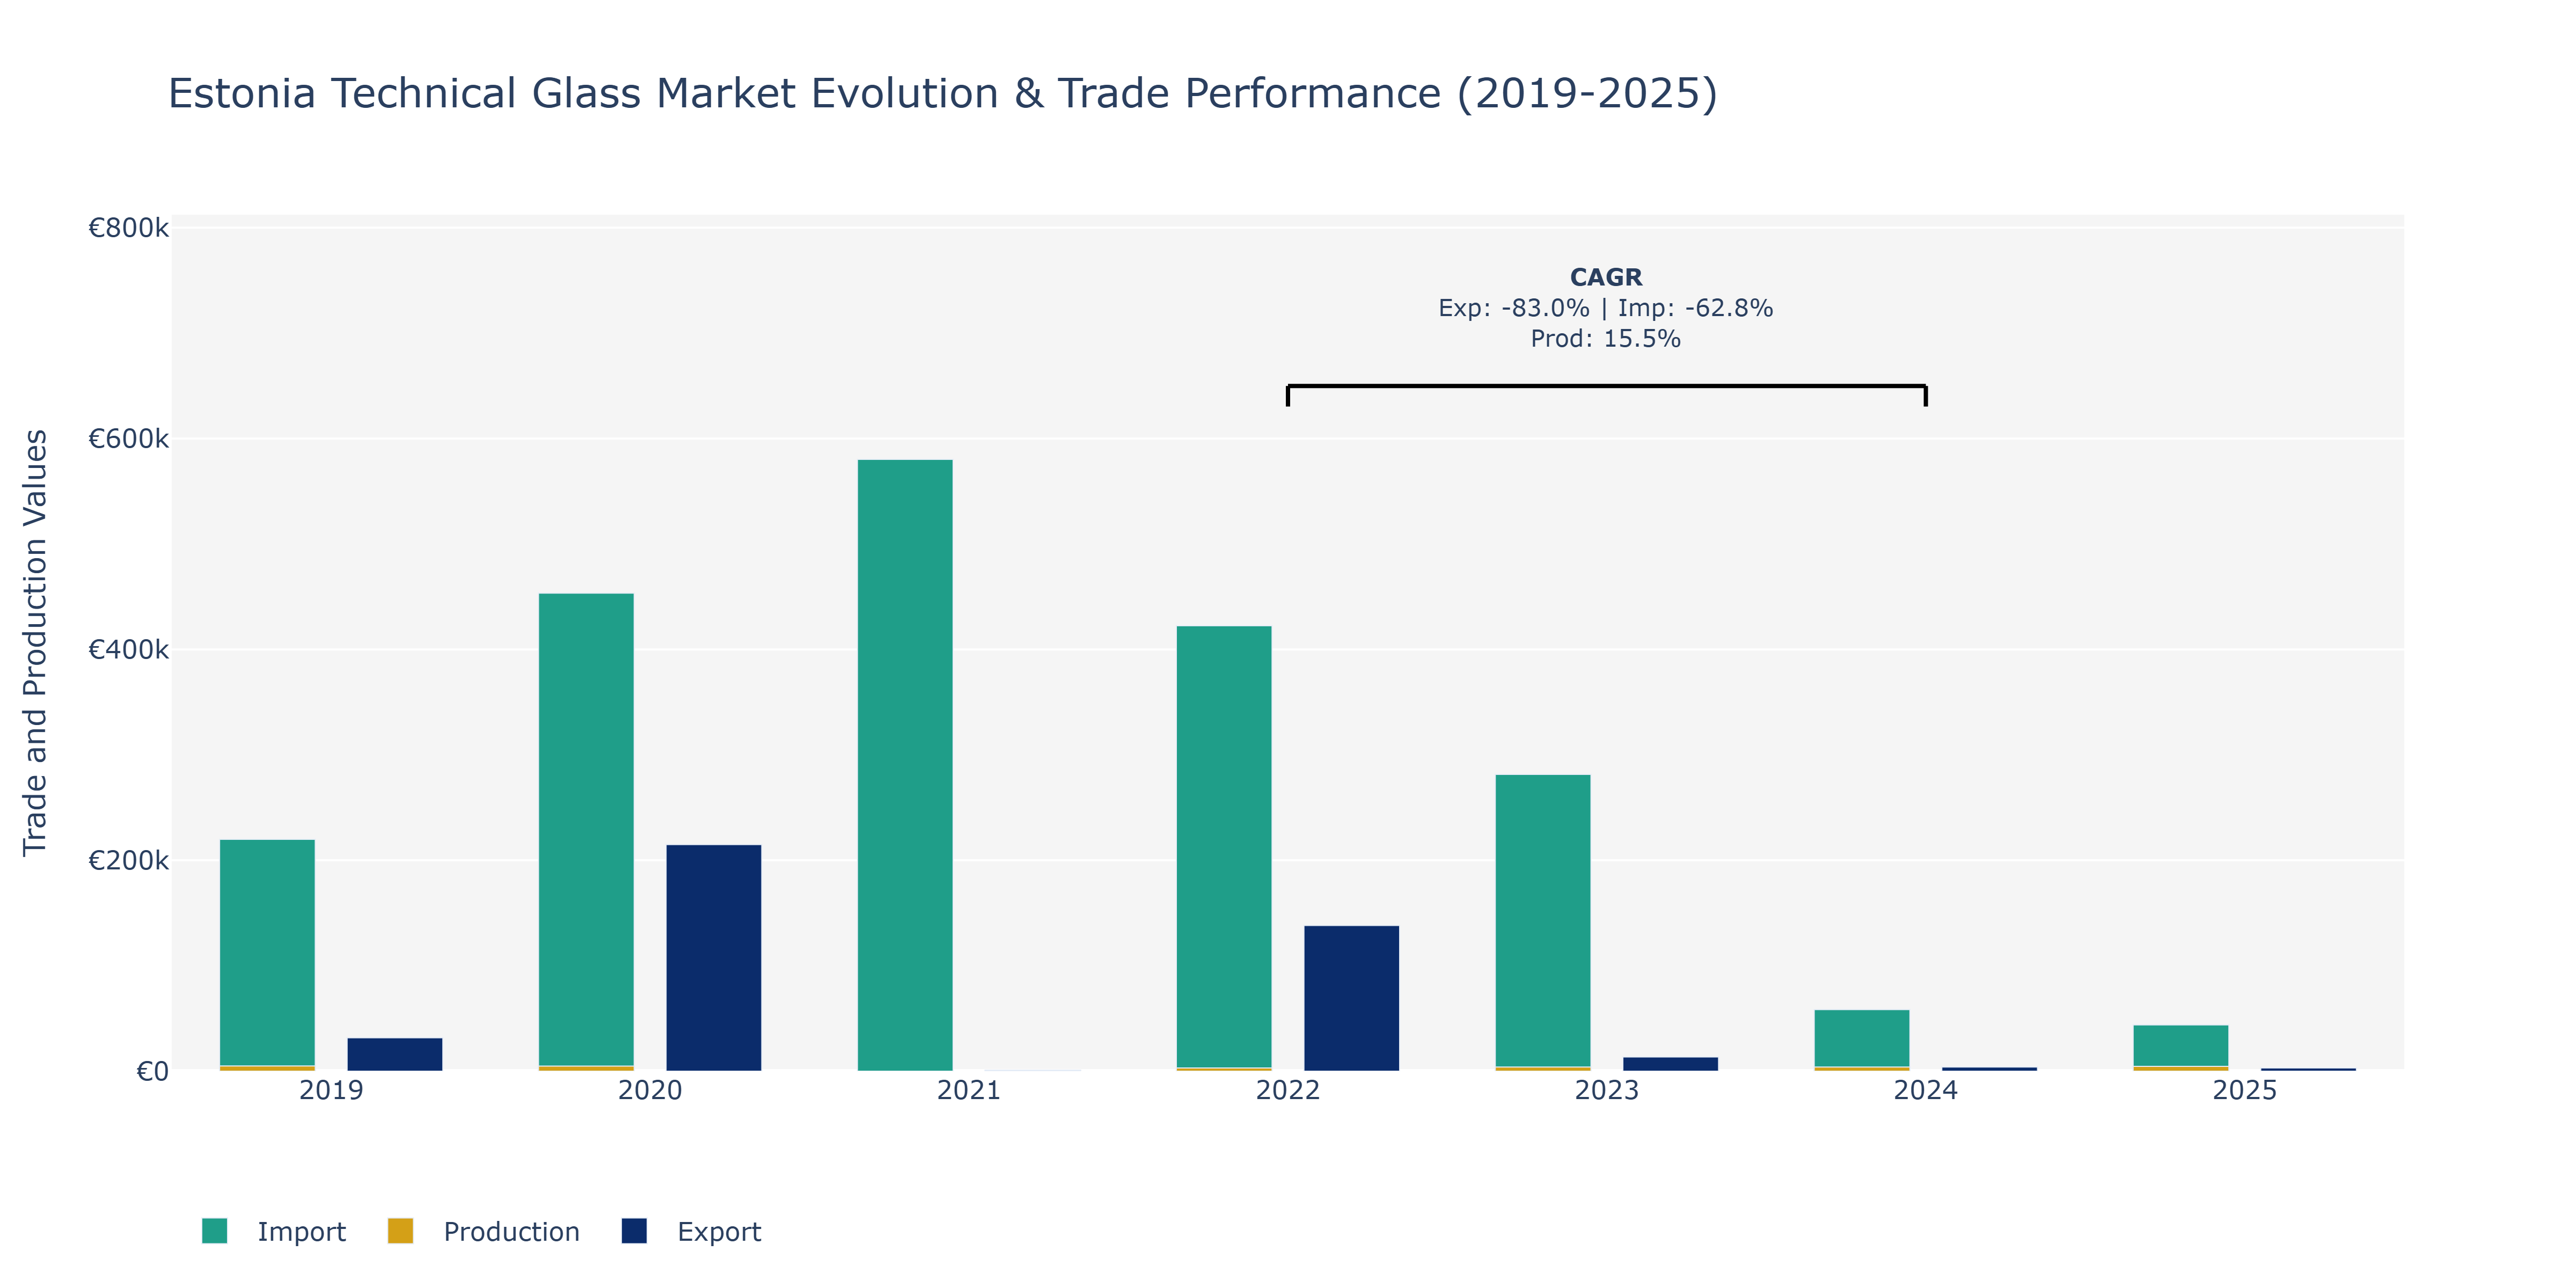
Between 2019 and 2025, the Estonia Technical Glass Market witnessed various shifts in exports, imports, and production levels. In 2020, there was a notable peak in exports at €214.99 thousand, followed by a substantial drop in 2021 to just €0.98 million. This decline could be attributed to global economic fluctuations or changes in demand for technical glass products. Imports, on the other hand, increased steadily from €219.93 thousand in 2019 to €580.28 thousand in 2021, indicating a growing demand for foreign technical glass products within Estonia. Production levels remained relatively stable, with a slight increase in 2025 to €4.55 million. The rise in production in 2025 might be linked to advancements in manufacturing technologies or increased domestic consumption. The contrasting trends in exports, imports, and production highlight the dynamic nature of the market, influenced by both domestic and international factors.
Key Highlights of the Report:
- Estonia Technical Glass Market Outlook
- Market Size of Estonia Technical Glass Market, 2025
- Forecast of Estonia Technical Glass Market, 2032
- Historical Data and Forecast of Estonia Technical Glass Revenues & Volume for the Period 2022 - 2032F
- Estonia Technical Glass Market Trend Evolution
- Estonia Technical Glass Market Drivers and Challenges
- Estonia Technical Glass Price Trends
- Estonia Technical Glass Porter's Five Forces
- Estonia Technical Glass Industry Life Cycle
- Historical Data and Forecast of Estonia Technical Glass Market Revenues & Volume By Product Type for the Period 2022 - 2032F
- Historical Data and Forecast of Estonia Technical Glass Market Revenues & Volume By Borosilicate Glass for the Period 2022 - 2032F
- Historical Data and Forecast of Estonia Technical Glass Market Revenues & Volume By Aluminosilicate Glass for the Period 2022 - 2032F
- Historical Data and Forecast of Estonia Technical Glass Market Revenues & Volume By Fused Quartz for the Period 2022 - 2032F
- Historical Data and Forecast of Estonia Technical Glass Market Revenues & Volume By Material Type for the Period 2022 - 2032F
- Historical Data and Forecast of Estonia Technical Glass Market Revenues & Volume By SilicaBased for the Period 2022 - 2032F
- Historical Data and Forecast of Estonia Technical Glass Market Revenues & Volume By MetalOxide Based for the Period 2022 - 2032F
- Historical Data and Forecast of Estonia Technical Glass Market Revenues & Volume By Pure Silica for the Period 2022 - 2032F
- Historical Data and Forecast of Estonia Technical Glass Market Revenues & Volume By Application for the Period 2022 - 2032F
- Historical Data and Forecast of Estonia Technical Glass Market Revenues & Volume By Optical Lenses for the Period 2022 - 2032F
- Historical Data and Forecast of Estonia Technical Glass Market Revenues & Volume By Display Screens for the Period 2022 - 2032F
- Historical Data and Forecast of Estonia Technical Glass Market Revenues & Volume By Laboratory Equipment for the Period 2022 - 2032F
- Historical Data and Forecast of Estonia Technical Glass Market Revenues & Volume By Property for the Period 2022 - 2032F
- Historical Data and Forecast of Estonia Technical Glass Market Revenues & Volume By High Heat Resistance for the Period 2022 - 2032F
- Historical Data and Forecast of Estonia Technical Glass Market Revenues & Volume By Scratch Resistance for the Period 2022 - 2032F
- Historical Data and Forecast of Estonia Technical Glass Market Revenues & Volume By Chemical Stability for the Period 2022 - 2032F
- Historical Data and Forecast of Estonia Technical Glass Market Revenues & Volume By End Use for the Period 2022 - 2032F
- Historical Data and Forecast of Estonia Technical Glass Market Revenues & Volume By Electronics for the Period 2022 - 2032F
- Historical Data and Forecast of Estonia Technical Glass Market Revenues & Volume By Automotive for the Period 2022 - 2032F
- Historical Data and Forecast of Estonia Technical Glass Market Revenues & Volume By Healthcare for the Period 2022 - 2032F
- Estonia Technical Glass Import Export Trade Statistics
- Market Opportunity Assessment By Product Type
- Market Opportunity Assessment By Material Type
- Market Opportunity Assessment By Application
- Market Opportunity Assessment By Property
- Market Opportunity Assessment By End Use
- Estonia Technical Glass Top Companies Market Share
- Estonia Technical Glass Competitive Benchmarking By Technical and Operational Parameters
- Estonia Technical Glass Company Profiles
- Estonia Technical Glass Key Strategic Recommendations
Frequently Asked Questions About the Market Study (FAQs):
6Wresearch actively monitors the Estonia Technical Glass Market and publishes its comprehensive annual report, highlighting emerging trends, growth drivers, revenue analysis, and forecast outlook. Our insights help businesses to make data-backed strategic decisions with ongoing market dynamics. Our analysts track relevent industries related to the Estonia Technical Glass Market, allowing our clients with actionable intelligence and reliable forecasts tailored to emerging regional needs.
Yes, we provide customisation as per your requirements. To learn more, feel free to contact us on sales@6wresearch.com
1 Executive Summary |
2 Introduction |
2.1 Key Highlights of the Report |
2.2 Report Description |
2.3 Market Scope & Segmentation |
2.4 Research Methodology |
2.5 Assumptions |
3 Estonia Technical Glass Market Overview |
3.1 Estonia Country Macro Economic Indicators |
3.2 Estonia Technical Glass Market Revenues & Volume, 2022 & 2032F |
3.3 Estonia Technical Glass Market - Industry Life Cycle |
3.4 Estonia Technical Glass Market - Porter's Five Forces |
3.5 Estonia Technical Glass Market Revenues & Volume Share, By Product Type, 2022 & 2032F |
3.6 Estonia Technical Glass Market Revenues & Volume Share, By Material Type, 2022 & 2032F |
3.7 Estonia Technical Glass Market Revenues & Volume Share, By Application, 2022 & 2032F |
3.8 Estonia Technical Glass Market Revenues & Volume Share, By Property, 2022 & 2032F |
3.9 Estonia Technical Glass Market Revenues & Volume Share, By End Use, 2022 & 2032F |
4 Estonia Technical Glass Market Dynamics |
4.1 Impact Analysis |
4.2 Market Drivers |
4.3 Market Restraints |
5 Estonia Technical Glass Market Trends |
6 Estonia Technical Glass Market, By Types |
6.1 Estonia Technical Glass Market, By Product Type |
6.1.1 Overview and Analysis |
6.1.2 Estonia Technical Glass Market Revenues & Volume, By Product Type, 2022 - 2032F |
6.1.3 Estonia Technical Glass Market Revenues & Volume, By Borosilicate Glass, 2022 - 2032F |
6.1.4 Estonia Technical Glass Market Revenues & Volume, By Aluminosilicate Glass, 2022 - 2032F |
6.1.5 Estonia Technical Glass Market Revenues & Volume, By Fused Quartz, 2022 - 2032F |
6.2 Estonia Technical Glass Market, By Material Type |
6.2.1 Overview and Analysis |
6.2.2 Estonia Technical Glass Market Revenues & Volume, By SilicaBased, 2022 - 2032F |
6.2.3 Estonia Technical Glass Market Revenues & Volume, By MetalOxide Based, 2022 - 2032F |
6.2.4 Estonia Technical Glass Market Revenues & Volume, By Pure Silica, 2022 - 2032F |
6.3 Estonia Technical Glass Market, By Application |
6.3.1 Overview and Analysis |
6.3.2 Estonia Technical Glass Market Revenues & Volume, By Optical Lenses, 2022 - 2032F |
6.3.3 Estonia Technical Glass Market Revenues & Volume, By Display Screens, 2022 - 2032F |
6.3.4 Estonia Technical Glass Market Revenues & Volume, By Laboratory Equipment, 2022 - 2032F |
6.4 Estonia Technical Glass Market, By Property |
6.4.1 Overview and Analysis |
6.4.2 Estonia Technical Glass Market Revenues & Volume, By High Heat Resistance, 2022 - 2032F |
6.4.3 Estonia Technical Glass Market Revenues & Volume, By Scratch Resistance, 2022 - 2032F |
6.4.4 Estonia Technical Glass Market Revenues & Volume, By Chemical Stability, 2022 - 2032F |
6.5 Estonia Technical Glass Market, By End Use |
6.5.1 Overview and Analysis |
6.5.2 Estonia Technical Glass Market Revenues & Volume, By Electronics, 2022 - 2032F |
6.5.3 Estonia Technical Glass Market Revenues & Volume, By Automotive, 2022 - 2032F |
6.5.4 Estonia Technical Glass Market Revenues & Volume, By Healthcare, 2022 - 2032F |
7 Estonia Technical Glass Market Import-Export Trade Statistics |
7.1 Estonia Technical Glass Market Export to Major Countries |
7.2 Estonia Technical Glass Market Imports from Major Countries |
8 Estonia Technical Glass Market Key Performance Indicators |
9 Estonia Technical Glass Market - Opportunity Assessment |
9.1 Estonia Technical Glass Market Opportunity Assessment, By Product Type, 2022 & 2032F |
9.2 Estonia Technical Glass Market Opportunity Assessment, By Material Type, 2022 & 2032F |
9.3 Estonia Technical Glass Market Opportunity Assessment, By Application, 2022 & 2032F |
9.4 Estonia Technical Glass Market Opportunity Assessment, By Property, 2022 & 2032F |
9.5 Estonia Technical Glass Market Opportunity Assessment, By End Use, 2022 & 2032F |
10 Estonia Technical Glass Market - Competitive Landscape |
10.1 Estonia Technical Glass Market Revenue Share, By Companies, 2025 |
10.2 Estonia Technical Glass Market Competitive Benchmarking, By Operating and Technical Parameters |
11 Company Profiles |
12 Recommendations |
13 Disclaimer |
Global Go To Market Strategy - 2030
Export potential enables firms to identify high-growth global markets with greater confidence by combining advanced trade intelligence with a structured quantitative methodology. The framework analyzes emerging demand trends and country-level import patterns while integrating macroeconomic and trade datasets such as GDP and population forecasts, bilateral import–export flows, tariff structures, elasticity differentials between developed and developing economies, geographic distance, and import demand projections. Using weighted trade values from 2020–2024 as the base period to project country-to-country export potential for 2030, these inputs are operationalized through calculated drivers such as gravity model parameters, tariff impact factors, and projected GDP per-capita growth. Through an analysis of hidden potentials, demand hotspots, and market conditions that are most favorable to success, this method enables firms to focus on target countries, maximize returns, and global expansion with data, backed by accuracy.
By factoring in the projected importer demand gap that is currently unmet and could be potential opportunity, it identifies the potential for the Exporter (Country) among 190 countries, against the general trade analysis, which identifies the biggest importer or exporter.
To discover high-growth global markets and optimize your business strategy:
Click Here
Pricing
- Single User License$ 1,995
- Department License$ 2,400
- Site License$ 3,120
- Global License$ 3,795

Leadership Perspectives from Industry Events
Search
Thought Leadership and Analyst Meet


Our Clients
6WResearch In News
- India Air Conditioner Market Set for Strong Rebound in 2026 After Weather-Led Correction and GST-Driven Recovery: 6Wresearch
- ADAS in India: How Automatic Emergency Braking, Blind Spot Detection & Driver Monitoring are Transforming Road Safety
- Doha a strategic location for EV manufacturing hub: IPA Qatar
- Demand for luxury TVs surging in the GCC, says Samsung
- Empowering Growth: The Thriving Journey of Bangladesh’s Cable Industry
- Demand for luxury TVs surging in the GCC, says Samsung
Latest Reports
- Poland Fire Protection Systems Market (2026-2032)
- Cape Verde Portable Hand-Thrown Extinguisher Market (2026-2032)
- Canada Portable Hand-Thrown Extinguisher Market (2026-2032)
- Cameroon Portable Hand-Thrown Extinguisher Market (2026-2032)
- Burundi Portable Hand-Thrown Extinguisher Market (2026-2032)
- Burkina Faso Portable Hand-Thrown Extinguisher Market (2026-2032)
- Bulgaria Portable Hand-Thrown Extinguisher Market (2026-2032)
- Brunei Portable Hand-Thrown Extinguisher Market (2026-2032)
- Botswana Portable Hand-Thrown Extinguisher Market (2026-2032)
- Bosnia and Herzegovina Portable Hand-Thrown Extinguisher Market (2026-2032)
Industry Events and Analyst Meet

HIMTEX 2026

India Refining Summit 2026

India EV Show 2026

EV tech India Expo 2026

Auto Tech Asia 2026
Whitepaper
- Middle East & Africa Commercial Security Market Click here to view more.
- Middle East & Africa Fire Safety Systems & Equipment Market Click here to view more.
- GCC Drone Market Click here to view more.
- Middle East Lighting Fixture Market Click here to view more.
- GCC Physical & Perimeter Security Market Click here to view more.