Finland Activated Bleaching Earth Market (2026-2032) | Size & Revenue, Segmentation, Share, Companies, Trends, Industry, Value, Growth, Analysis, Forecast, Outlook, Competitive Landscape
Market Forecast By Application (Edible Oil & Fats, Mineral Oil & Lubricants) And Competitive Landscape
| Product Code: ETC7189874 | Publication Date: Sep 2024 | Updated Date: Apr 2026 | Product Type: Market Research Report | |
| Publisher: 6Wresearch | Author: Sumit Sagar | No. of Pages: 75 | No. of Figures: 35 | No. of Tables: 20 |
Finland Activated Bleaching Earth Market Size (2020-2030)
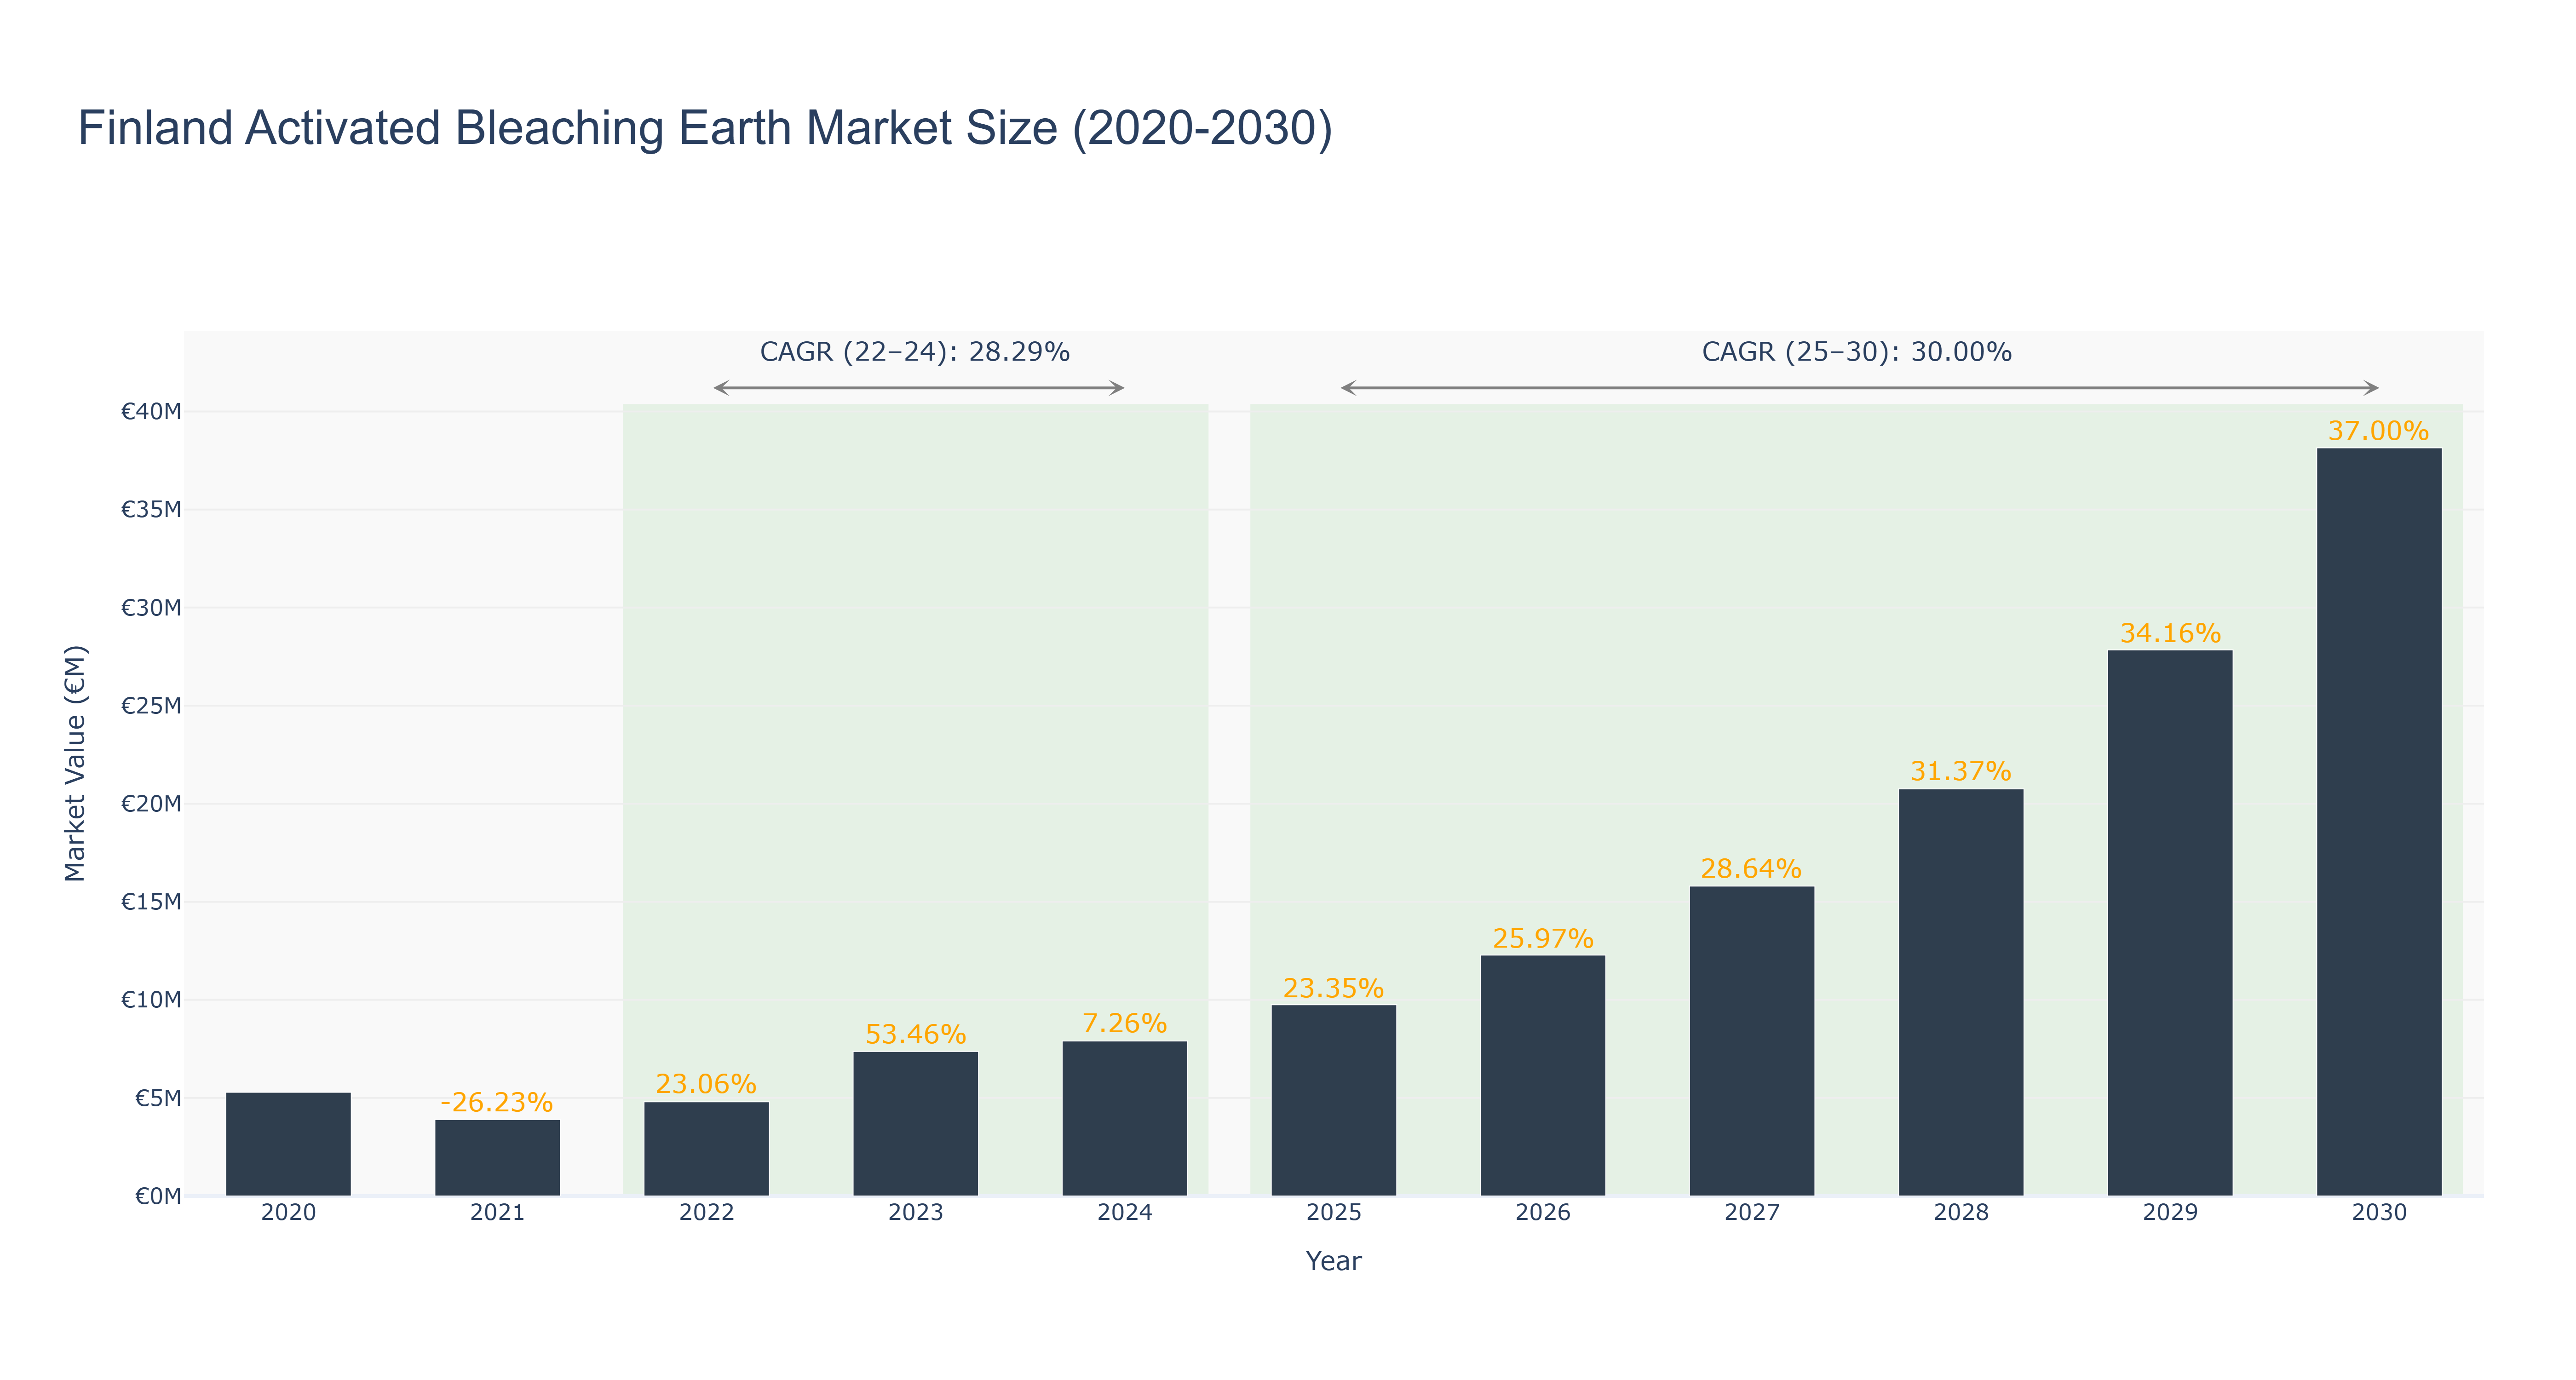
The Finland Activated Bleaching Earth Market has shown notable volatility in recent years, with the peak market size occurring in 2023 at €7.37 million, following a significant rebound from €4.80 million in 2022. The actual market witnessed a decline of 26.23% in 2021 and subsequently recovered with a 23.06% growth in 2022 and an impressive 53.46% growth in 2023. The market size is projected to continue its upward trajectory, reaching €9.75 million in 2025 and €38.15 million by 2030, reflecting a robust CAGR of 30.00% during the forecasted period. Key drivers of this growth include increasing demand for high-quality food processing and improvements in environmental regulations that favor the use of activated bleaching earth. As the market evolves, advancements in production technologies and sustainability initiatives are expected to further bolster demand, positioning Finland as a significant player in the global activated bleaching earth sector.
Finland Activated Bleaching Earth Market: Production & Trade Performance (2019-2025)
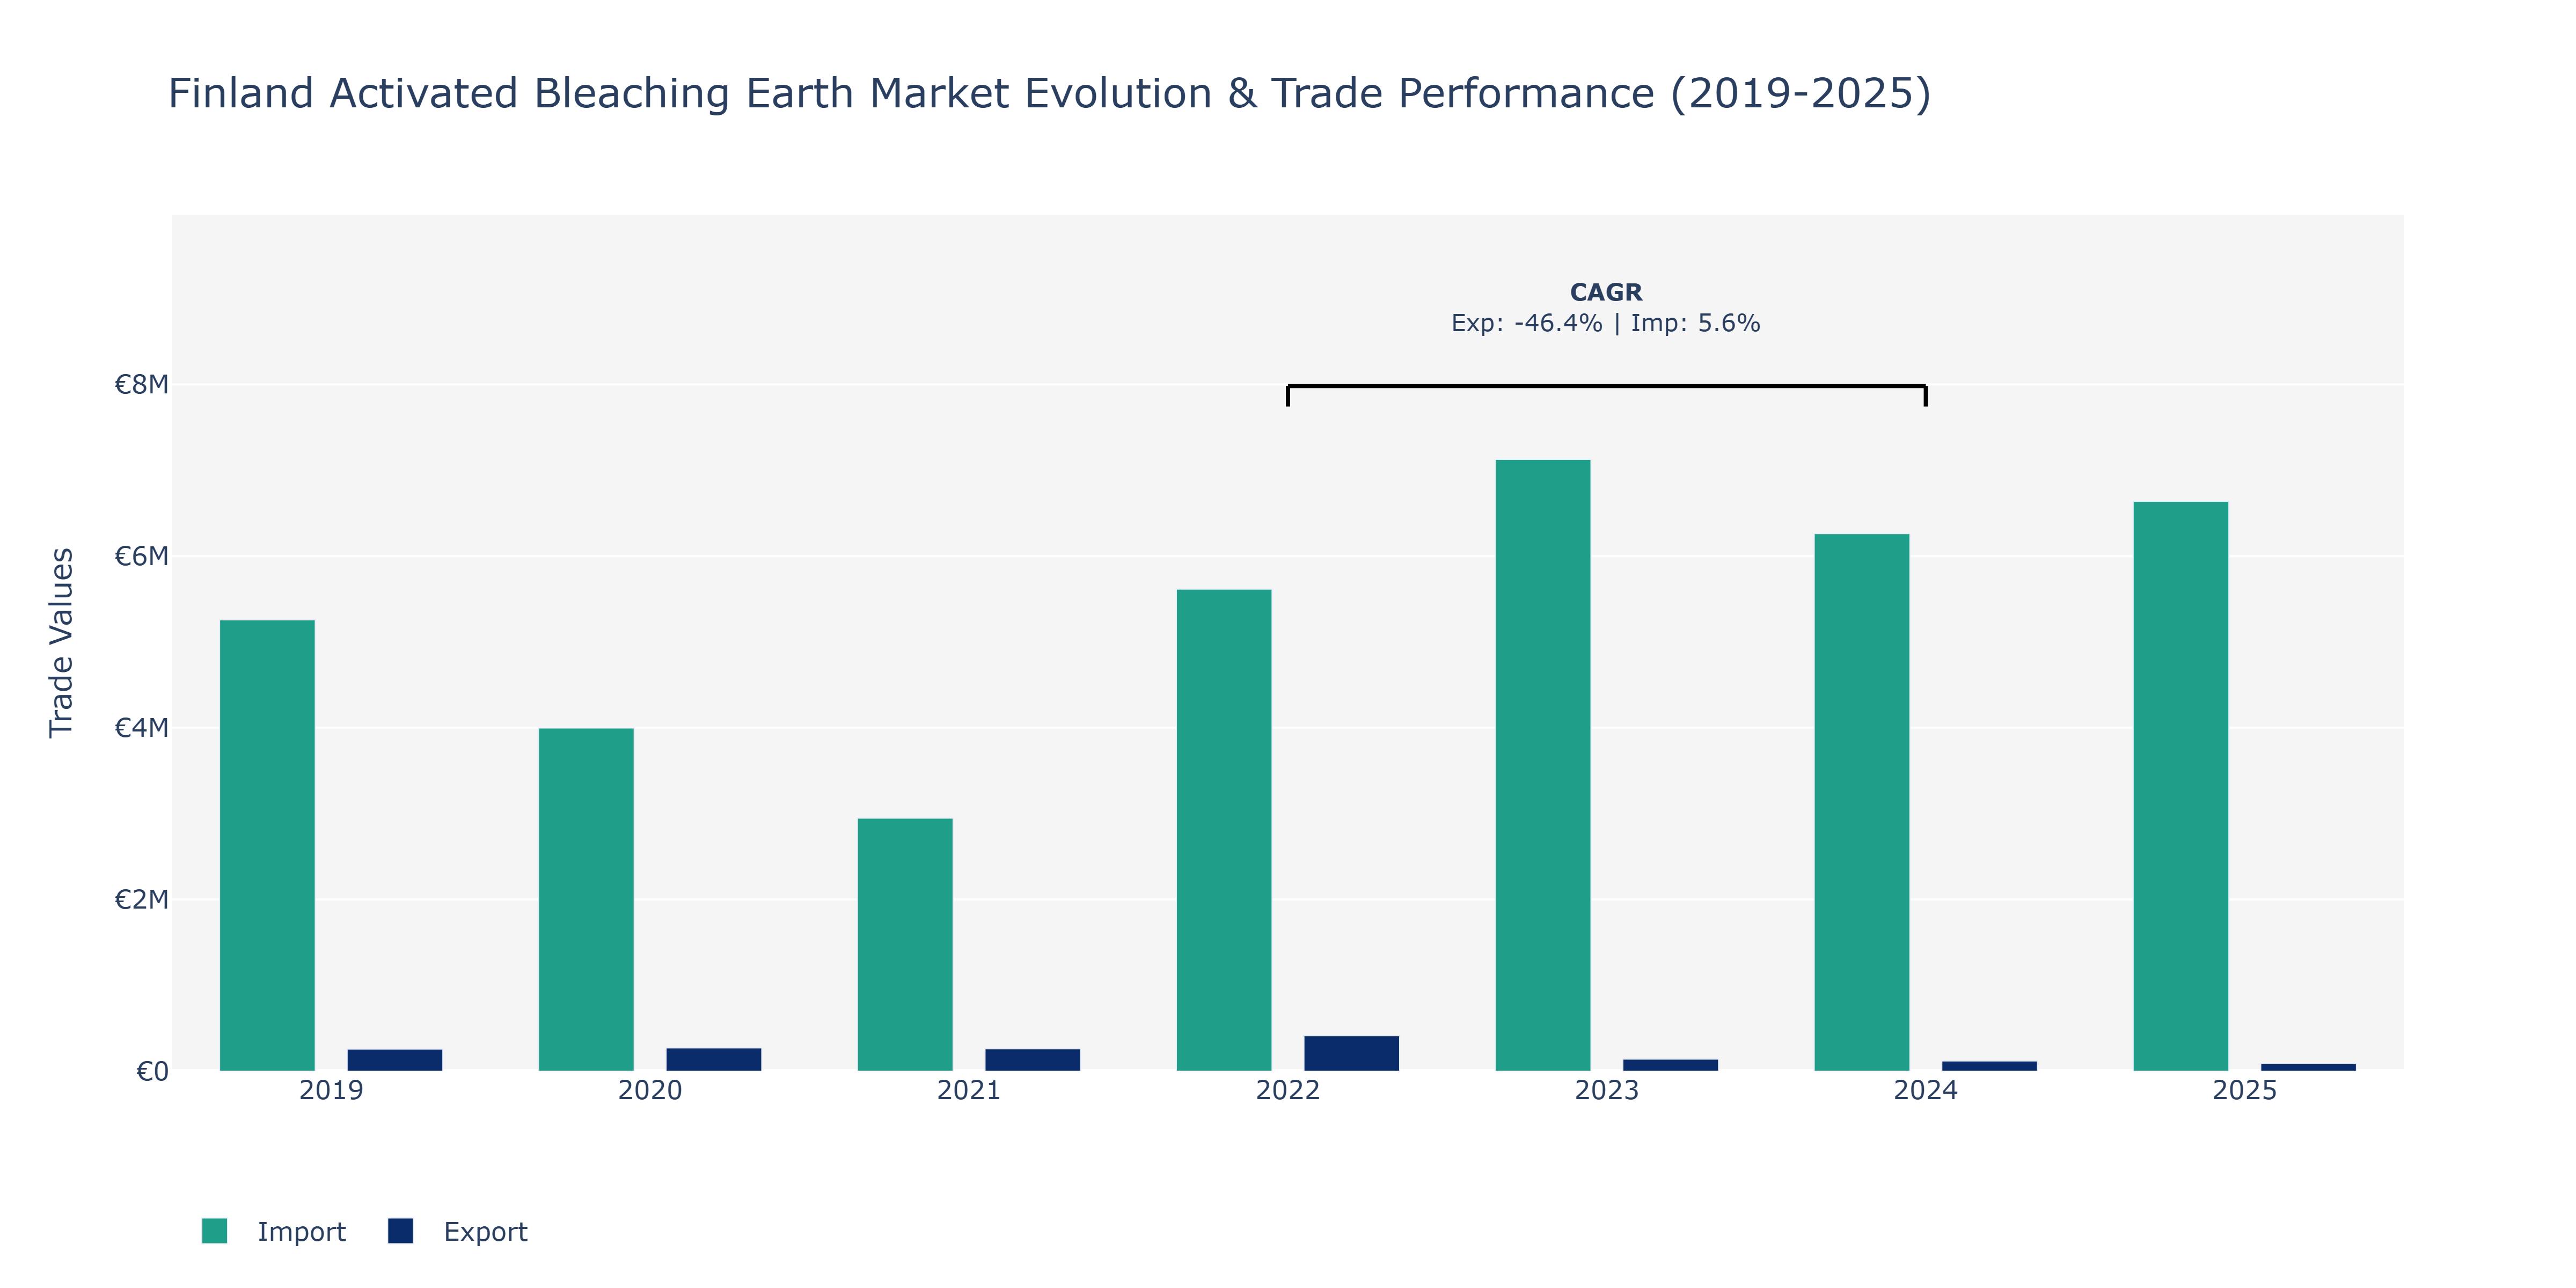
Between 2019 and 2025, Finland's Activated Bleaching Earth Market saw fluctuations in exports and imports. In 2019, exports were at €257.69 thousand, steadily increasing to €413.42 thousand in 2022, reflecting a peak before experiencing a sharp decline to €118.72 thousand in 2024. The exports further decreased to €89.25 thousand in 2025, indicating a significant drop. On the imports side, the market witnessed a consistent decline from €5.26 million in 2019 to €2.95 million in 2021. Thereafter, imports surged to a peak of €7.13 million in 2023 before slightly dropping to €6.63 million in 2025. The fluctuations in exports could be attributed to varying global demand for activated bleaching earth products, while the increase in imports can be linked to Finland's reliance on imported raw materials for production due to domestic supply shortages. These market dynamics highlight the importance of supply chain resilience and strategic sourcing decisions within the industry.
Key Highlights of the Report:
- Finland Activated Bleaching Earth Market Outlook
- Market Size of Finland Activated Bleaching Earth Market, 2025
- Forecast of Finland Activated Bleaching Earth Market, 2032
- Historical Data and Forecast of Finland Activated Bleaching Earth Revenues & Volume for the Period 2022 - 2032
- Finland Activated Bleaching Earth Market Trend Evolution
- Finland Activated Bleaching Earth Market Drivers and Challenges
- Finland Activated Bleaching Earth Price Trends
- Finland Activated Bleaching Earth Porter's Five Forces
- Finland Activated Bleaching Earth Industry Life Cycle
- Historical Data and Forecast of Finland Activated Bleaching Earth Market Revenues & Volume By Application for the Period 2022 - 2032
- Historical Data and Forecast of Finland Activated Bleaching Earth Market Revenues & Volume By Edible Oil & Fats for the Period 2022 - 2032
- Historical Data and Forecast of Finland Activated Bleaching Earth Market Revenues & Volume By Mineral Oil & Lubricants for the Period 2022 - 2032
- Finland Activated Bleaching Earth Import Export Trade Statistics
- Market Opportunity Assessment By Application
- Finland Activated Bleaching Earth Top Companies Market Share
- Finland Activated Bleaching Earth Competitive Benchmarking By Technical and Operational Parameters
- Finland Activated Bleaching Earth Company Profiles
- Finland Activated Bleaching Earth Key Strategic Recommendations
Frequently Asked Questions About the Market Study (FAQs):
6Wresearch actively monitors the Finland Activated Bleaching Earth Market and publishes its comprehensive annual report, highlighting emerging trends, growth drivers, revenue analysis, and forecast outlook. Our insights help businesses to make data-backed strategic decisions with ongoing market dynamics. Our analysts track relevent industries related to the Finland Activated Bleaching Earth Market, allowing our clients with actionable intelligence and reliable forecasts tailored to emerging regional needs.
Yes, we provide customisation as per your requirements. To learn more, feel free to contact us on sales@6wresearch.com
1 Executive Summary |
2 Introduction |
2.1 Key Highlights of the Report |
2.2 Report Description |
2.3 Market Scope & Segmentation |
2.4 Research Methodology |
2.5 Assumptions |
3 Finland Activated Bleaching Earth Market Overview |
3.1 Finland Country Macro Economic Indicators |
3.2 Finland Activated Bleaching Earth Market Revenues & Volume, 2022 & 2032F |
3.3 Finland Activated Bleaching Earth Market - Industry Life Cycle |
3.4 Finland Activated Bleaching Earth Market - Porter's Five Forces |
3.5 Finland Activated Bleaching Earth Market Revenues & Volume Share, By Application, 2022 & 2032F |
4 Finland Activated Bleaching Earth Market Dynamics |
4.1 Impact Analysis |
4.2 Market Drivers |
4.2.1 Growing demand for activated bleaching earth in various industries such as edible oil refining, cosmetics, and pharmaceuticals. |
4.2.2 Increasing awareness about the benefits of activated bleaching earth in improving product quality and purity. |
4.2.3 Technological advancements leading to the development of enhanced and efficient activated bleaching earth products. |
4.3 Market Restraints |
4.3.1 Fluctuating prices of raw materials used in the production of activated bleaching earth. |
4.3.2 Environmental concerns related to the disposal of spent bleaching earth. |
4.3.3 Intense competition from alternative products or technologies in the market. |
5 Finland Activated Bleaching Earth Market Trends |
6 Finland Activated Bleaching Earth Market, By Types |
6.1 Finland Activated Bleaching Earth Market, By Application |
6.1.1 Overview and Analysis |
6.1.2 Finland Activated Bleaching Earth Market Revenues & Volume, By Application, 2022 - 2032F |
6.1.3 Finland Activated Bleaching Earth Market Revenues & Volume, By Edible Oil & Fats, 2022 - 2032F |
6.1.4 Finland Activated Bleaching Earth Market Revenues & Volume, By Mineral Oil & Lubricants, 2022 - 2032F |
7 Finland Activated Bleaching Earth Market Import-Export Trade Statistics |
7.1 Finland Activated Bleaching Earth Market Export to Major Countries |
7.2 Finland Activated Bleaching Earth Market Imports from Major Countries |
8 Finland Activated Bleaching Earth Market Key Performance Indicators |
8.1 Average price of activated bleaching earth in the market. |
8.2 Adoption rate of activated bleaching earth among key industries. |
8.3 Quality standards compliance rate of activated bleaching earth products. |
8.4 Research and development investments in new activated bleaching earth technologies. |
9 Finland Activated Bleaching Earth Market - Opportunity Assessment |
9.1 Finland Activated Bleaching Earth Market Opportunity Assessment, By Application, 2022 & 2032F |
10 Finland Activated Bleaching Earth Market - Competitive Landscape |
10.1 Finland Activated Bleaching Earth Market Revenue Share, By Companies, 2025 |
10.2 Finland Activated Bleaching Earth Market Competitive Benchmarking, By Operating and Technical Parameters |
11 Company Profiles |
12 Recommendations |
13 Disclaimer |
Global Go To Market Strategy - 2030
Export potential enables firms to identify high-growth global markets with greater confidence by combining advanced trade intelligence with a structured quantitative methodology. The framework analyzes emerging demand trends and country-level import patterns while integrating macroeconomic and trade datasets such as GDP and population forecasts, bilateral import–export flows, tariff structures, elasticity differentials between developed and developing economies, geographic distance, and import demand projections. Using weighted trade values from 2020–2024 as the base period to project country-to-country export potential for 2030, these inputs are operationalized through calculated drivers such as gravity model parameters, tariff impact factors, and projected GDP per-capita growth. Through an analysis of hidden potentials, demand hotspots, and market conditions that are most favorable to success, this method enables firms to focus on target countries, maximize returns, and global expansion with data, backed by accuracy.
By factoring in the projected importer demand gap that is currently unmet and could be potential opportunity, it identifies the potential for the Exporter (Country) among 190 countries, against the general trade analysis, which identifies the biggest importer or exporter.
To discover high-growth global markets and optimize your business strategy:
Click Here
Pricing
- Single User License$ 1,995
- Department License$ 2,400
- Site License$ 3,120
- Global License$ 3,795

Leadership Perspectives from Industry Events
Search
Thought Leadership and Analyst Meet


Our Clients
6WResearch In News
- Doha a strategic location for EV manufacturing hub: IPA Qatar
- Demand for luxury TVs surging in the GCC, says Samsung
- Empowering Growth: The Thriving Journey of Bangladesh’s Cable Industry
- Demand for luxury TVs surging in the GCC, says Samsung
- Video call with a traditional healer? Once unthinkable, it’s now common in South Africa
- Intelligent Buildings To Smooth GCC’s Path To Net Zero
Latest Reports
- Taiwan Airport Wireless Infrastructure Market (2026-2032)
- Vietnam Airport Wireless Infrastructure Market (2026-2032)
- Thailand Airport Wireless Infrastructure Market (2026-2032)
- South Korea Airport Wireless Infrastructure Market (2026-2032)
- Romania Airport Wireless Infrastructure Market (2026-2032)
- Qatar Airport Wireless Infrastructure Market (2026-2032)
- Philippines Airport Wireless Infrastructure Market (2026-2032)
- Japan Airport Wireless Infrastructure Market (2026-2032)
- Taiwan Airport Winter Services Market (2026-2032)
- Vietnam Airport Winter Services Market (2026-2032)
Industry Events and Analyst Meet

HIMTEX 2026

India Refining Summit 2026

India EV Show 2026

EV tech India Expo 2026

Auto Tech Asia 2026
Whitepaper
- Middle East & Africa Commercial Security Market Click here to view more.
- Middle East & Africa Fire Safety Systems & Equipment Market Click here to view more.
- GCC Drone Market Click here to view more.
- Middle East Lighting Fixture Market Click here to view more.
- GCC Physical & Perimeter Security Market Click here to view more.