Finland Bio-Based Platform Chemicals Market (2026-2032) | Outlook, Forecast, Competitive, Trends, Drivers, Growth, Strategic Insights, Revenue, Industry, Companies, Segmentation, Competition, Challenges, Consumer Insights, Share, Opportunities, Investment Trends, Restraints, Analysis, Value, Segments, Supply, Size, Pricing Analysis, Demand, Strategy
Market Forecast By Chemical Type (Bio-Glycerol, Bio-Succinic Acid, Bio-Itaconic Acid), By Application (Pharmaceuticals, Polymers, Coatings), By End User (Healthcare, Automotive, Construction), By Source (Biomass, Plant-Based, Sugar-Based), By Sustainability Factor (Renewable, Eco-Friendly, Non-Toxic) And Competitive Landscape
| Product Code: ETC11446626 | Publication Date: Apr 2025 | Updated Date: Apr 2026 | Product Type: Market Research Report | |
| Publisher: 6Wresearch | No. of Pages: 65 | No. of Figures: 34 | No. of Tables: 19 | |
Finland Bio-Based Platform Chemicals Market Size (2020-2030)
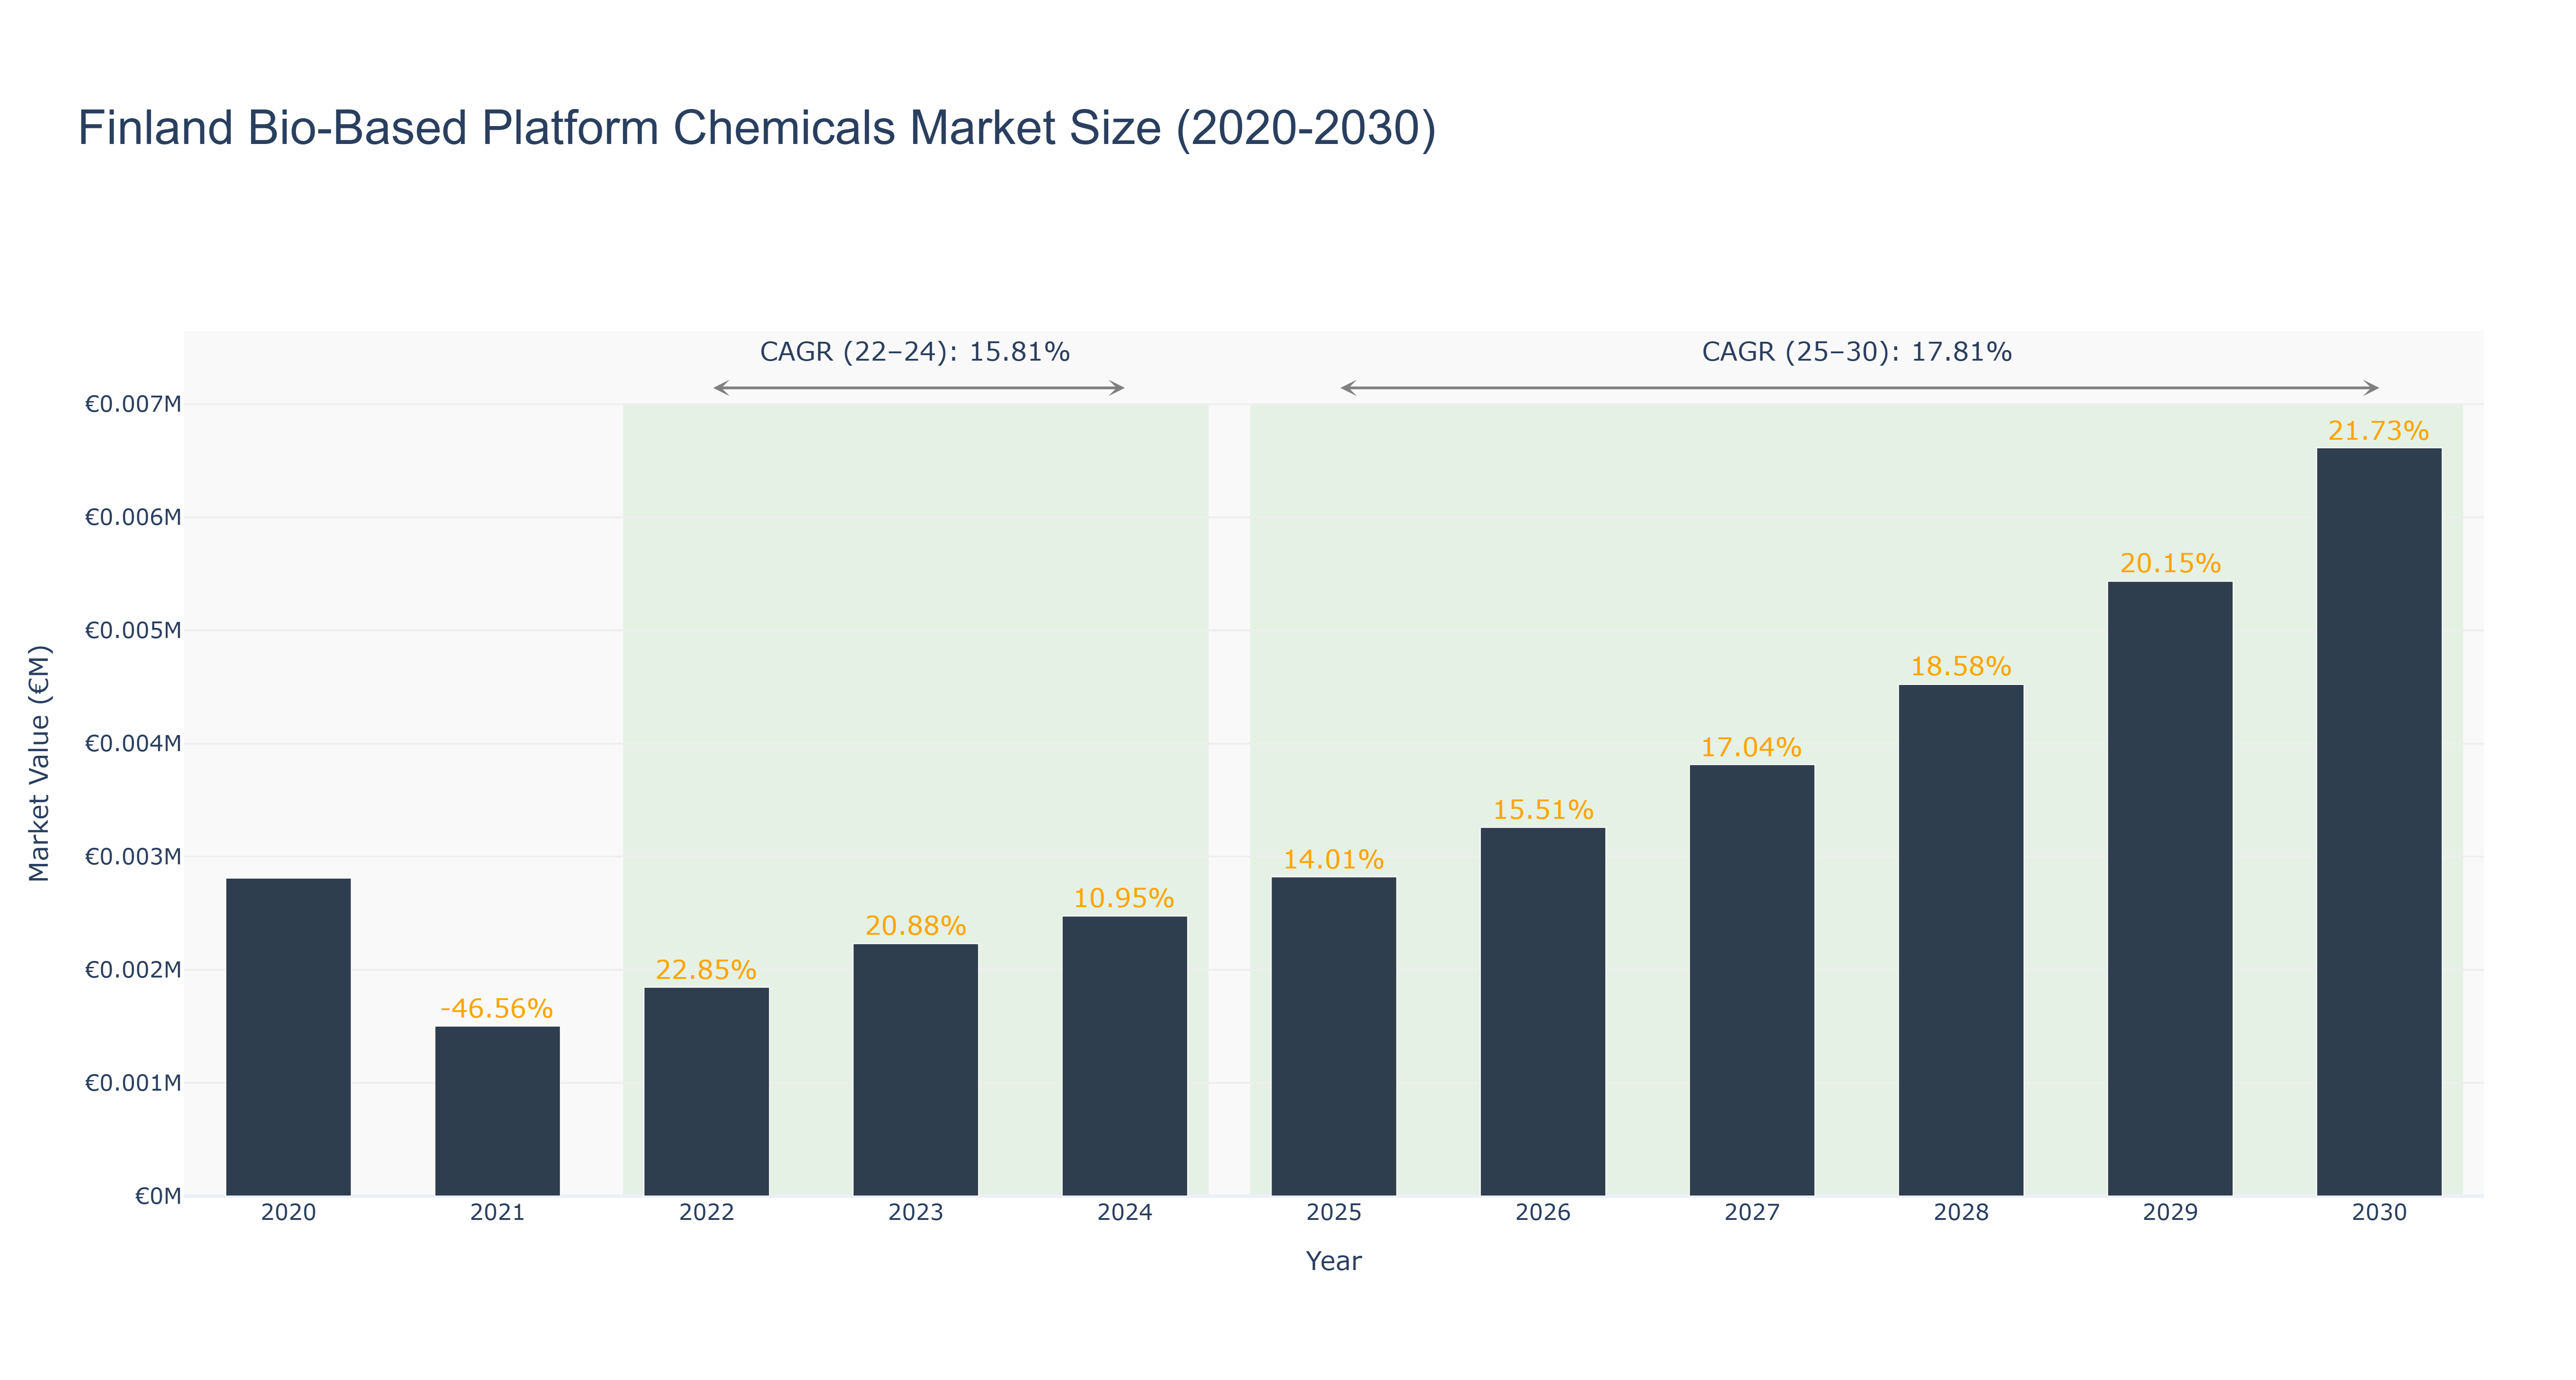
The Finland Bio-Based Platform Chemicals Market is experiencing a positive trajectory following a challenging period. In the actual data from 2020 to 2024, the market peaked in 2020 at €2.81 thousand, followed by a significant decline in 2021 to €1.50 thousand, which was a -46.56% drop. However, the market rebounded with growth rates of 22.85% in 2022 and 20.88% in 2023, reaching €2.23 thousand in 2023 and projected to grow to €2.47 thousand in 2024, reflecting a CAGR of 15.81% for the 2022-2024 period. Looking ahead, the forecasted market size is expected to expand significantly from €2.82 thousand in 2025 to €6.61 thousand by 2030, with a CAGR of 17.81%. This growth is driven by increasing sustainability initiatives and the demand for renewable chemicals, positioning Finland as a key player in the bio-based economy.
Finland Bio-Based Platform Chemicals Market: Production & Trade Performance (2019-2025)
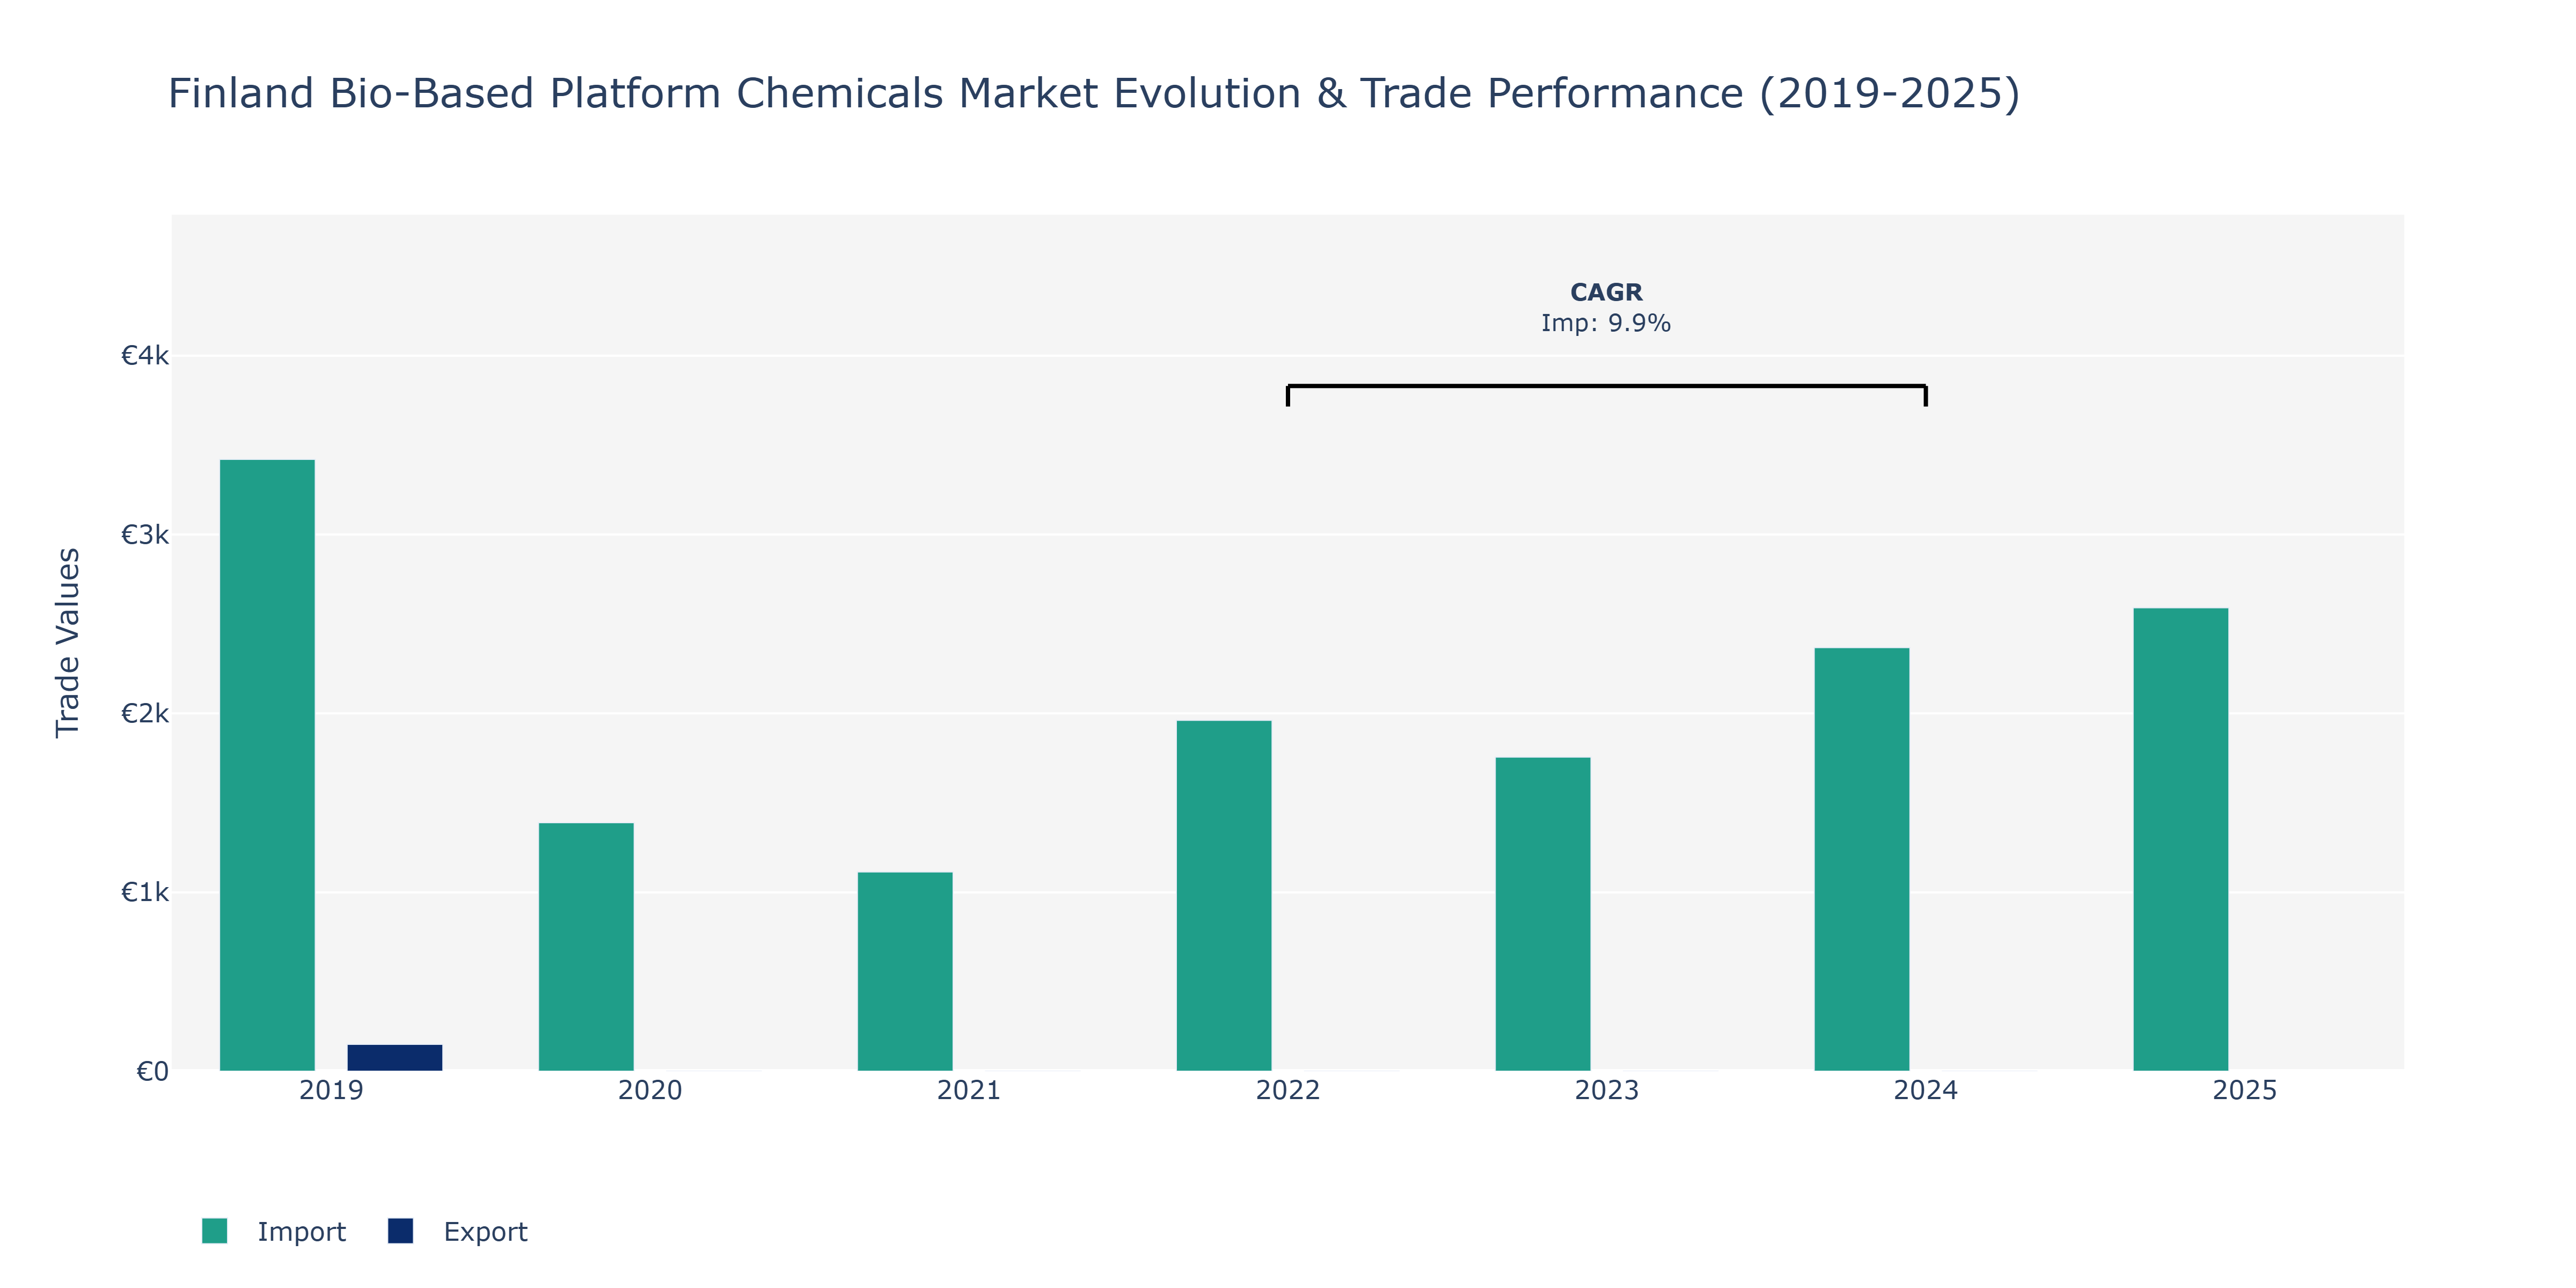
In the Finland Bio-Based Platform Chemicals Market, exports totaled €150.0 million in 2019, while imports stood at €3.42 thousand. The import segment showcased fluctuations over the subsequent years, with values in 2020, 2021, and 2023 at €1.39 thousand, €1.11 thousand, and €1.76 thousand, respectively. A substantial increase was noted in 2022 when imports reached €1.96 thousand, recording a peak at €2.59 thousand in 2025. This growth could be attributed to Finland's emphasis on sustainable practices, driving demand for bio-based platform chemicals. The shift towards eco-friendly alternatives in various industries, coupled with governmental support for green initiatives, likely bolstered import volumes. The country's strong focus on innovation and environmental responsibility aligns with the global trend towards sustainable manufacturing practices, further fueling the import of bio-based chemicals.
Key Highlights of the Report:
- Finland Bio-Based Platform Chemicals Market Outlook
- Market Size of Finland Bio-Based Platform Chemicals Market, 2025
- Forecast of Finland Bio-Based Platform Chemicals Market, 2032
- Historical Data and Forecast of Finland Bio-Based Platform Chemicals Revenues & Volume for the Period 2022 - 2032F
- Finland Bio-Based Platform Chemicals Market Trend Evolution
- Finland Bio-Based Platform Chemicals Market Drivers and Challenges
- Finland Bio-Based Platform Chemicals Price Trends
- Finland Bio-Based Platform Chemicals Porter's Five Forces
- Finland Bio-Based Platform Chemicals Industry Life Cycle
- Historical Data and Forecast of Finland Bio-Based Platform Chemicals Market Revenues & Volume By Chemical Type for the Period 2022 - 2032F
- Historical Data and Forecast of Finland Bio-Based Platform Chemicals Market Revenues & Volume By Bio-Glycerol for the Period 2022 - 2032F
- Historical Data and Forecast of Finland Bio-Based Platform Chemicals Market Revenues & Volume By Bio-Succinic Acid for the Period 2022 - 2032F
- Historical Data and Forecast of Finland Bio-Based Platform Chemicals Market Revenues & Volume By Bio-Itaconic Acid for the Period 2022 - 2032F
- Historical Data and Forecast of Finland Bio-Based Platform Chemicals Market Revenues & Volume By Application for the Period 2022 - 2032F
- Historical Data and Forecast of Finland Bio-Based Platform Chemicals Market Revenues & Volume By Pharmaceuticals for the Period 2022 - 2032F
- Historical Data and Forecast of Finland Bio-Based Platform Chemicals Market Revenues & Volume By Polymers for the Period 2022 - 2032F
- Historical Data and Forecast of Finland Bio-Based Platform Chemicals Market Revenues & Volume By Coatings for the Period 2022 - 2032F
- Historical Data and Forecast of Finland Bio-Based Platform Chemicals Market Revenues & Volume By End User for the Period 2022 - 2032F
- Historical Data and Forecast of Finland Bio-Based Platform Chemicals Market Revenues & Volume By Healthcare for the Period 2022 - 2032F
- Historical Data and Forecast of Finland Bio-Based Platform Chemicals Market Revenues & Volume By Automotive for the Period 2022 - 2032F
- Historical Data and Forecast of Finland Bio-Based Platform Chemicals Market Revenues & Volume By Construction for the Period 2022 - 2032F
- Historical Data and Forecast of Finland Bio-Based Platform Chemicals Market Revenues & Volume By Source for the Period 2022 - 2032F
- Historical Data and Forecast of Finland Bio-Based Platform Chemicals Market Revenues & Volume By Biomass for the Period 2022 - 2032F
- Historical Data and Forecast of Finland Bio-Based Platform Chemicals Market Revenues & Volume By Plant-Based for the Period 2022 - 2032F
- Historical Data and Forecast of Finland Bio-Based Platform Chemicals Market Revenues & Volume By Sugar-Based for the Period 2022 - 2032F
- Historical Data and Forecast of Finland Bio-Based Platform Chemicals Market Revenues & Volume By Sustainability Factor for the Period 2022 - 2032F
- Historical Data and Forecast of Finland Bio-Based Platform Chemicals Market Revenues & Volume By Renewable for the Period 2022 - 2032F
- Historical Data and Forecast of Finland Bio-Based Platform Chemicals Market Revenues & Volume By Eco-Friendly for the Period 2022 - 2032F
- Historical Data and Forecast of Finland Bio-Based Platform Chemicals Market Revenues & Volume By Non-Toxic for the Period 2022 - 2032F
- Finland Bio-Based Platform Chemicals Import Export Trade Statistics
- Market Opportunity Assessment By Chemical Type
- Market Opportunity Assessment By Application
- Market Opportunity Assessment By End User
- Market Opportunity Assessment By Source
- Market Opportunity Assessment By Sustainability Factor
- Finland Bio-Based Platform Chemicals Top Companies Market Share
- Finland Bio-Based Platform Chemicals Competitive Benchmarking By Technical and Operational Parameters
- Finland Bio-Based Platform Chemicals Company Profiles
- Finland Bio-Based Platform Chemicals Key Strategic Recommendations
Frequently Asked Questions About the Market Study (FAQs):
6Wresearch actively monitors the Finland Bio-Based Platform Chemicals Market and publishes its comprehensive annual report, highlighting emerging trends, growth drivers, revenue analysis, and forecast outlook. Our insights help businesses to make data-backed strategic decisions with ongoing market dynamics. Our analysts track relevent industries related to the Finland Bio-Based Platform Chemicals Market, allowing our clients with actionable intelligence and reliable forecasts tailored to emerging regional needs.
Yes, we provide customisation as per your requirements. To learn more, feel free to contact us on sales@6wresearch.com
1 Executive Summary |
2 Introduction |
2.1 Key Highlights of the Report |
2.2 Report Description |
2.3 Market Scope & Segmentation |
2.4 Research Methodology |
2.5 Assumptions |
3 Finland Bio-Based Platform Chemicals Market Overview |
3.1 Finland Country Macro Economic Indicators |
3.2 Finland Bio-Based Platform Chemicals Market Revenues & Volume, 2022 & 2032F |
3.3 Finland Bio-Based Platform Chemicals Market - Industry Life Cycle |
3.4 Finland Bio-Based Platform Chemicals Market - Porter's Five Forces |
3.5 Finland Bio-Based Platform Chemicals Market Revenues & Volume Share, By Chemical Type, 2022 & 2032F |
3.6 Finland Bio-Based Platform Chemicals Market Revenues & Volume Share, By Application, 2022 & 2032F |
3.7 Finland Bio-Based Platform Chemicals Market Revenues & Volume Share, By End User, 2022 & 2032F |
3.8 Finland Bio-Based Platform Chemicals Market Revenues & Volume Share, By Source, 2022 & 2032F |
3.9 Finland Bio-Based Platform Chemicals Market Revenues & Volume Share, By Sustainability Factor, 2022 & 2032F |
4 Finland Bio-Based Platform Chemicals Market Dynamics |
4.1 Impact Analysis |
4.2 Market Drivers |
4.2.1 Increasing consumer demand for sustainable and eco-friendly products |
4.2.2 Government initiatives promoting the use of bio-based chemicals |
4.2.3 Growing awareness about the environmental benefits of bio-based platform chemicals |
4.3 Market Restraints |
4.3.1 High production costs compared to conventional chemicals |
4.3.2 Limited availability of raw materials for bio-based chemicals production |
4.3.3 Lack of infrastructure for large-scale production and distribution |
5 Finland Bio-Based Platform Chemicals Market Trends |
6 Finland Bio-Based Platform Chemicals Market, By Types |
6.1 Finland Bio-Based Platform Chemicals Market, By Chemical Type |
6.1.1 Overview and Analysis |
6.1.2 Finland Bio-Based Platform Chemicals Market Revenues & Volume, By Chemical Type, 2022 - 2032F |
6.1.3 Finland Bio-Based Platform Chemicals Market Revenues & Volume, By Bio-Glycerol, 2022 - 2032F |
6.1.4 Finland Bio-Based Platform Chemicals Market Revenues & Volume, By Bio-Succinic Acid, 2022 - 2032F |
6.1.5 Finland Bio-Based Platform Chemicals Market Revenues & Volume, By Bio-Itaconic Acid, 2022 - 2032F |
6.2 Finland Bio-Based Platform Chemicals Market, By Application |
6.2.1 Overview and Analysis |
6.2.2 Finland Bio-Based Platform Chemicals Market Revenues & Volume, By Pharmaceuticals, 2022 - 2032F |
6.2.3 Finland Bio-Based Platform Chemicals Market Revenues & Volume, By Polymers, 2022 - 2032F |
6.2.4 Finland Bio-Based Platform Chemicals Market Revenues & Volume, By Coatings, 2022 - 2032F |
6.3 Finland Bio-Based Platform Chemicals Market, By End User |
6.3.1 Overview and Analysis |
6.3.2 Finland Bio-Based Platform Chemicals Market Revenues & Volume, By Healthcare, 2022 - 2032F |
6.3.3 Finland Bio-Based Platform Chemicals Market Revenues & Volume, By Automotive, 2022 - 2032F |
6.3.4 Finland Bio-Based Platform Chemicals Market Revenues & Volume, By Construction, 2022 - 2032F |
6.4 Finland Bio-Based Platform Chemicals Market, By Source |
6.4.1 Overview and Analysis |
6.4.2 Finland Bio-Based Platform Chemicals Market Revenues & Volume, By Biomass, 2022 - 2032F |
6.4.3 Finland Bio-Based Platform Chemicals Market Revenues & Volume, By Plant-Based, 2022 - 2032F |
6.4.4 Finland Bio-Based Platform Chemicals Market Revenues & Volume, By Sugar-Based, 2022 - 2032F |
6.5 Finland Bio-Based Platform Chemicals Market, By Sustainability Factor |
6.5.1 Overview and Analysis |
6.5.2 Finland Bio-Based Platform Chemicals Market Revenues & Volume, By Renewable, 2022 - 2032F |
6.5.3 Finland Bio-Based Platform Chemicals Market Revenues & Volume, By Eco-Friendly, 2022 - 2032F |
6.5.4 Finland Bio-Based Platform Chemicals Market Revenues & Volume, By Non-Toxic, 2022 - 2032F |
7 Finland Bio-Based Platform Chemicals Market Import-Export Trade Statistics |
7.1 Finland Bio-Based Platform Chemicals Market Export to Major Countries |
7.2 Finland Bio-Based Platform Chemicals Market Imports from Major Countries |
8 Finland Bio-Based Platform Chemicals Market Key Performance Indicators |
8.1 Percentage increase in research and development investments in bio-based platform chemicals |
8.2 Number of new partnerships and collaborations in the bio-based chemicals sector |
8.3 Growth in the number of bio-based chemicals patents filed |
8.4 Percentage of companies incorporating bio-based platform chemicals in their product lines |
8.5 Improvement in carbon footprint reduction metrics for companies using bio-based platform chemicals |
9 Finland Bio-Based Platform Chemicals Market - Opportunity Assessment |
9.1 Finland Bio-Based Platform Chemicals Market Opportunity Assessment, By Chemical Type, 2022 & 2032F |
9.2 Finland Bio-Based Platform Chemicals Market Opportunity Assessment, By Application, 2022 & 2032F |
9.3 Finland Bio-Based Platform Chemicals Market Opportunity Assessment, By End User, 2022 & 2032F |
9.4 Finland Bio-Based Platform Chemicals Market Opportunity Assessment, By Source, 2022 & 2032F |
9.5 Finland Bio-Based Platform Chemicals Market Opportunity Assessment, By Sustainability Factor, 2022 & 2032F |
10 Finland Bio-Based Platform Chemicals Market - Competitive Landscape |
10.1 Finland Bio-Based Platform Chemicals Market Revenue Share, By Companies, 2025 |
10.2 Finland Bio-Based Platform Chemicals Market Competitive Benchmarking, By Operating and Technical Parameters |
11 Company Profiles |
12 Recommendations |
13 Disclaimer |
Export potential assessment - trade Analytics for 2030
Export potential enables firms to identify high-growth global markets with greater confidence by combining advanced trade intelligence with a structured quantitative methodology. The framework analyzes emerging demand trends and country-level import patterns while integrating macroeconomic and trade datasets such as GDP and population forecasts, bilateral import–export flows, tariff structures, elasticity differentials between developed and developing economies, geographic distance, and import demand projections. Using weighted trade values from 2020–2024 as the base period to project country-to-country export potential for 2030, these inputs are operationalized through calculated drivers such as gravity model parameters, tariff impact factors, and projected GDP per-capita growth. Through an analysis of hidden potentials, demand hotspots, and market conditions that are most favorable to success, this method enables firms to focus on target countries, maximize returns, and global expansion with data, backed by accuracy.
By factoring in the projected importer demand gap that is currently unmet and could be potential opportunity, it identifies the potential for the Exporter (Country) among 190 countries, against the general trade analysis, which identifies the biggest importer or exporter.
To discover high-growth global markets and optimize your business strategy:
Click Here
Pricing
- Single User License$ 1,995
- Department License$ 2,400
- Site License$ 3,120
- Global License$ 3,795

Search
Thought Leadership and Analyst Meet


Our Clients
Latest Reports
- Canada Cloud CFD Market (2026-2032) | Size & Revenue, Industry, Growth, Competitive Landscape, Forecast, Segmentation, Value, Outlook, Trends, Share, Analysis, Companies
- Taiwan Food Delivery Platform Market (2026-2032) | Companies, Outlook, Analysis, Trends, Value, Revenue, Segmentation, Share, Forecast, Competitive Landscape, Growth, Size & Forecast
- United Kingdom (UK) Long-term Care Insurance Market (2026-2032) | Growth, Share, Consumer Insights, Drivers, Opportunities, Competition, Pricing Analysis, Segments, Restraints, Companies, Competitive, Value, Outlook, Size, Demand, Analysis, Challenges, Strategic Insights, Investment Trends, Revenue, Trends, Supply, Forecast
- United Kingdom (UK) Long Term Care Market (2026-2032) | Companies, Outlook, Analysis, Trends, Value, Revenue, Segmentation, Share, Forecast, Competitive Landscape, Growth, Size & Forecast
- Iraq Insulation and Waterproofing Market (2026-2032) | Outlook, Drivers, Growth, Size, Share, Industry, Revenue, Trends, Demand, Competitive, Strategic Insights, Opportunities, Segments, Companies, Challenges, Strategy, Consumer Insights, Analysis, Investment Trends, Value, Segmentation, Forecast, Restraints
- India Switchgear Market Outlook (2026-2032) | Size, Share, Trends, Growth, Revenue, Forecast, Analysis, Value, Outlook
- Pakistan Contraceptive Implants Market (2025-2031) | Demand, Growth, Size, Share, Industry, Pricing Analysis, Competitive, Strategic Insights, Strategy, Consumer Insights, Analysis, Investment Trends, Opportunities, Revenue, Segments, Value, Segmentation, Supply, Forecast, Restraints, Outlook, Competition, Drivers, Trends, Companies, Challenges
- Sri Lanka Packaging Market (2026-2032) | Outlook, Competition, Drivers, Trends, Demand, Pricing Analysis, Competitive, Strategic Insights, Companies, Challenges, Strategy, Consumer Insights, Analysis, Investment Trends, Opportunities, Growth, Size, Share, Industry, Revenue, Segments, Value, Segmentation, Supply, Forecast, Restraints
- India Kids Watches Market (2026-2032) | Strategy, Consumer Insights, Analysis, Investment Trends, Opportunities, Growth, Size, Share, Industry, Revenue, Segments, Value, Segmentation, Supply, Forecast, Restraints, Outlook, Competition, Drivers, Trends, Demand, Pricing Analysis, Competitive, Strategic Insights, Companies, Challenges
- Saudi Arabia Core Assurance Service Market (2025-2031) | Strategy, Consumer Insights, Analysis, Investment Trends, Opportunities, Growth, Size, Share, Industry, Revenue, Segments, Value, Segmentation, Supply, Forecast, Restraints, Outlook, Competition, Drivers, Trends, Demand, Pricing Analysis, Competitive, Strategic Insights, Companies, Challenges
Industry Events and Analyst Meet

India EV Show 2026

EV tech India Expo 2026

Auto Tech Asia 2026

Battery Tech India 2026

Smart Production Solutions Guangzhou 2026
Whitepaper
- Middle East & Africa Commercial Security Market Click here to view more.
- Middle East & Africa Fire Safety Systems & Equipment Market Click here to view more.
- GCC Drone Market Click here to view more.
- Middle East Lighting Fixture Market Click here to view more.
- GCC Physical & Perimeter Security Market Click here to view more.
6WResearch In News
- Doha a strategic location for EV manufacturing hub: IPA Qatar
- Demand for luxury TVs surging in the GCC, says Samsung
- Empowering Growth: The Thriving Journey of Bangladesh’s Cable Industry
- Demand for luxury TVs surging in the GCC, says Samsung
- Video call with a traditional healer? Once unthinkable, it’s now common in South Africa
- Intelligent Buildings To Smooth GCC’s Path To Net Zero