Finland Copper Sulfate Market (2026-2032) | Segmentation, Trends, Value, Competition, Segments, Analysis, Competitive, Share, Challenges, Demand, Pricing Analysis, Drivers, Strategic Insights, Consumer Insights, Size, Companies, Opportunities, Strategy, Forecast, Restraints, Revenue, Industry, Investment Trends, Supply, Growth, Outlook
Market Forecast By Form (Powder, Liquid, Crystals, Others), By Grade (Technical Grade, Industrial Grade, Feed Grade, Others), By Application (Fungicide, Electroplating, Feed Additive, Others), By End-Use (Agriculture, Electronics, Animal Nutrition, Others), By Distribution Channel (Direct Sales, Distributors, Online Sales, Others) And Competitive Landscape
| Product Code: ETC11761698 | Publication Date: Apr 2025 | Updated Date: Apr 2026 | Product Type: Market Research Report | |
| Publisher: 6Wresearch | No. of Pages: 65 | No. of Figures: 34 | No. of Tables: 19 | |
Finland Copper Sulfate Market Size (2020-2030)
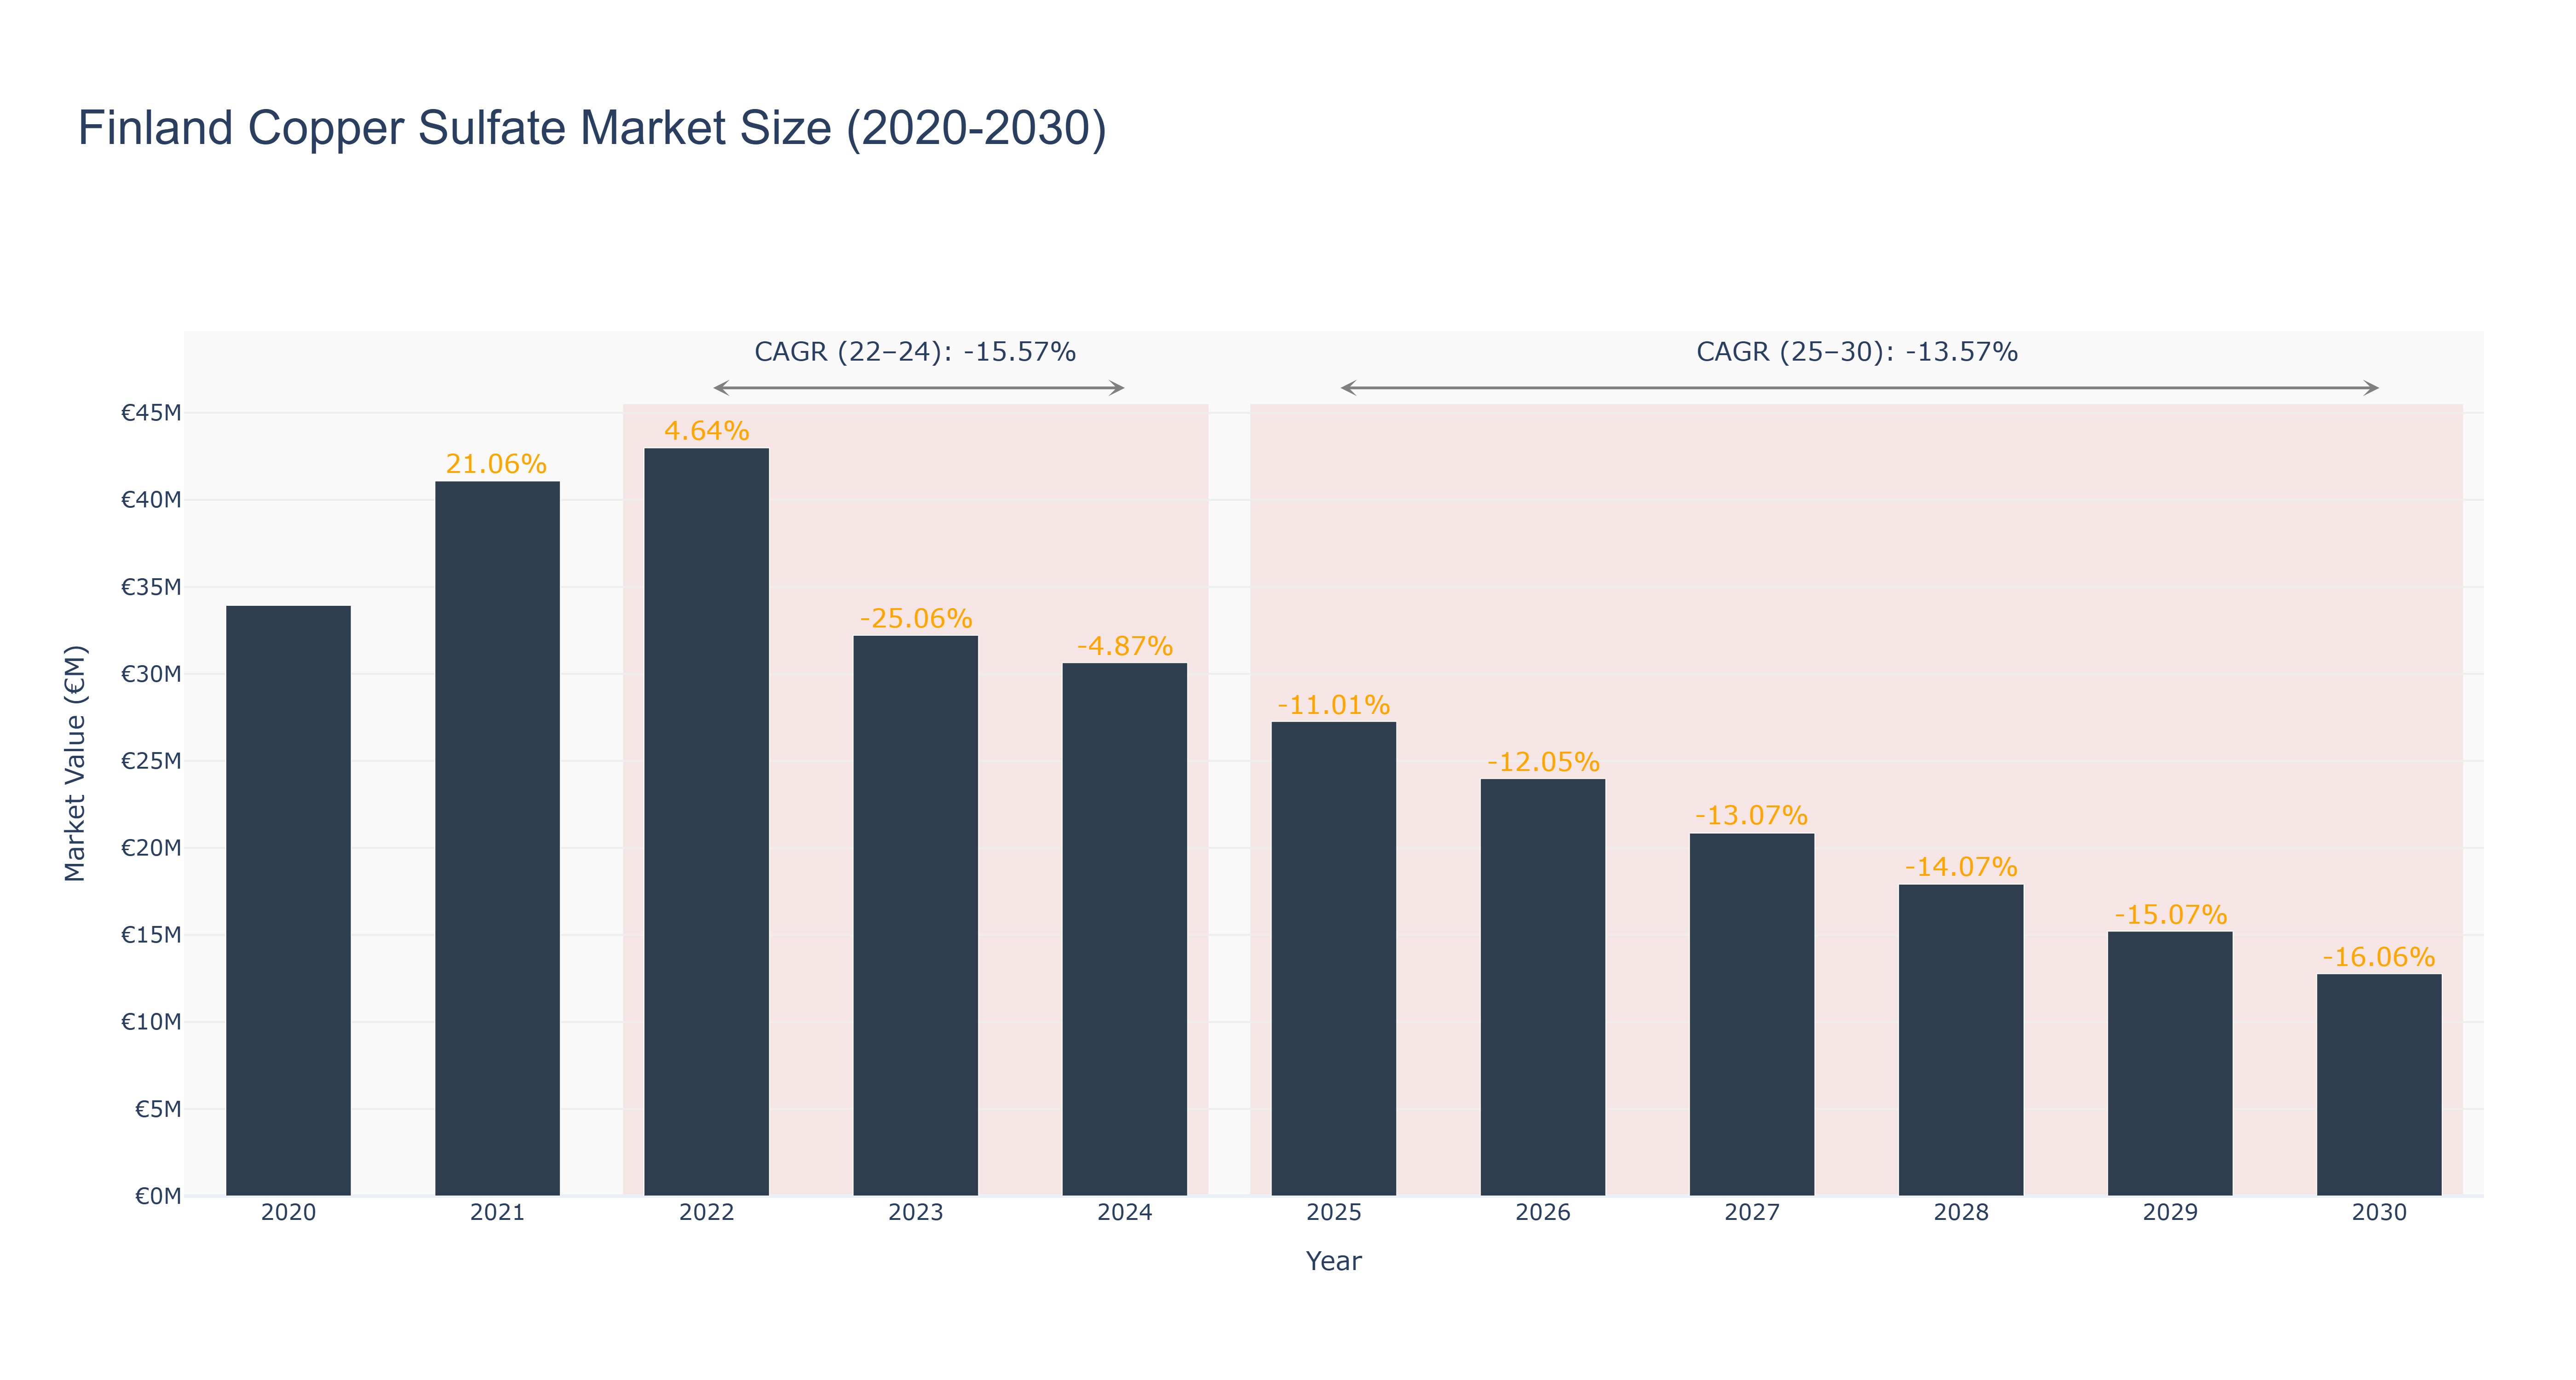
The Finland Copper Sulfate Market experienced a peak market size of €42.99 million in 2022, followed by a steady decline to €23.99 million in 2026. The market is forecasted to further decrease to €12.77 million by 2030, with a CAGR of -13.57% from 2025 to 2030. The significant downturn in market size can be attributed to various factors such as changing consumer preferences, economic conditions, and regulatory challenges. Industry drivers impacting the market include environmental concerns, technological advancements, and competitive landscape shifts. Looking ahead, upcoming projects in Finland's agriculture sector, focusing on sustainable practices and product innovation, are expected to drive growth in the Copper Sulfate Market. It is imperative for market players to adapt to these changes to stay competitive in the evolving landscape.
Finland Copper Sulfate Market: Production & Trade Performance (2019-2025)
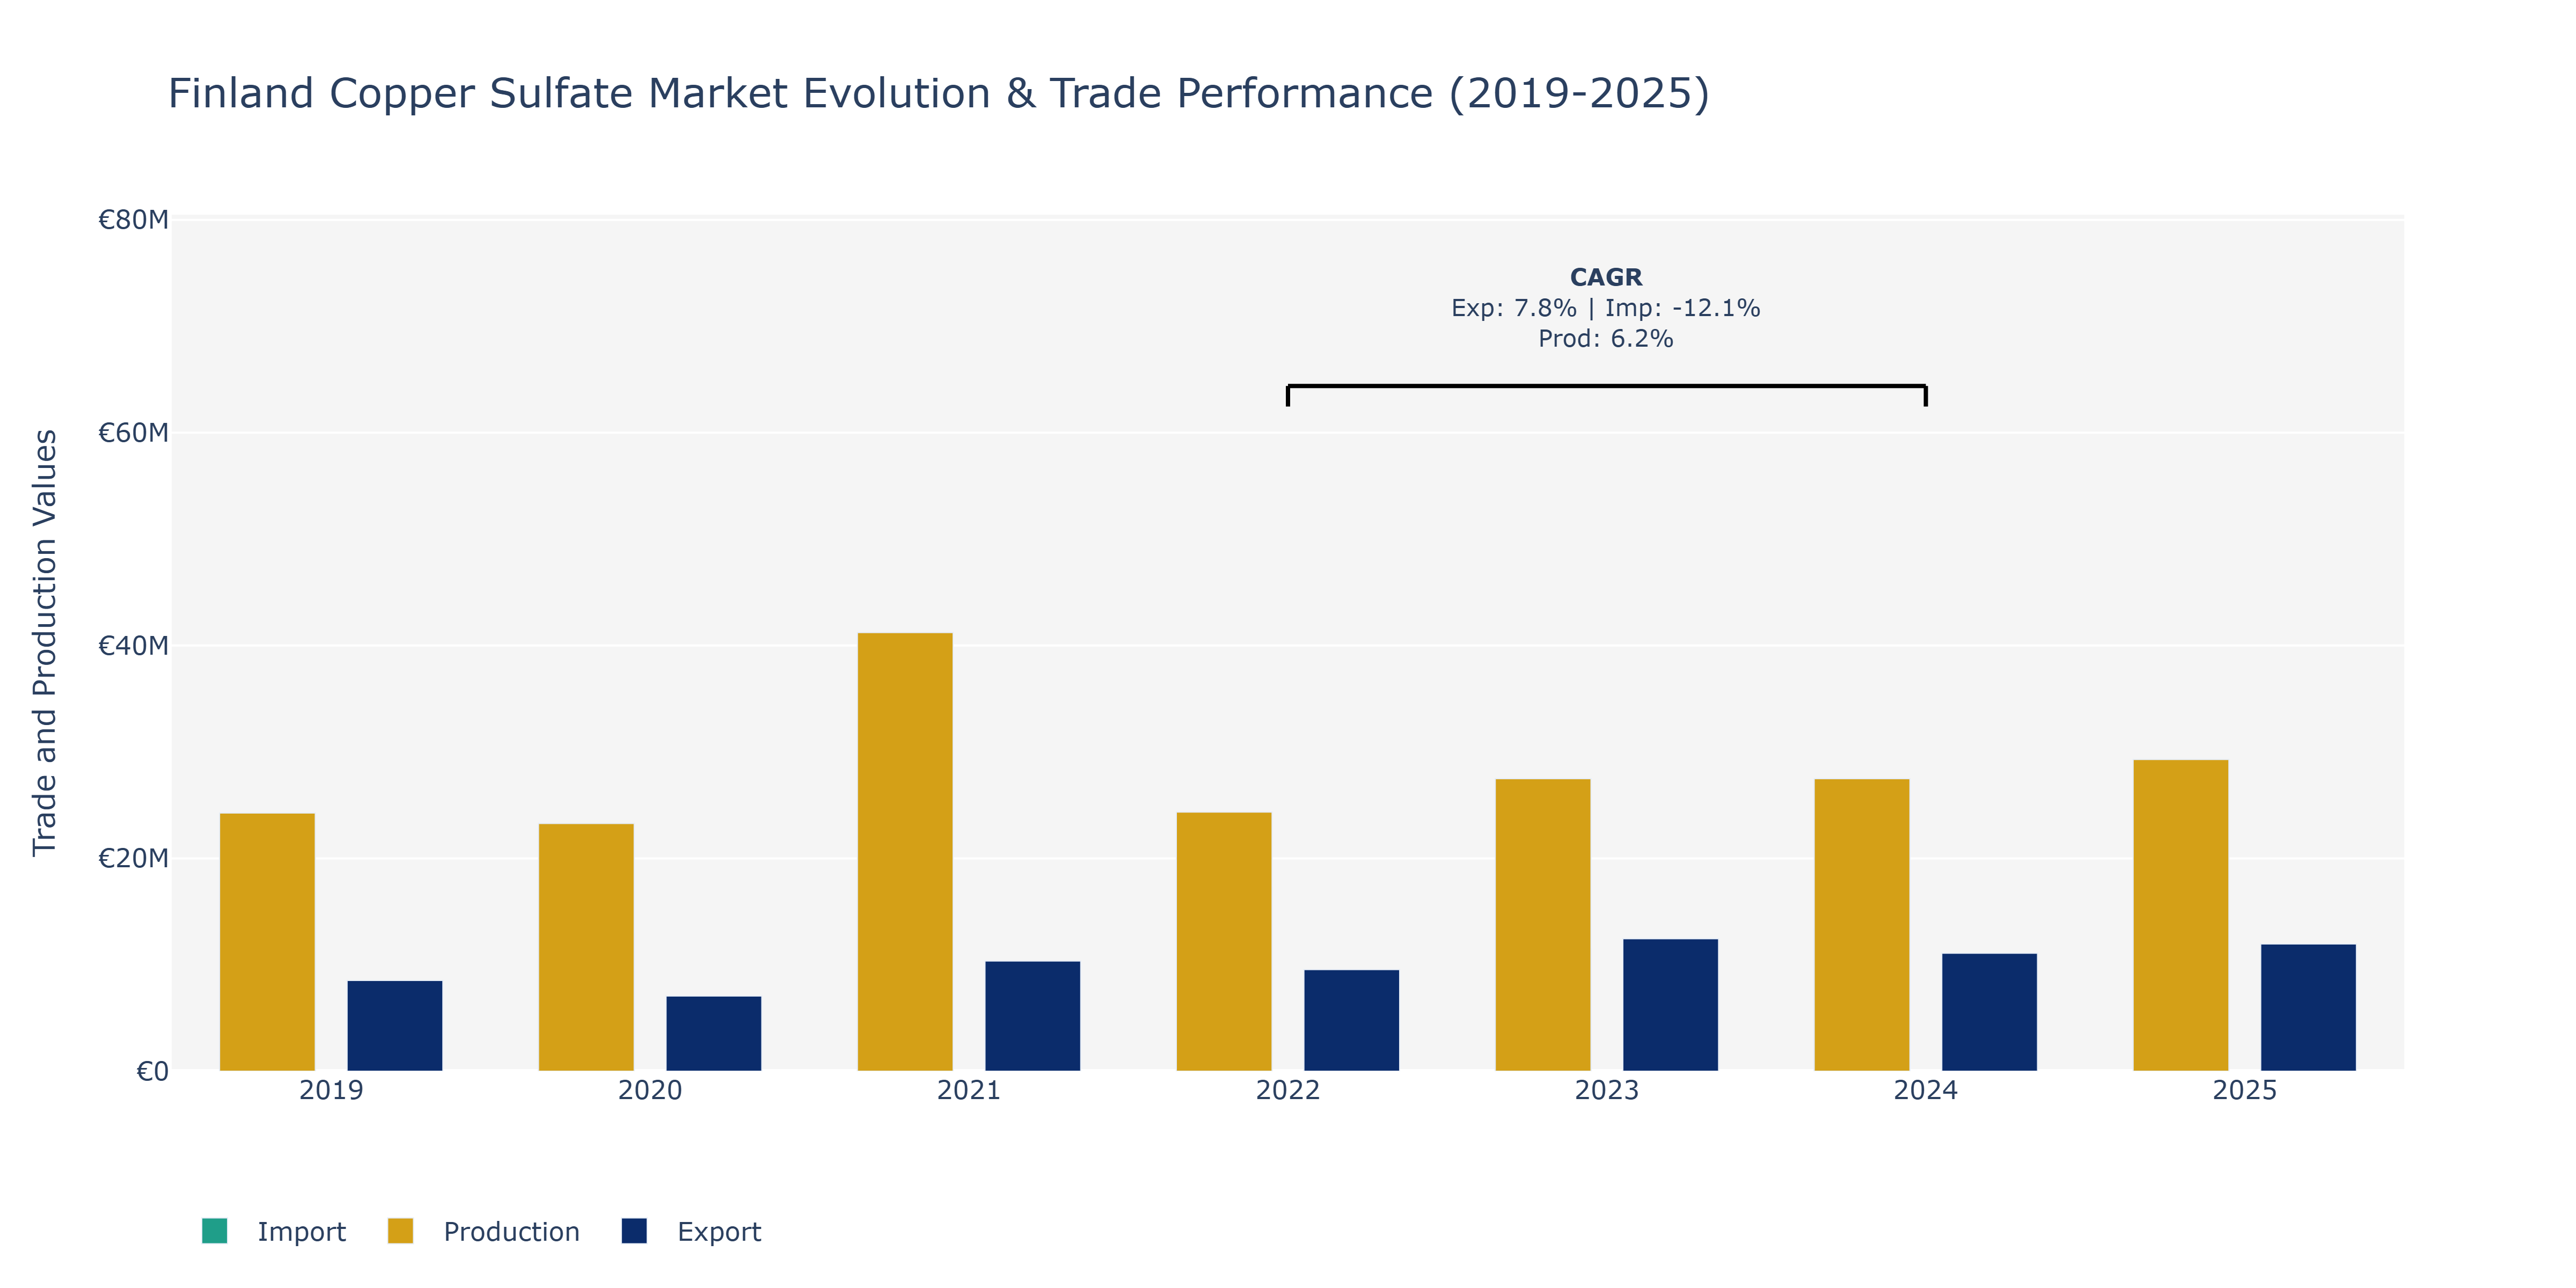
Between 2019 and 2025, the Finland Copper Sulfate market experienced varied dynamics in exports, imports, and production. Exports witnessed a notable fluctuation, starting at €8.52 million in 2019, declining to €7.06 million in 2020, and eventually reaching a peak of €12.44 million in 2023 before stabilizing around €11.95 million in 2025. Conversely, imports showed a steady pattern, decreasing from €16.98 million in 2019 to €11.5 million in 2023, and then slightly rebounding to €12.28 million in 2025. Production displayed growth, with a CAGR of 6.25% from 2022 to 2024, standing at €24.39 million in both 2022 and 2024, and increasing to around €29.28 million in 2025. The rise in production can be attributed to growing demand from industries like agriculture, mining, and pharmaceuticals, aligning with global trends of increased application of copper sulfate in various sectors. The fluctuations in exports could be linked to global market conditions, currency fluctuations, and trade agreements impacting demand for Finnish copper sulfate products. Import stabilization might stem from optimized supply chains and strategic sourcing decisions made by market players in response to changing global trade dynamics.
Key Highlights of the Report:
- Finland Copper Sulfate Market Outlook
- Market Size of Finland Copper Sulfate Market, 2025
- Forecast of Finland Copper Sulfate Market, 2032
- Historical Data and Forecast of Finland Copper Sulfate Revenues & Volume for the Period 2022 - 2032F
- Finland Copper Sulfate Market Trend Evolution
- Finland Copper Sulfate Market Drivers and Challenges
- Finland Copper Sulfate Price Trends
- Finland Copper Sulfate Porter's Five Forces
- Finland Copper Sulfate Industry Life Cycle
- Historical Data and Forecast of Finland Copper Sulfate Market Revenues & Volume By Form for the Period 2022 - 2032F
- Historical Data and Forecast of Finland Copper Sulfate Market Revenues & Volume By Powder for the Period 2022 - 2032F
- Historical Data and Forecast of Finland Copper Sulfate Market Revenues & Volume By Liquid for the Period 2022 - 2032F
- Historical Data and Forecast of Finland Copper Sulfate Market Revenues & Volume By Crystals for the Period 2022 - 2032F
- Historical Data and Forecast of Finland Copper Sulfate Market Revenues & Volume By Others for the Period 2022 - 2032F
- Historical Data and Forecast of Finland Copper Sulfate Market Revenues & Volume By Grade for the Period 2022 - 2032F
- Historical Data and Forecast of Finland Copper Sulfate Market Revenues & Volume By Technical Grade for the Period 2022 - 2032F
- Historical Data and Forecast of Finland Copper Sulfate Market Revenues & Volume By Industrial Grade for the Period 2022 - 2032F
- Historical Data and Forecast of Finland Copper Sulfate Market Revenues & Volume By Feed Grade for the Period 2022 - 2032F
- Historical Data and Forecast of Finland Copper Sulfate Market Revenues & Volume By Others for the Period 2022 - 2032F
- Historical Data and Forecast of Finland Copper Sulfate Market Revenues & Volume By Application for the Period 2022 - 2032F
- Historical Data and Forecast of Finland Copper Sulfate Market Revenues & Volume By Fungicide for the Period 2022 - 2032F
- Historical Data and Forecast of Finland Copper Sulfate Market Revenues & Volume By Electroplating for the Period 2022 - 2032F
- Historical Data and Forecast of Finland Copper Sulfate Market Revenues & Volume By Feed Additive for the Period 2022 - 2032F
- Historical Data and Forecast of Finland Copper Sulfate Market Revenues & Volume By Others for the Period 2022 - 2032F
- Historical Data and Forecast of Finland Copper Sulfate Market Revenues & Volume By End-Use for the Period 2022 - 2032F
- Historical Data and Forecast of Finland Copper Sulfate Market Revenues & Volume By Agriculture for the Period 2022 - 2032F
- Historical Data and Forecast of Finland Copper Sulfate Market Revenues & Volume By Electronics for the Period 2022 - 2032F
- Historical Data and Forecast of Finland Copper Sulfate Market Revenues & Volume By Animal Nutrition for the Period 2022 - 2032F
- Historical Data and Forecast of Finland Copper Sulfate Market Revenues & Volume By Others for the Period 2022 - 2032F
- Historical Data and Forecast of Finland Copper Sulfate Market Revenues & Volume By Distribution Channel for the Period 2022 - 2032F
- Historical Data and Forecast of Finland Copper Sulfate Market Revenues & Volume By Direct Sales for the Period 2022 - 2032F
- Historical Data and Forecast of Finland Copper Sulfate Market Revenues & Volume By Distributors for the Period 2022 - 2032F
- Historical Data and Forecast of Finland Copper Sulfate Market Revenues & Volume By Online Sales for the Period 2022 - 2032F
- Historical Data and Forecast of Finland Copper Sulfate Market Revenues & Volume By Others for the Period 2022 - 2032F
- Finland Copper Sulfate Import Export Trade Statistics
- Market Opportunity Assessment By Form
- Market Opportunity Assessment By Grade
- Market Opportunity Assessment By Application
- Market Opportunity Assessment By End-Use
- Market Opportunity Assessment By Distribution Channel
- Finland Copper Sulfate Top Companies Market Share
- Finland Copper Sulfate Competitive Benchmarking By Technical and Operational Parameters
- Finland Copper Sulfate Company Profiles
- Finland Copper Sulfate Key Strategic Recommendations
Frequently Asked Questions About the Market Study (FAQs):
6Wresearch actively monitors the Finland Copper Sulfate Market and publishes its comprehensive annual report, highlighting emerging trends, growth drivers, revenue analysis, and forecast outlook. Our insights help businesses to make data-backed strategic decisions with ongoing market dynamics. Our analysts track relevent industries related to the Finland Copper Sulfate Market, allowing our clients with actionable intelligence and reliable forecasts tailored to emerging regional needs.
Yes, we provide customisation as per your requirements. To learn more, feel free to contact us on sales@6wresearch.com
1 Executive Summary |
2 Introduction |
2.1 Key Highlights of the Report |
2.2 Report Description |
2.3 Market Scope & Segmentation |
2.4 Research Methodology |
2.5 Assumptions |
3 Finland Copper Sulfate Market Overview |
3.1 Finland Country Macro Economic Indicators |
3.2 Finland Copper Sulfate Market Revenues & Volume, 2022 & 2032F |
3.3 Finland Copper Sulfate Market - Industry Life Cycle |
3.4 Finland Copper Sulfate Market - Porter's Five Forces |
3.5 Finland Copper Sulfate Market Revenues & Volume Share, By Form, 2022 & 2032F |
3.6 Finland Copper Sulfate Market Revenues & Volume Share, By Grade, 2022 & 2032F |
3.7 Finland Copper Sulfate Market Revenues & Volume Share, By Application, 2022 & 2032F |
3.8 Finland Copper Sulfate Market Revenues & Volume Share, By End-Use, 2022 & 2032F |
3.9 Finland Copper Sulfate Market Revenues & Volume Share, By Distribution Channel, 2022 & 2032F |
4 Finland Copper Sulfate Market Dynamics |
4.1 Impact Analysis |
4.2 Market Drivers |
4.2.1 Increasing demand for copper sulfate in agriculture sector for crop protection and animal feed supplements |
4.2.2 Growing adoption of copper sulfate in water treatment applications for controlling algae and fungi |
4.2.3 Rise in research and development activities for developing new applications of copper sulfate |
4.3 Market Restraints |
4.3.1 Fluctuating prices of raw materials such as copper and sulfur affecting the production cost of copper sulfate |
4.3.2 Stringent environmental regulations regarding the disposal of copper sulfate waste |
4.3.3 Competition from alternative products like chelated copper compounds impacting market growth |
5 Finland Copper Sulfate Market Trends |
6 Finland Copper Sulfate Market, By Types |
6.1 Finland Copper Sulfate Market, By Form |
6.1.1 Overview and Analysis |
6.1.2 Finland Copper Sulfate Market Revenues & Volume, By Form, 2022 - 2032F |
6.1.3 Finland Copper Sulfate Market Revenues & Volume, By Powder, 2022 - 2032F |
6.1.4 Finland Copper Sulfate Market Revenues & Volume, By Liquid, 2022 - 2032F |
6.1.5 Finland Copper Sulfate Market Revenues & Volume, By Crystals, 2022 - 2032F |
6.1.6 Finland Copper Sulfate Market Revenues & Volume, By Others, 2022 - 2032F |
6.2 Finland Copper Sulfate Market, By Grade |
6.2.1 Overview and Analysis |
6.2.2 Finland Copper Sulfate Market Revenues & Volume, By Technical Grade, 2022 - 2032F |
6.2.3 Finland Copper Sulfate Market Revenues & Volume, By Industrial Grade, 2022 - 2032F |
6.2.4 Finland Copper Sulfate Market Revenues & Volume, By Feed Grade, 2022 - 2032F |
6.2.5 Finland Copper Sulfate Market Revenues & Volume, By Others, 2022 - 2032F |
6.3 Finland Copper Sulfate Market, By Application |
6.3.1 Overview and Analysis |
6.3.2 Finland Copper Sulfate Market Revenues & Volume, By Fungicide, 2022 - 2032F |
6.3.3 Finland Copper Sulfate Market Revenues & Volume, By Electroplating, 2022 - 2032F |
6.3.4 Finland Copper Sulfate Market Revenues & Volume, By Feed Additive, 2022 - 2032F |
6.3.5 Finland Copper Sulfate Market Revenues & Volume, By Others, 2022 - 2032F |
6.4 Finland Copper Sulfate Market, By End-Use |
6.4.1 Overview and Analysis |
6.4.2 Finland Copper Sulfate Market Revenues & Volume, By Agriculture, 2022 - 2032F |
6.4.3 Finland Copper Sulfate Market Revenues & Volume, By Electronics, 2022 - 2032F |
6.4.4 Finland Copper Sulfate Market Revenues & Volume, By Animal Nutrition, 2022 - 2032F |
6.4.5 Finland Copper Sulfate Market Revenues & Volume, By Others, 2022 - 2032F |
6.5 Finland Copper Sulfate Market, By Distribution Channel |
6.5.1 Overview and Analysis |
6.5.2 Finland Copper Sulfate Market Revenues & Volume, By Direct Sales, 2022 - 2032F |
6.5.3 Finland Copper Sulfate Market Revenues & Volume, By Distributors, 2022 - 2032F |
6.5.4 Finland Copper Sulfate Market Revenues & Volume, By Online Sales, 2022 - 2032F |
6.5.5 Finland Copper Sulfate Market Revenues & Volume, By Others, 2022 - 2032F |
7 Finland Copper Sulfate Market Import-Export Trade Statistics |
7.1 Finland Copper Sulfate Market Export to Major Countries |
7.2 Finland Copper Sulfate Market Imports from Major Countries |
8 Finland Copper Sulfate Market Key Performance Indicators |
8.1 Number of new product applications developed for copper sulfate |
8.2 Percentage increase in adoption of copper sulfate in agriculture and water treatment sectors |
8.3 Research and development investment in copper sulfate innovations |
9 Finland Copper Sulfate Market - Opportunity Assessment |
9.1 Finland Copper Sulfate Market Opportunity Assessment, By Form, 2022 & 2032F |
9.2 Finland Copper Sulfate Market Opportunity Assessment, By Grade, 2022 & 2032F |
9.3 Finland Copper Sulfate Market Opportunity Assessment, By Application, 2022 & 2032F |
9.4 Finland Copper Sulfate Market Opportunity Assessment, By End-Use, 2022 & 2032F |
9.5 Finland Copper Sulfate Market Opportunity Assessment, By Distribution Channel, 2022 & 2032F |
10 Finland Copper Sulfate Market - Competitive Landscape |
10.1 Finland Copper Sulfate Market Revenue Share, By Companies, 2025 |
10.2 Finland Copper Sulfate Market Competitive Benchmarking, By Operating and Technical Parameters |
11 Company Profiles |
12 Recommendations |
13 Disclaimer |
Export potential assessment - trade Analytics for 2030
Export potential enables firms to identify high-growth global markets with greater confidence by combining advanced trade intelligence with a structured quantitative methodology. The framework analyzes emerging demand trends and country-level import patterns while integrating macroeconomic and trade datasets such as GDP and population forecasts, bilateral import–export flows, tariff structures, elasticity differentials between developed and developing economies, geographic distance, and import demand projections. Using weighted trade values from 2020–2024 as the base period to project country-to-country export potential for 2030, these inputs are operationalized through calculated drivers such as gravity model parameters, tariff impact factors, and projected GDP per-capita growth. Through an analysis of hidden potentials, demand hotspots, and market conditions that are most favorable to success, this method enables firms to focus on target countries, maximize returns, and global expansion with data, backed by accuracy.
By factoring in the projected importer demand gap that is currently unmet and could be potential opportunity, it identifies the potential for the Exporter (Country) among 190 countries, against the general trade analysis, which identifies the biggest importer or exporter.
To discover high-growth global markets and optimize your business strategy:
Click Here
Pricing
- Single User License$ 1,995
- Department License$ 2,400
- Site License$ 3,120
- Global License$ 3,795

Search
Thought Leadership and Analyst Meet


Our Clients
Latest Reports
- Canada Cloud CFD Market (2026-2032) | Size & Revenue, Industry, Growth, Competitive Landscape, Forecast, Segmentation, Value, Outlook, Trends, Share, Analysis, Companies
- Taiwan Food Delivery Platform Market (2026-2032) | Companies, Outlook, Analysis, Trends, Value, Revenue, Segmentation, Share, Forecast, Competitive Landscape, Growth, Size & Forecast
- United Kingdom (UK) Long-term Care Insurance Market (2026-2032) | Growth, Share, Consumer Insights, Drivers, Opportunities, Competition, Pricing Analysis, Segments, Restraints, Companies, Competitive, Value, Outlook, Size, Demand, Analysis, Challenges, Strategic Insights, Investment Trends, Revenue, Trends, Supply, Forecast
- United Kingdom (UK) Long Term Care Market (2026-2032) | Companies, Outlook, Analysis, Trends, Value, Revenue, Segmentation, Share, Forecast, Competitive Landscape, Growth, Size & Forecast
- Iraq Insulation and Waterproofing Market (2026-2032) | Outlook, Drivers, Growth, Size, Share, Industry, Revenue, Trends, Demand, Competitive, Strategic Insights, Opportunities, Segments, Companies, Challenges, Strategy, Consumer Insights, Analysis, Investment Trends, Value, Segmentation, Forecast, Restraints
- India Switchgear Market Outlook (2026-2032) | Size, Share, Trends, Growth, Revenue, Forecast, Analysis, Value, Outlook
- Pakistan Contraceptive Implants Market (2025-2031) | Demand, Growth, Size, Share, Industry, Pricing Analysis, Competitive, Strategic Insights, Strategy, Consumer Insights, Analysis, Investment Trends, Opportunities, Revenue, Segments, Value, Segmentation, Supply, Forecast, Restraints, Outlook, Competition, Drivers, Trends, Companies, Challenges
- Sri Lanka Packaging Market (2026-2032) | Outlook, Competition, Drivers, Trends, Demand, Pricing Analysis, Competitive, Strategic Insights, Companies, Challenges, Strategy, Consumer Insights, Analysis, Investment Trends, Opportunities, Growth, Size, Share, Industry, Revenue, Segments, Value, Segmentation, Supply, Forecast, Restraints
- India Kids Watches Market (2026-2032) | Strategy, Consumer Insights, Analysis, Investment Trends, Opportunities, Growth, Size, Share, Industry, Revenue, Segments, Value, Segmentation, Supply, Forecast, Restraints, Outlook, Competition, Drivers, Trends, Demand, Pricing Analysis, Competitive, Strategic Insights, Companies, Challenges
- Saudi Arabia Core Assurance Service Market (2025-2031) | Strategy, Consumer Insights, Analysis, Investment Trends, Opportunities, Growth, Size, Share, Industry, Revenue, Segments, Value, Segmentation, Supply, Forecast, Restraints, Outlook, Competition, Drivers, Trends, Demand, Pricing Analysis, Competitive, Strategic Insights, Companies, Challenges
Industry Events and Analyst Meet

India EV Show 2026

EV tech India Expo 2026

Auto Tech Asia 2026

Battery Tech India 2026

Smart Production Solutions Guangzhou 2026
Whitepaper
- Middle East & Africa Commercial Security Market Click here to view more.
- Middle East & Africa Fire Safety Systems & Equipment Market Click here to view more.
- GCC Drone Market Click here to view more.
- Middle East Lighting Fixture Market Click here to view more.
- GCC Physical & Perimeter Security Market Click here to view more.
6WResearch In News
- Doha a strategic location for EV manufacturing hub: IPA Qatar
- Demand for luxury TVs surging in the GCC, says Samsung
- Empowering Growth: The Thriving Journey of Bangladesh’s Cable Industry
- Demand for luxury TVs surging in the GCC, says Samsung
- Video call with a traditional healer? Once unthinkable, it’s now common in South Africa
- Intelligent Buildings To Smooth GCC’s Path To Net Zero