Finland Gaming Console Market (2025-2031) | Forecast, Industry, Outlook, Segmentation, Value, Analysis, Trends, Growth, Companies, Revenue, Size & Share
Market Forecast By Component (Hardware, Software), By Type (Home Consoles, Handheld Consoles, Hybrid Consoles, Dedicated Consoles, Others), By End-use (Personal, Commercial, Others) And Competitive Landscape
| Product Code: ETC4805325 | Publication Date: Nov 2023 | Updated Date: Apr 2026 | Product Type: Market Research Report | |
| Publisher: 6Wresearch | Author: Shubham Padhi | No. of Pages: 60 | No. of Figures: 30 | No. of Tables: 5 |
Finland Gaming Console Market Size (2020-2030)
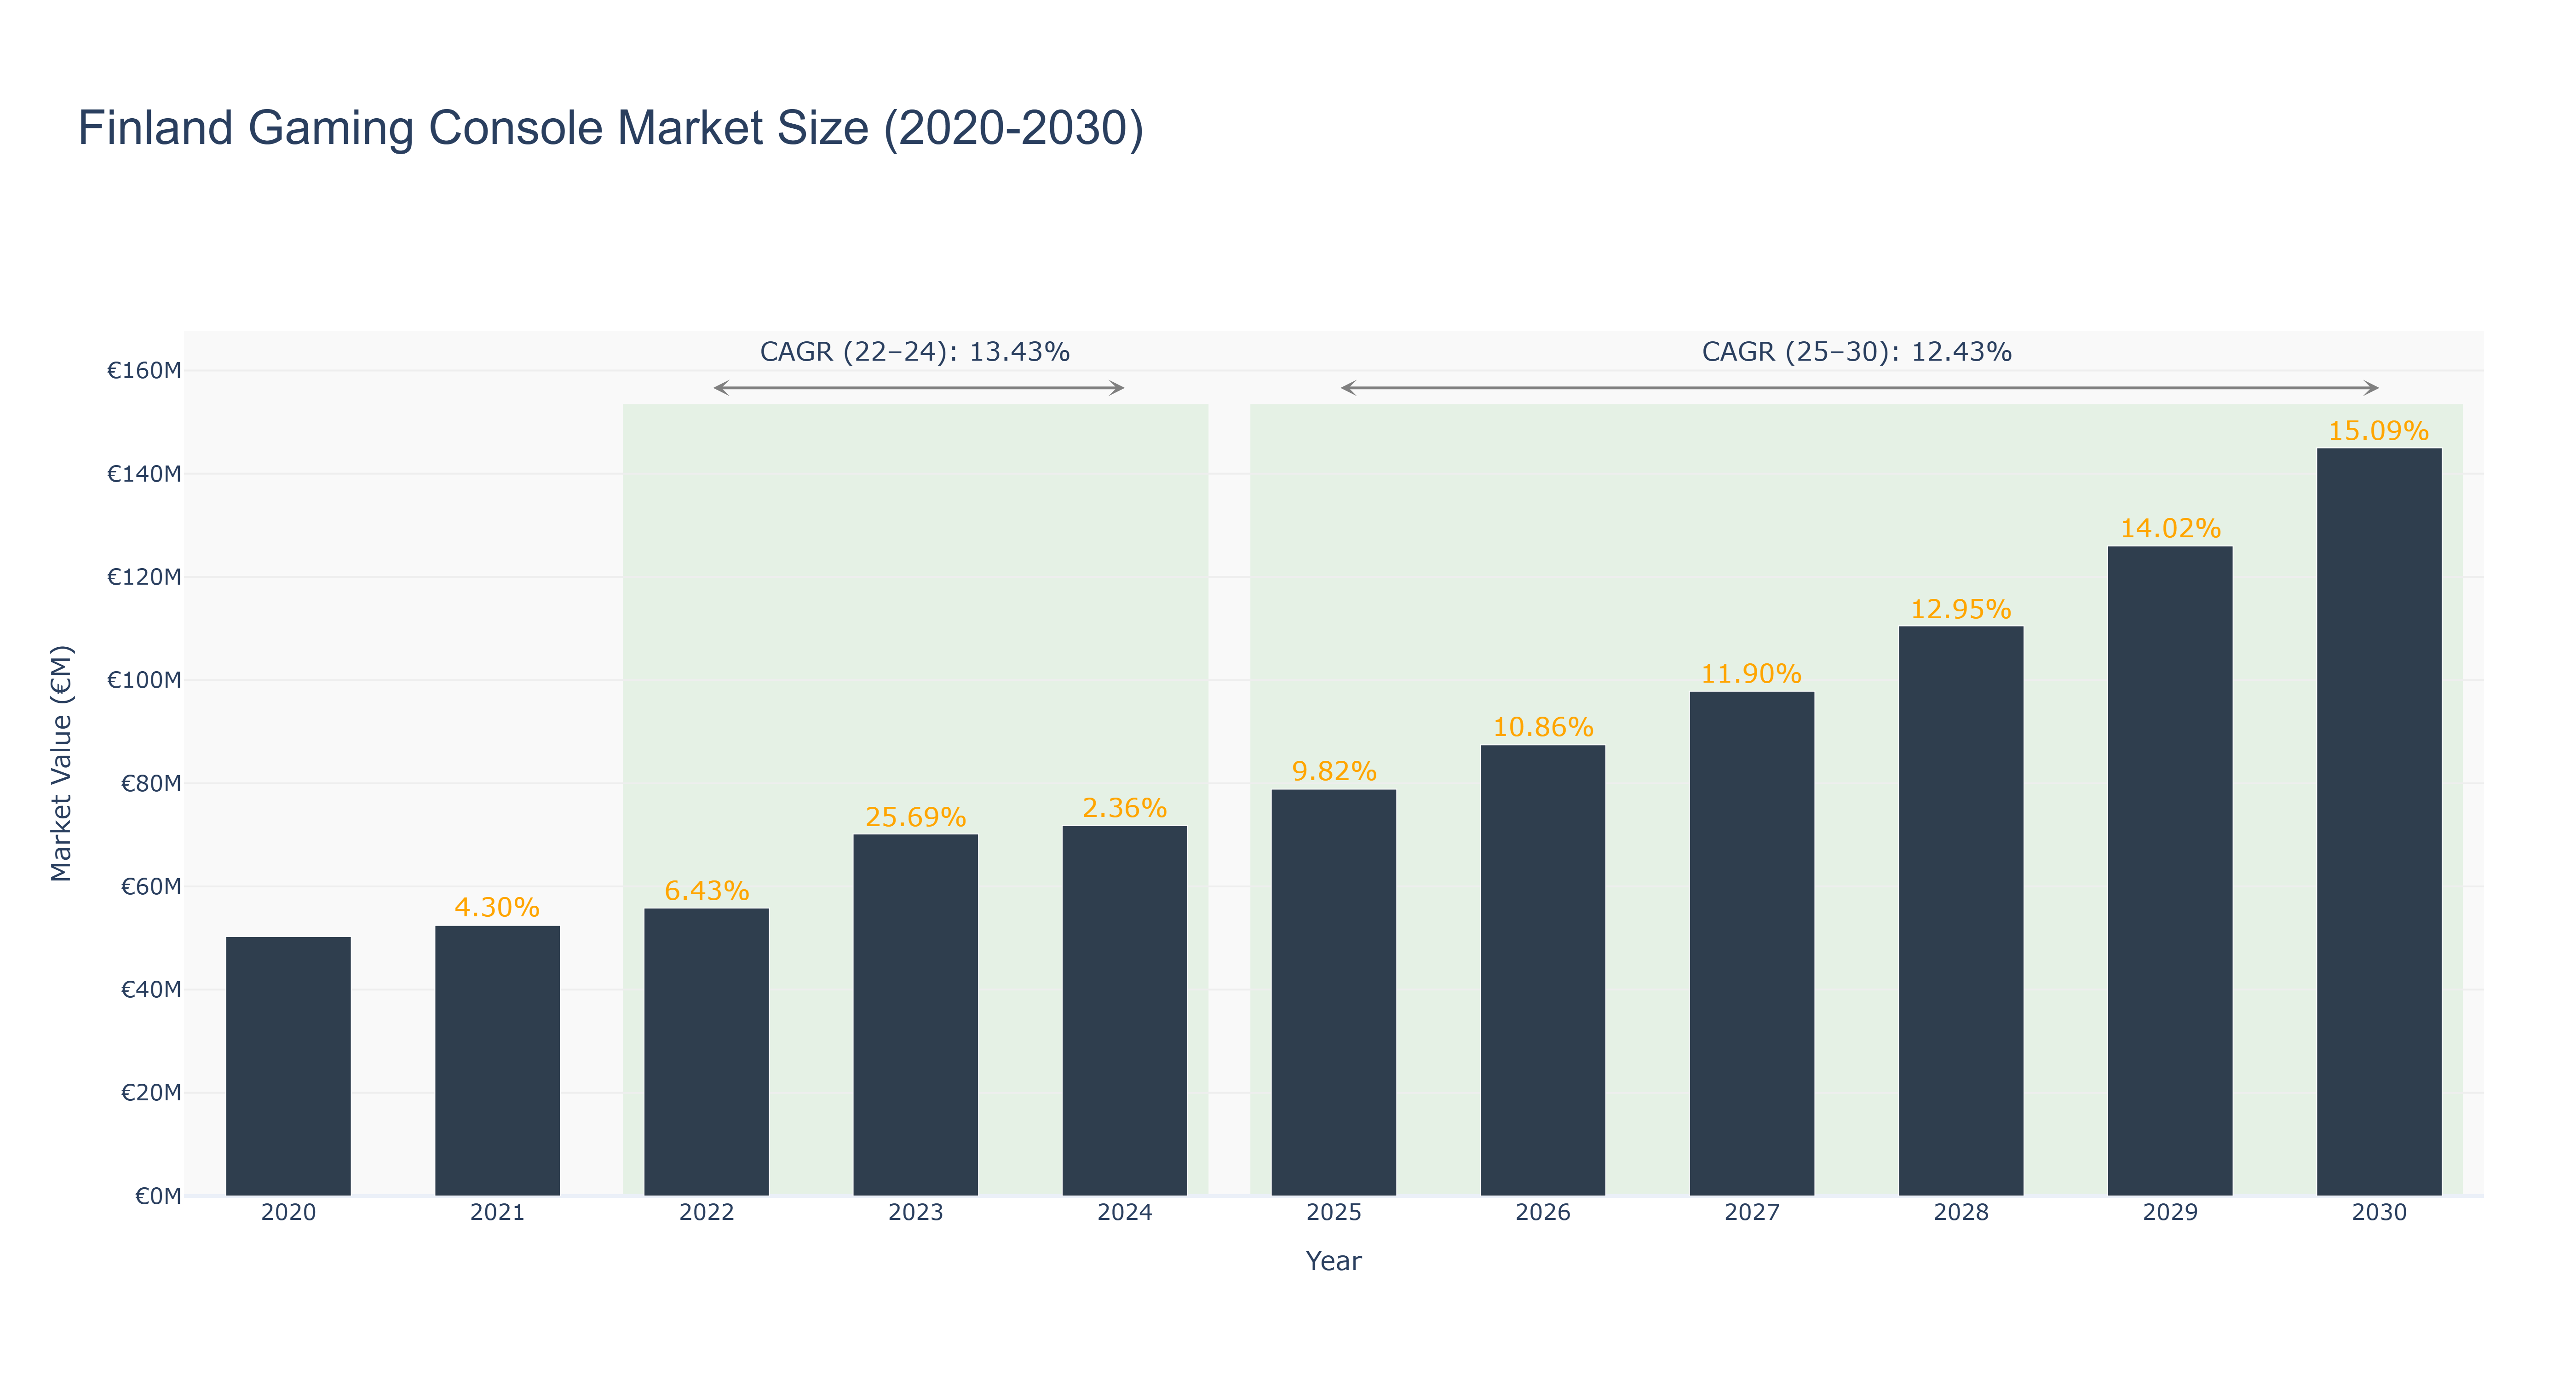
The Finland Gaming Console Market has shown a promising growth trajectory. The market experienced steady growth from €50.28 million in 2020 to €71.82 million in 2024, driven by the increasing demand for gaming consoles and related accessories. The peak market size was €145.02 million in 2030, reflecting a robust expansion over the forecasted period. The CAGR for the market from 2022 to 2024 was 13.43%, while for the period 2025 to 2030, it is projected at 12.43%. The market's growth can be attributed to technological advancements in gaming consoles, a growing gaming community, and the rise of esports in Finland. Looking ahead, recent developments indicate collaborations between local game developers and international gaming companies to launch innovative gaming products tailored to the Finnish market, fostering further market growth.
Finland Gaming Console Market: Production & Trade Performance (2019-2025)
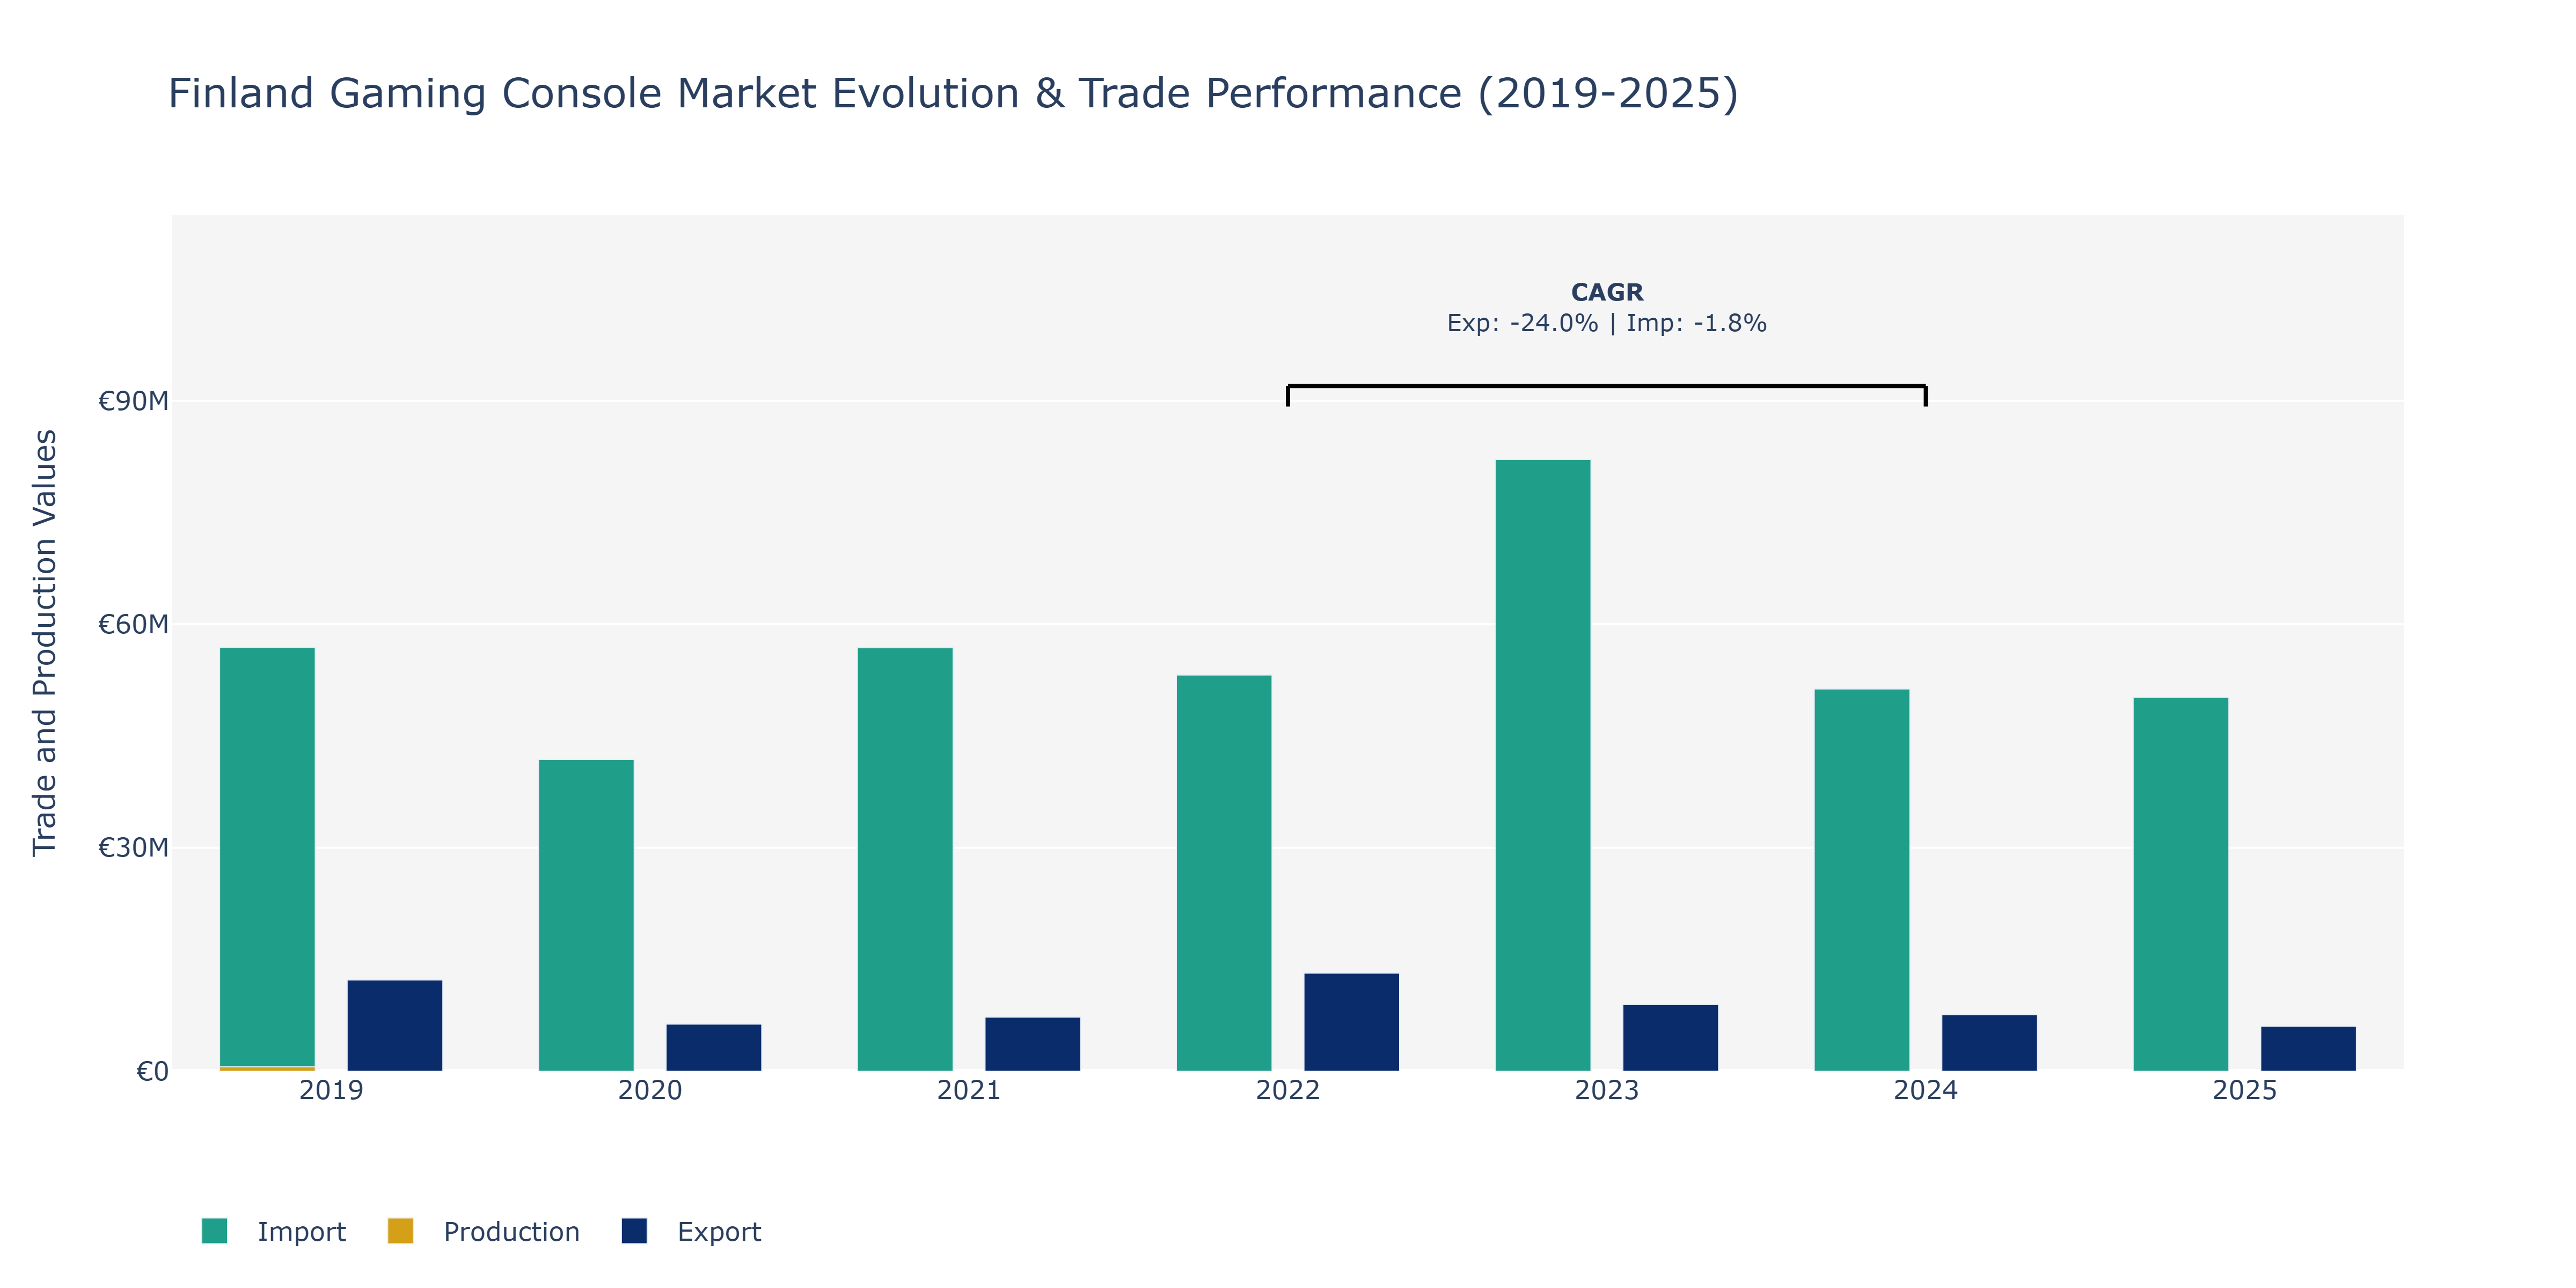
In the Finland Gaming Console Market, exports experienced a notable fluctuation over the years, peaking at €13.16 million in 2022 and declining to €6.04 million in 2025. This decline can be attributed to shifts in consumer preferences, competition from other markets, and potentially supply chain disruptions impacting outbound shipments. Imports, on the other hand, remained relatively stable, with a peak of €82.15 million in 2023 and a slight decrease to €50.18 million in 2025. This indicates a consistent demand for gaming consoles in Finland, supported by factors such as the popularity of gaming culture and the release of new console models. Production value were consistently lower compared to exports and imports, standing at €586.75 million in 2019. The fluctuations and trends observed in exports and imports reflect the dynamic nature of the gaming console market, influenced by evolving technologies and shifting consumer preferences.
Key Highlights of the Report:
- Finland Gaming Console Market Outlook
- Market Size of Finland Gaming Console Market, 2024
- Forecast of Finland Gaming Console Market, 2031
- Historical Data and Forecast of Finland Gaming Console Revenues & Volume for the Period 2021-2031
- Finland Gaming Console Market Trend Evolution
- Finland Gaming Console Market Drivers and Challenges
- Finland Gaming Console Price Trends
- Finland Gaming Console Porter`s Five Forces
- Finland Gaming Console Industry Life Cycle
- Historical Data and Forecast of Finland Gaming Console Market Revenues & Volume By Component for the Period 2021-2031
- Historical Data and Forecast of Finland Gaming Console Market Revenues & Volume By Hardware for the Period 2021-2031
- Historical Data and Forecast of Finland Gaming Console Market Revenues & Volume By Software for the Period 2021-2031
- Historical Data and Forecast of Finland Gaming Console Market Revenues & Volume By Type for the Period 2021-2031
- Historical Data and Forecast of Finland Gaming Console Market Revenues & Volume By Home Consoles for the Period 2021-2031
- Historical Data and Forecast of Finland Gaming Console Market Revenues & Volume By Handheld Consoles for the Period 2021-2031
- Historical Data and Forecast of Finland Gaming Console Market Revenues & Volume By Hybrid Consoles for the Period 2021-2031
- Historical Data and Forecast of Finland Gaming Console Market Revenues & Volume By Dedicated Consoles for the Period 2021-2031
- Historical Data and Forecast of Finland Gaming Console Market Revenues & Volume By Others for the Period 2021-2031
- Historical Data and Forecast of Finland Gaming Console Market Revenues & Volume By End-use for the Period 2021-2031
- Historical Data and Forecast of Finland Gaming Console Market Revenues & Volume By Personal for the Period 2021-2031
- Historical Data and Forecast of Finland Gaming Console Market Revenues & Volume By Commercial for the Period 2021-2031
- Historical Data and Forecast of Finland Gaming Console Market Revenues & Volume By Others for the Period 2021-2031
- Finland Gaming Console Import Export Trade Statistics
- Market Opportunity Assessment By Component
- Market Opportunity Assessment By Type
- Market Opportunity Assessment By End-use
- Finland Gaming Console Top Companies Market Share
- Finland Gaming Console Competitive Benchmarking By Technical and Operational Parameters
- Finland Gaming Console Company Profiles
- Finland Gaming Console Key Strategic Recommendations
Frequently Asked Questions About the Market Study (FAQs):
6Wresearch actively monitors the Finland Gaming Console Market and publishes its comprehensive annual report, highlighting emerging trends, growth drivers, revenue analysis, and forecast outlook. Our insights help businesses to make data-backed strategic decisions with ongoing market dynamics. Our analysts track relevent industries related to the Finland Gaming Console Market, allowing our clients with actionable intelligence and reliable forecasts tailored to emerging regional needs.
Yes, we provide customisation as per your requirements. To learn more, feel free to contact us on sales@6wresearch.com
1 Executive Summary |
2 Introduction |
2.1 Key Highlights of the Report |
2.2 Report Description |
2.3 Market Scope & Segmentation |
2.4 Research Methodology |
2.5 Assumptions |
3 Finland Gaming Console Market Overview |
3.1 Finland Country Macro Economic Indicators |
3.2 Finland Gaming Console Market Revenues & Volume, 2021 & 2031F |
3.3 Finland Gaming Console Market - Industry Life Cycle |
3.4 Finland Gaming Console Market - Porter's Five Forces |
3.5 Finland Gaming Console Market Revenues & Volume Share, By Component, 2021 & 2031F |
3.6 Finland Gaming Console Market Revenues & Volume Share, By Type, 2021 & 2031F |
3.7 Finland Gaming Console Market Revenues & Volume Share, By End-use, 2021 & 2031F |
4 Finland Gaming Console Market Dynamics |
4.1 Impact Analysis |
4.2 Market Drivers |
4.2.1 Increasing disposable income in Finland leading to higher spending on entertainment products like gaming consoles. |
4.2.2 Growing popularity of e-sports and online gaming in Finland driving demand for gaming consoles. |
4.2.3 Technological advancements in gaming consoles leading to higher adoption rates among consumers in Finland. |
4.3 Market Restraints |
4.3.1 High cost of gaming consoles and related accessories limiting the purchasing power of some consumers in Finland. |
4.3.2 Availability of alternative gaming platforms such as PCs and mobile devices competing with gaming consoles in the Finnish market. |
5 Finland Gaming Console Market Trends |
6 Finland Gaming Console Market Segmentations |
6.1 Finland Gaming Console Market, By Component |
6.1.1 Overview and Analysis |
6.1.2 Finland Gaming Console Market Revenues & Volume, By Hardware, 2021-2031F |
6.1.3 Finland Gaming Console Market Revenues & Volume, By Software, 2021-2031F |
6.2 Finland Gaming Console Market, By Type |
6.2.1 Overview and Analysis |
6.2.2 Finland Gaming Console Market Revenues & Volume, By Home Consoles, 2021-2031F |
6.2.3 Finland Gaming Console Market Revenues & Volume, By Handheld Consoles, 2021-2031F |
6.2.4 Finland Gaming Console Market Revenues & Volume, By Hybrid Consoles, 2021-2031F |
6.2.5 Finland Gaming Console Market Revenues & Volume, By Dedicated Consoles, 2021-2031F |
6.2.6 Finland Gaming Console Market Revenues & Volume, By Others, 2021-2031F |
6.3 Finland Gaming Console Market, By End-use |
6.3.1 Overview and Analysis |
6.3.2 Finland Gaming Console Market Revenues & Volume, By Personal, 2021-2031F |
6.3.3 Finland Gaming Console Market Revenues & Volume, By Commercial, 2021-2031F |
6.3.4 Finland Gaming Console Market Revenues & Volume, By Others, 2021-2031F |
7 Finland Gaming Console Market Import-Export Trade Statistics |
7.1 Finland Gaming Console Market Export to Major Countries |
7.2 Finland Gaming Console Market Imports from Major Countries |
8 Finland Gaming Console Market Key Performance Indicators |
8.1 Average time spent on gaming per capita in Finland. |
8.2 Number of gaming events and tournaments held in Finland. |
8.3 Percentage of households with at least one gaming console. |
9 Finland Gaming Console Market - Opportunity Assessment |
9.1 Finland Gaming Console Market Opportunity Assessment, By Component, 2021 & 2031F |
9.2 Finland Gaming Console Market Opportunity Assessment, By Type, 2021 & 2031F |
9.3 Finland Gaming Console Market Opportunity Assessment, By End-use, 2021 & 2031F |
10 Finland Gaming Console Market - Competitive Landscape |
10.1 Finland Gaming Console Market Revenue Share, By Companies, 2024 |
10.2 Finland Gaming Console Market Competitive Benchmarking, By Operating and Technical Parameters |
11 Company Profiles |
12 Recommendations | 13 Disclaimer |
Global Go To Market Strategy - 2030
Export potential enables firms to identify high-growth global markets with greater confidence by combining advanced trade intelligence with a structured quantitative methodology. The framework analyzes emerging demand trends and country-level import patterns while integrating macroeconomic and trade datasets such as GDP and population forecasts, bilateral import–export flows, tariff structures, elasticity differentials between developed and developing economies, geographic distance, and import demand projections. Using weighted trade values from 2020–2024 as the base period to project country-to-country export potential for 2030, these inputs are operationalized through calculated drivers such as gravity model parameters, tariff impact factors, and projected GDP per-capita growth. Through an analysis of hidden potentials, demand hotspots, and market conditions that are most favorable to success, this method enables firms to focus on target countries, maximize returns, and global expansion with data, backed by accuracy.
By factoring in the projected importer demand gap that is currently unmet and could be potential opportunity, it identifies the potential for the Exporter (Country) among 190 countries, against the general trade analysis, which identifies the biggest importer or exporter.
To discover high-growth global markets and optimize your business strategy:
Click Here
Pricing
- Single User License$ 1,995
- Department License$ 2,400
- Site License$ 3,120
- Global License$ 3,795

Leadership Perspectives from Industry Events
Search
Thought Leadership and Analyst Meet


Our Clients
6WResearch In News
- India Air Conditioner Market Set for Strong Rebound in 2026 After Weather-Led Correction and GST-Driven Recovery: 6Wresearch
- ADAS in India: How Automatic Emergency Braking, Blind Spot Detection & Driver Monitoring are Transforming Road Safety
- Doha a strategic location for EV manufacturing hub: IPA Qatar
- Demand for luxury TVs surging in the GCC, says Samsung
- Empowering Growth: The Thriving Journey of Bangladesh’s Cable Industry
- Demand for luxury TVs surging in the GCC, says Samsung
Latest Reports
- Poland Fire Protection Systems Market (2026-2032)
- Cape Verde Portable Hand-Thrown Extinguisher Market (2026-2032)
- Canada Portable Hand-Thrown Extinguisher Market (2026-2032)
- Cameroon Portable Hand-Thrown Extinguisher Market (2026-2032)
- Burundi Portable Hand-Thrown Extinguisher Market (2026-2032)
- Burkina Faso Portable Hand-Thrown Extinguisher Market (2026-2032)
- Bulgaria Portable Hand-Thrown Extinguisher Market (2026-2032)
- Brunei Portable Hand-Thrown Extinguisher Market (2026-2032)
- Botswana Portable Hand-Thrown Extinguisher Market (2026-2032)
- Bosnia and Herzegovina Portable Hand-Thrown Extinguisher Market (2026-2032)
Industry Events and Analyst Meet

HIMTEX 2026

India Refining Summit 2026

India EV Show 2026

EV tech India Expo 2026

Auto Tech Asia 2026
Whitepaper
- Middle East & Africa Commercial Security Market Click here to view more.
- Middle East & Africa Fire Safety Systems & Equipment Market Click here to view more.
- GCC Drone Market Click here to view more.
- Middle East Lighting Fixture Market Click here to view more.
- GCC Physical & Perimeter Security Market Click here to view more.