Finland Infant Formula Market (2026-2032) | Size & Revenue, Competitive Landscape, Companies, Share, Value, Analysis, Outlook, Segmentation, Forecast, Growth, Industry, Trends
Market Forecast By Type (Infant Milk, Follow on Milk, Specialty Baby Milk, Growing-up Milk), By Ingredient (Carbohydrate, Fat, Protein, Minerals, Vitamins, Others), By Distribution Channel (Online, Offline) And Competitive Landscape
| Product Code: ETC7199518 | Publication Date: Sep 2024 | Updated Date: Apr 2026 | Product Type: Market Research Report | |
| Publisher: 6Wresearch | Author: Summon Dutta | No. of Pages: 75 | No. of Figures: 35 | No. of Tables: 20 |
Finland Infant Formula Market Size (2020-2030)
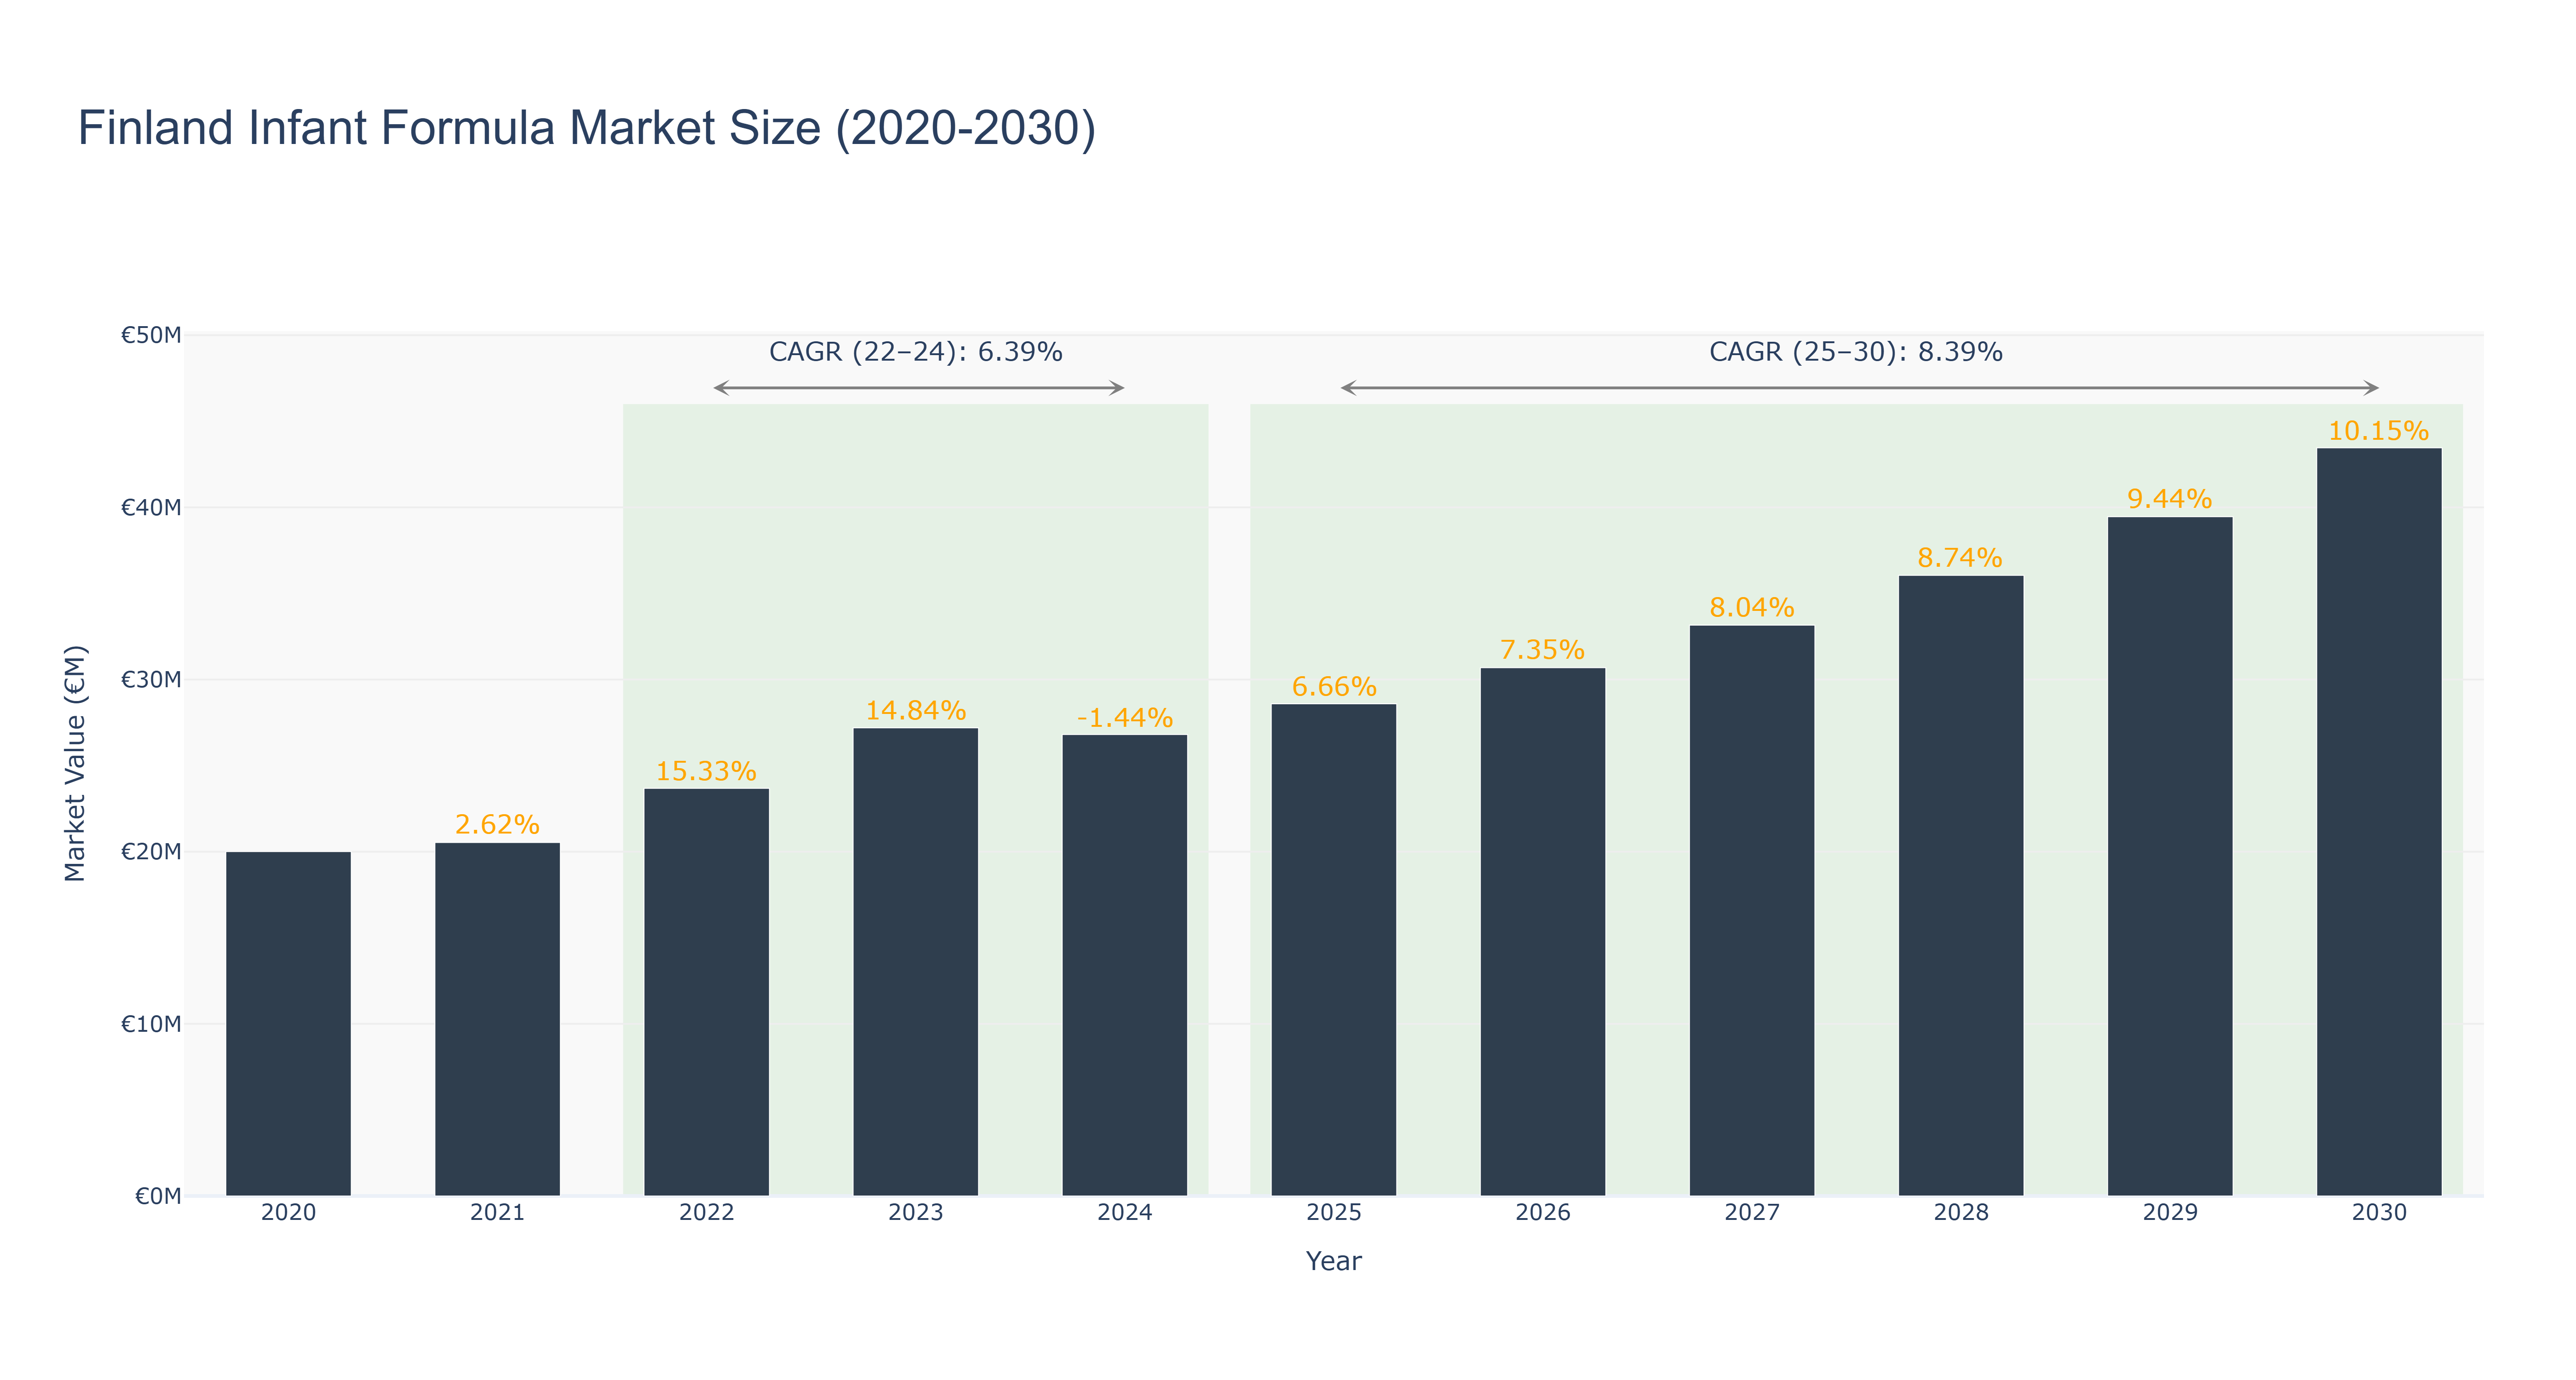
The Finland Infant Formula Market has experienced notable fluctuations between 2020 and 2024, peaking at €27.20 million in 2023, following a substantial growth of 14.84%. The actual market size rose from €20.01 million in 2020, with a CAGR of 6.39% expected through 2024, reflecting increased consumer demand for high-quality infant nutrition and an expanding population. However, a slight decline to €26.80 million is projected for 2024, attributed to market saturation and shifts in consumer preferences. Looking ahead, the forecasted period from 2025 to 2030 indicates a more robust growth trajectory, with a CAGR of 8.39%, culminating in a market size of €43.46 million by 2030. This growth is driven by rising health awareness among parents and innovations in product formulation. As the market evolves, companies may focus on sustainable practices and organic options to capture the increasingly discerning consumer base.
Finland Infant Formula Market: Production & Trade Performance (2019-2025)
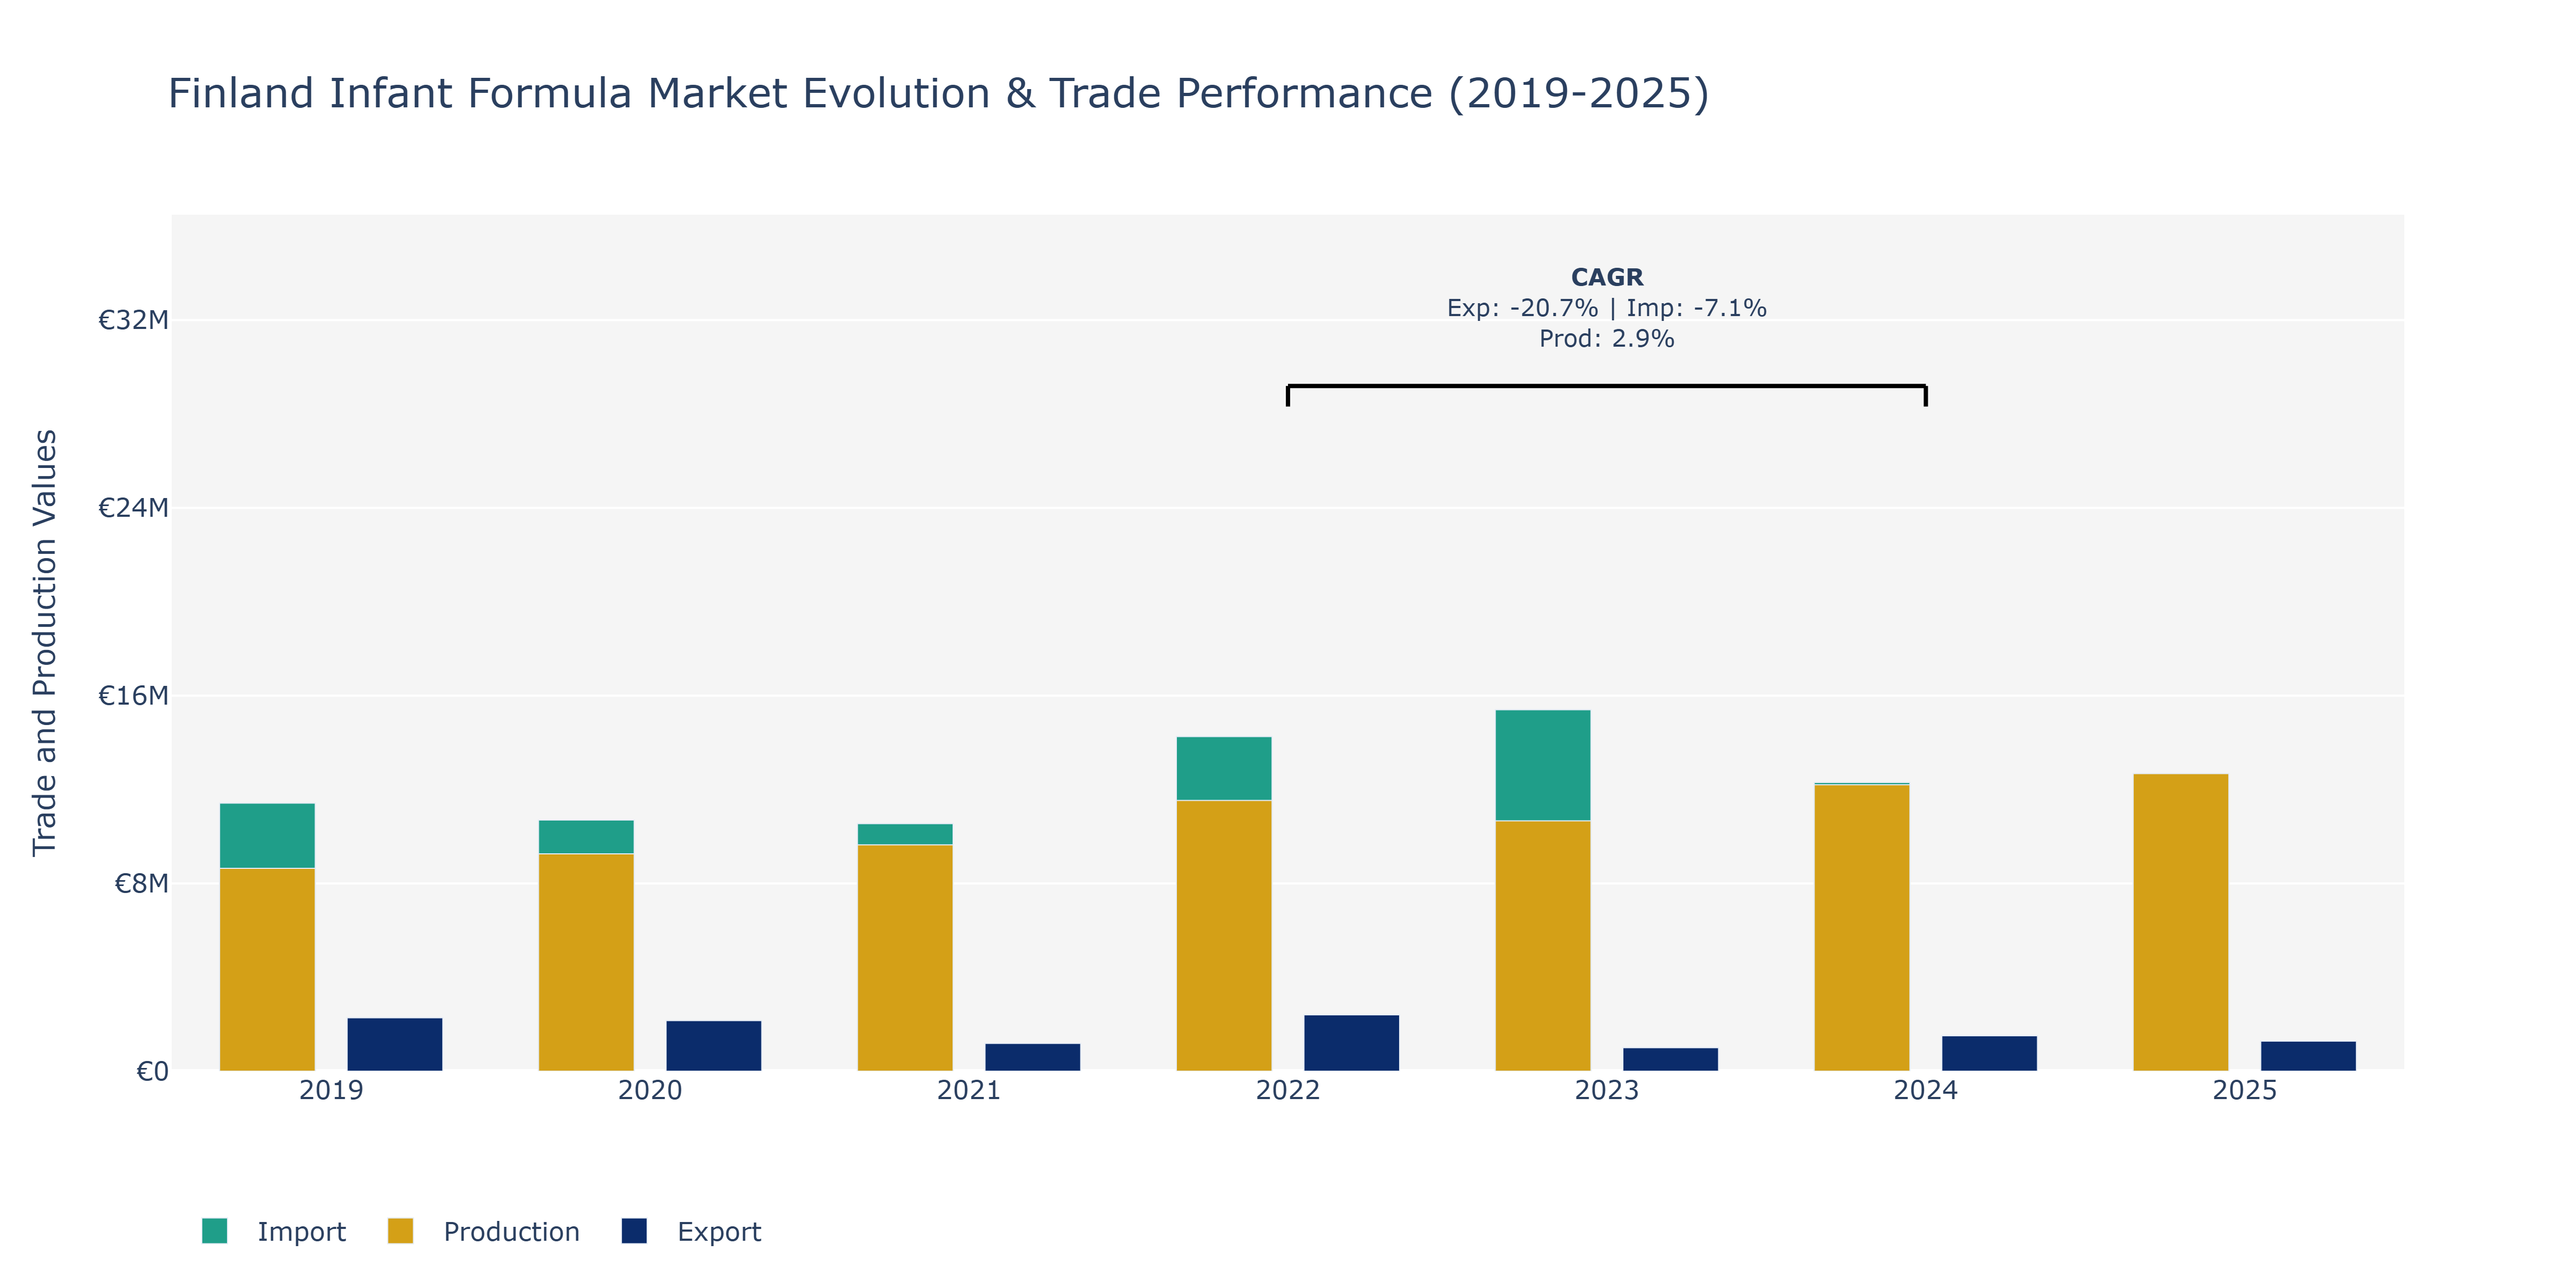
In the Finland Infant Formula Market, exports experienced fluctuations over the analyzed period. Starting at €2.28 million in 2019, exports declined to €1.18 million in 2021 before rebounding to €2.4 million in 2022, only to decrease significantly to €998.05 thousand in 2023 and then recover to €1.51 million in 2024. Imports, on the other hand, showed a more stable trend, with a slight decline from €11.42 million in 2019 to €10.55 million in 2021, before increasing to €14.26 million in 2022, then gradually declining to €11.8 million in 2025. Production saw consistent growth from €8.65 million in 2019 to €12.21 million in 2024. The fluctuations in exports could be attributed to changing consumer preferences, global economic conditions affecting demand, and regulatory changes impacting trade dynamics. The steady production growth may reflect increased domestic consumption or strategic investments by manufacturers in expanding their production capacities to meet rising demand.
Key Highlights of the Report:
- Finland Infant Formula Market Outlook
- Market Size of Finland Infant Formula Market, 2025
- Forecast of Finland Infant Formula Market, 2032
- Historical Data and Forecast of Finland Infant Formula Revenues & Volume for the Period 2022 - 2032
- Finland Infant Formula Market Trend Evolution
- Finland Infant Formula Market Drivers and Challenges
- Finland Infant Formula Price Trends
- Finland Infant Formula Porter's Five Forces
- Finland Infant Formula Industry Life Cycle
- Historical Data and Forecast of Finland Infant Formula Market Revenues & Volume By Type for the Period 2022 - 2032
- Historical Data and Forecast of Finland Infant Formula Market Revenues & Volume By Infant Milk for the Period 2022 - 2032
- Historical Data and Forecast of Finland Infant Formula Market Revenues & Volume By Follow on Milk for the Period 2022 - 2032
- Historical Data and Forecast of Finland Infant Formula Market Revenues & Volume By Specialty Baby Milk for the Period 2022 - 2032
- Historical Data and Forecast of Finland Infant Formula Market Revenues & Volume By Growing-up Milk for the Period 2022 - 2032
- Historical Data and Forecast of Finland Infant Formula Market Revenues & Volume By Ingredient for the Period 2022 - 2032
- Historical Data and Forecast of Finland Infant Formula Market Revenues & Volume By Carbohydrate for the Period 2022 - 2032
- Historical Data and Forecast of Finland Infant Formula Market Revenues & Volume By Fat for the Period 2022 - 2032
- Historical Data and Forecast of Finland Infant Formula Market Revenues & Volume By Protein for the Period 2022 - 2032
- Historical Data and Forecast of Finland Infant Formula Market Revenues & Volume By Minerals for the Period 2022 - 2032
- Historical Data and Forecast of Finland Infant Formula Market Revenues & Volume By Vitamins for the Period 2022 - 2032
- Historical Data and Forecast of Finland Infant Formula Market Revenues & Volume By Others for the Period 2022 - 2032
- Historical Data and Forecast of Finland Infant Formula Market Revenues & Volume By Distribution Channel for the Period 2022 - 2032
- Historical Data and Forecast of Finland Infant Formula Market Revenues & Volume By Online for the Period 2022 - 2032
- Historical Data and Forecast of Finland Infant Formula Market Revenues & Volume By Offline for the Period 2022 - 2032
- Finland Infant Formula Import Export Trade Statistics
- Market Opportunity Assessment By Type
- Market Opportunity Assessment By Ingredient
- Market Opportunity Assessment By Distribution Channel
- Finland Infant Formula Top Companies Market Share
- Finland Infant Formula Competitive Benchmarking By Technical and Operational Parameters
- Finland Infant Formula Company Profiles
- Finland Infant Formula Key Strategic Recommendations
Frequently Asked Questions About the Market Study (FAQs):
6Wresearch actively monitors the Finland Infant Formula Market and publishes its comprehensive annual report, highlighting emerging trends, growth drivers, revenue analysis, and forecast outlook. Our insights help businesses to make data-backed strategic decisions with ongoing market dynamics. Our analysts track relevent industries related to the Finland Infant Formula Market, allowing our clients with actionable intelligence and reliable forecasts tailored to emerging regional needs.
Yes, we provide customisation as per your requirements. To learn more, feel free to contact us on sales@6wresearch.com
1 Executive Summary |
2 Introduction |
2.1 Key Highlights of the Report |
2.2 Report Description |
2.3 Market Scope & Segmentation |
2.4 Research Methodology |
2.5 Assumptions |
3 Finland Infant Formula Market Overview |
3.1 Finland Country Macro Economic Indicators |
3.2 Finland Infant Formula Market Revenues & Volume, 2022 & 2032F |
3.3 Finland Infant Formula Market - Industry Life Cycle |
3.4 Finland Infant Formula Market - Porter's Five Forces |
3.5 Finland Infant Formula Market Revenues & Volume Share, By Type, 2022 & 2032F |
3.6 Finland Infant Formula Market Revenues & Volume Share, By Ingredient, 2022 & 2032F |
3.7 Finland Infant Formula Market Revenues & Volume Share, By Distribution Channel, 2022 & 2032F |
4 Finland Infant Formula Market Dynamics |
4.1 Impact Analysis |
4.2 Market Drivers |
4.3 Market Restraints |
5 Finland Infant Formula Market Trends |
6 Finland Infant Formula Market, By Types |
6.1 Finland Infant Formula Market, By Type |
6.1.1 Overview and Analysis |
6.1.2 Finland Infant Formula Market Revenues & Volume, By Type, 2022 - 2032F |
6.1.3 Finland Infant Formula Market Revenues & Volume, By Infant Milk, 2022 - 2032F |
6.1.4 Finland Infant Formula Market Revenues & Volume, By Follow on Milk, 2022 - 2032F |
6.1.5 Finland Infant Formula Market Revenues & Volume, By Specialty Baby Milk, 2022 - 2032F |
6.1.6 Finland Infant Formula Market Revenues & Volume, By Growing-up Milk, 2022 - 2032F |
6.2 Finland Infant Formula Market, By Ingredient |
6.2.1 Overview and Analysis |
6.2.2 Finland Infant Formula Market Revenues & Volume, By Carbohydrate, 2022 - 2032F |
6.2.3 Finland Infant Formula Market Revenues & Volume, By Fat, 2022 - 2032F |
6.2.4 Finland Infant Formula Market Revenues & Volume, By Protein, 2022 - 2032F |
6.2.5 Finland Infant Formula Market Revenues & Volume, By Minerals, 2022 - 2032F |
6.2.6 Finland Infant Formula Market Revenues & Volume, By Vitamins, 2022 - 2032F |
6.2.7 Finland Infant Formula Market Revenues & Volume, By Others, 2022 - 2032F |
6.3 Finland Infant Formula Market, By Distribution Channel |
6.3.1 Overview and Analysis |
6.3.2 Finland Infant Formula Market Revenues & Volume, By Online, 2022 - 2032F |
6.3.3 Finland Infant Formula Market Revenues & Volume, By Offline, 2022 - 2032F |
7 Finland Infant Formula Market Import-Export Trade Statistics |
7.1 Finland Infant Formula Market Export to Major Countries |
7.2 Finland Infant Formula Market Imports from Major Countries |
8 Finland Infant Formula Market Key Performance Indicators |
9 Finland Infant Formula Market - Opportunity Assessment |
9.1 Finland Infant Formula Market Opportunity Assessment, By Type, 2022 & 2032F |
9.2 Finland Infant Formula Market Opportunity Assessment, By Ingredient, 2022 & 2032F |
9.3 Finland Infant Formula Market Opportunity Assessment, By Distribution Channel, 2022 & 2032F |
10 Finland Infant Formula Market - Competitive Landscape |
10.1 Finland Infant Formula Market Revenue Share, By Companies, 2025 |
10.2 Finland Infant Formula Market Competitive Benchmarking, By Operating and Technical Parameters |
11 Company Profiles |
12 Recommendations |
13 Disclaimer |
Export potential assessment - trade Analytics for 2030
Export potential enables firms to identify high-growth global markets with greater confidence by combining advanced trade intelligence with a structured quantitative methodology. The framework analyzes emerging demand trends and country-level import patterns while integrating macroeconomic and trade datasets such as GDP and population forecasts, bilateral import–export flows, tariff structures, elasticity differentials between developed and developing economies, geographic distance, and import demand projections. Using weighted trade values from 2020–2024 as the base period to project country-to-country export potential for 2030, these inputs are operationalized through calculated drivers such as gravity model parameters, tariff impact factors, and projected GDP per-capita growth. Through an analysis of hidden potentials, demand hotspots, and market conditions that are most favorable to success, this method enables firms to focus on target countries, maximize returns, and global expansion with data, backed by accuracy.
By factoring in the projected importer demand gap that is currently unmet and could be potential opportunity, it identifies the potential for the Exporter (Country) among 190 countries, against the general trade analysis, which identifies the biggest importer or exporter.
To discover high-growth global markets and optimize your business strategy:
Click Here
Pricing
- Single User License$ 1,995
- Department License$ 2,400
- Site License$ 3,120
- Global License$ 3,795

Search
Thought Leadership and Analyst Meet


Our Clients
Latest Reports
- Canada Cloud CFD Market (2026-2032) | Size & Revenue, Industry, Growth, Competitive Landscape, Forecast, Segmentation, Value, Outlook, Trends, Share, Analysis, Companies
- Taiwan Food Delivery Platform Market (2026-2032) | Companies, Outlook, Analysis, Trends, Value, Revenue, Segmentation, Share, Forecast, Competitive Landscape, Growth, Size & Forecast
- United Kingdom (UK) Long-term Care Insurance Market (2026-2032) | Growth, Share, Consumer Insights, Drivers, Opportunities, Competition, Pricing Analysis, Segments, Restraints, Companies, Competitive, Value, Outlook, Size, Demand, Analysis, Challenges, Strategic Insights, Investment Trends, Revenue, Trends, Supply, Forecast
- United Kingdom (UK) Long Term Care Market (2026-2032) | Companies, Outlook, Analysis, Trends, Value, Revenue, Segmentation, Share, Forecast, Competitive Landscape, Growth, Size & Forecast
- Iraq Insulation and Waterproofing Market (2026-2032) | Outlook, Drivers, Growth, Size, Share, Industry, Revenue, Trends, Demand, Competitive, Strategic Insights, Opportunities, Segments, Companies, Challenges, Strategy, Consumer Insights, Analysis, Investment Trends, Value, Segmentation, Forecast, Restraints
- India Switchgear Market Outlook (2026-2032) | Size, Share, Trends, Growth, Revenue, Forecast, Analysis, Value, Outlook
- Pakistan Contraceptive Implants Market (2025-2031) | Demand, Growth, Size, Share, Industry, Pricing Analysis, Competitive, Strategic Insights, Strategy, Consumer Insights, Analysis, Investment Trends, Opportunities, Revenue, Segments, Value, Segmentation, Supply, Forecast, Restraints, Outlook, Competition, Drivers, Trends, Companies, Challenges
- Sri Lanka Packaging Market (2026-2032) | Outlook, Competition, Drivers, Trends, Demand, Pricing Analysis, Competitive, Strategic Insights, Companies, Challenges, Strategy, Consumer Insights, Analysis, Investment Trends, Opportunities, Growth, Size, Share, Industry, Revenue, Segments, Value, Segmentation, Supply, Forecast, Restraints
- India Kids Watches Market (2026-2032) | Strategy, Consumer Insights, Analysis, Investment Trends, Opportunities, Growth, Size, Share, Industry, Revenue, Segments, Value, Segmentation, Supply, Forecast, Restraints, Outlook, Competition, Drivers, Trends, Demand, Pricing Analysis, Competitive, Strategic Insights, Companies, Challenges
- Saudi Arabia Core Assurance Service Market (2025-2031) | Strategy, Consumer Insights, Analysis, Investment Trends, Opportunities, Growth, Size, Share, Industry, Revenue, Segments, Value, Segmentation, Supply, Forecast, Restraints, Outlook, Competition, Drivers, Trends, Demand, Pricing Analysis, Competitive, Strategic Insights, Companies, Challenges
Industry Events and Analyst Meet

India EV Show 2026

EV tech India Expo 2026

Auto Tech Asia 2026

Battery Tech India 2026

Smart Production Solutions Guangzhou 2026
Whitepaper
- Middle East & Africa Commercial Security Market Click here to view more.
- Middle East & Africa Fire Safety Systems & Equipment Market Click here to view more.
- GCC Drone Market Click here to view more.
- Middle East Lighting Fixture Market Click here to view more.
- GCC Physical & Perimeter Security Market Click here to view more.
6WResearch In News
- Doha a strategic location for EV manufacturing hub: IPA Qatar
- Demand for luxury TVs surging in the GCC, says Samsung
- Empowering Growth: The Thriving Journey of Bangladesh’s Cable Industry
- Demand for luxury TVs surging in the GCC, says Samsung
- Video call with a traditional healer? Once unthinkable, it’s now common in South Africa
- Intelligent Buildings To Smooth GCC’s Path To Net Zero