Finland Optical Brightener Market (2026-2032) | Companies, Growth, Analysis, Outlook, Industry, Share, Segmentation, Trends, Forecast, Size & Revenue, Value, Competitive Landscape
Market Forecast By Chemical Type (Triazine-stilbenes, Coumarins, Imidazolines, Diazoles, Benzoxazolines, Other Chemical Types), By Application (Detergent brightener, Paper Brightening, Fiber Whitening, Textile Whitening, Cosmetics, Other Applications) And Competitive Landscape
| Product Code: ETC7203571 | Publication Date: Sep 2024 | Updated Date: Apr 2026 | Product Type: Market Research Report | |
| Publisher: 6Wresearch | Author: Shubham Padhi | No. of Pages: 75 | No. of Figures: 35 | No. of Tables: 20 |
Finland Optical Brightener Market Size (2020-2030)
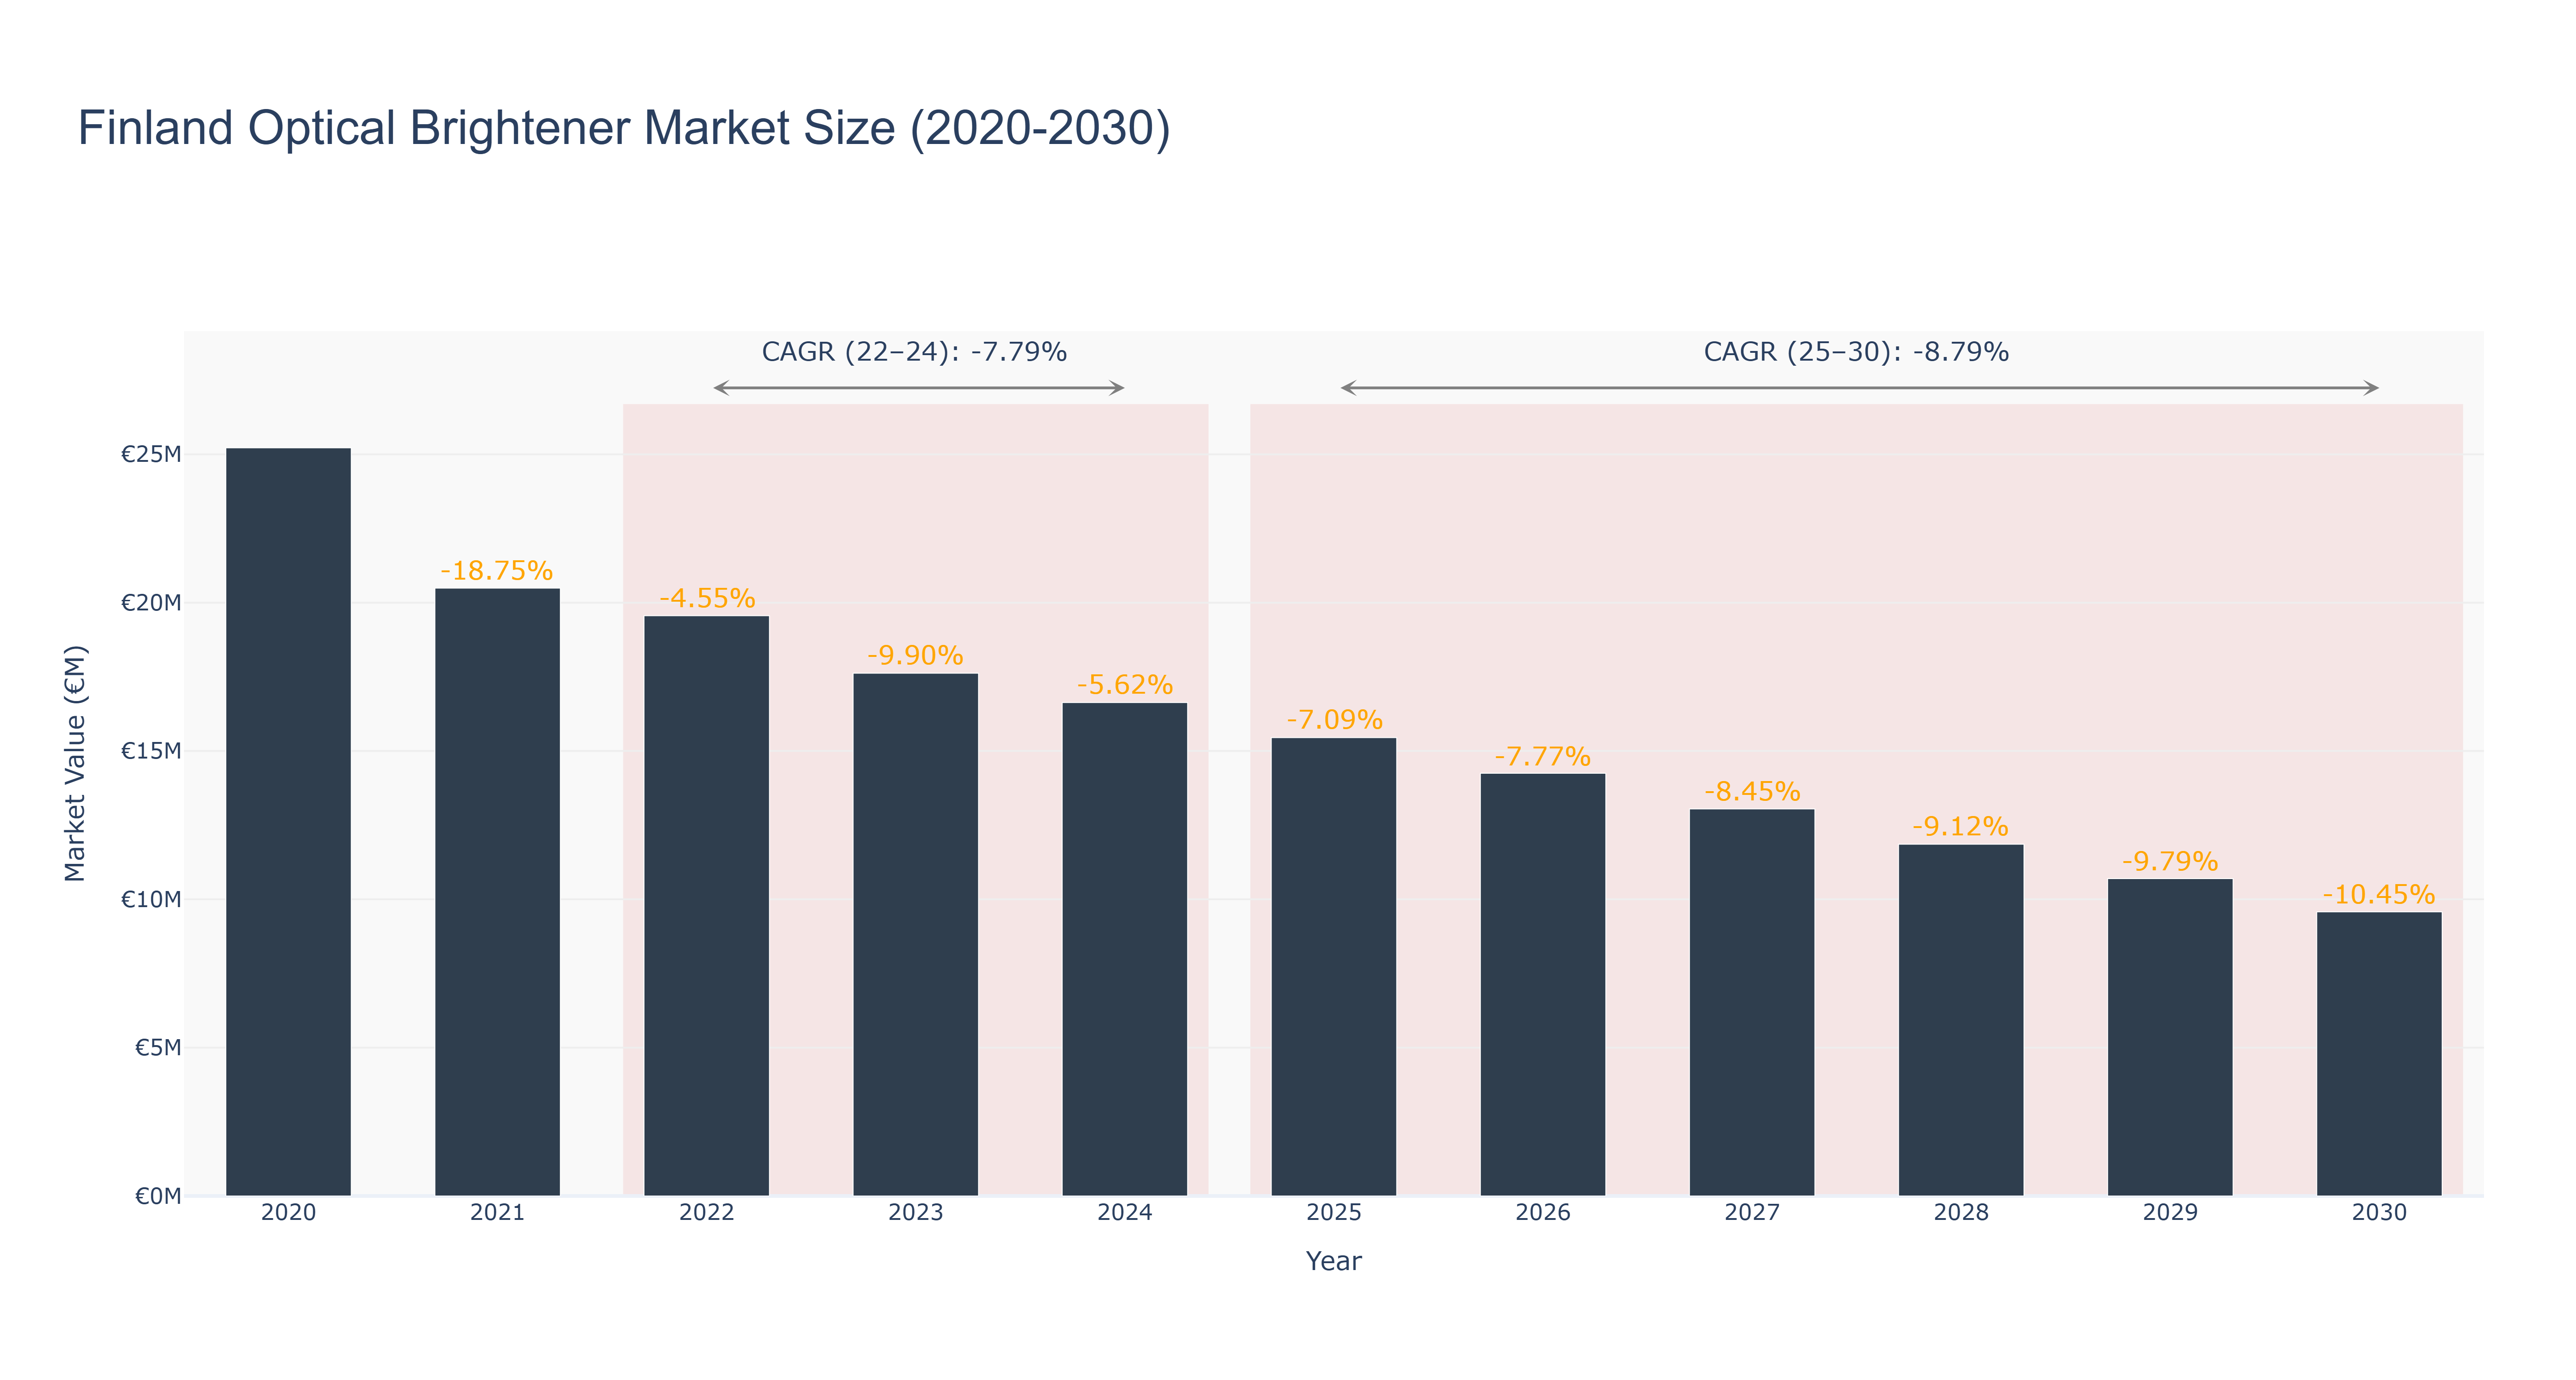
The Finland Optical Brightener Market experienced a peak market size of €25.22 million in 2020, followed by a steady decline in subsequent years. The actual market size decreased to €16.63 million in 2024, with a negative growth rate each year. Forecasted market sizes from 2025 to 2030 continue this downward trend, with an expected market size of €9.58 million in 2030. The CAGR for the period 2022-24 is -7.79%, while for 2025-30 it is -8.79%. The market's downturn can be attributed to factors such as changing consumer preferences, technological advancements, and global economic conditions impacting the industry. Looking ahead, Finland is set to invest in sustainable packaging solutions to align with environmental regulations, potentially offering a new growth avenue for the Optical Brightener Market.
Finland Optical Brightener Market: Production & Trade Performance (2019-2025)
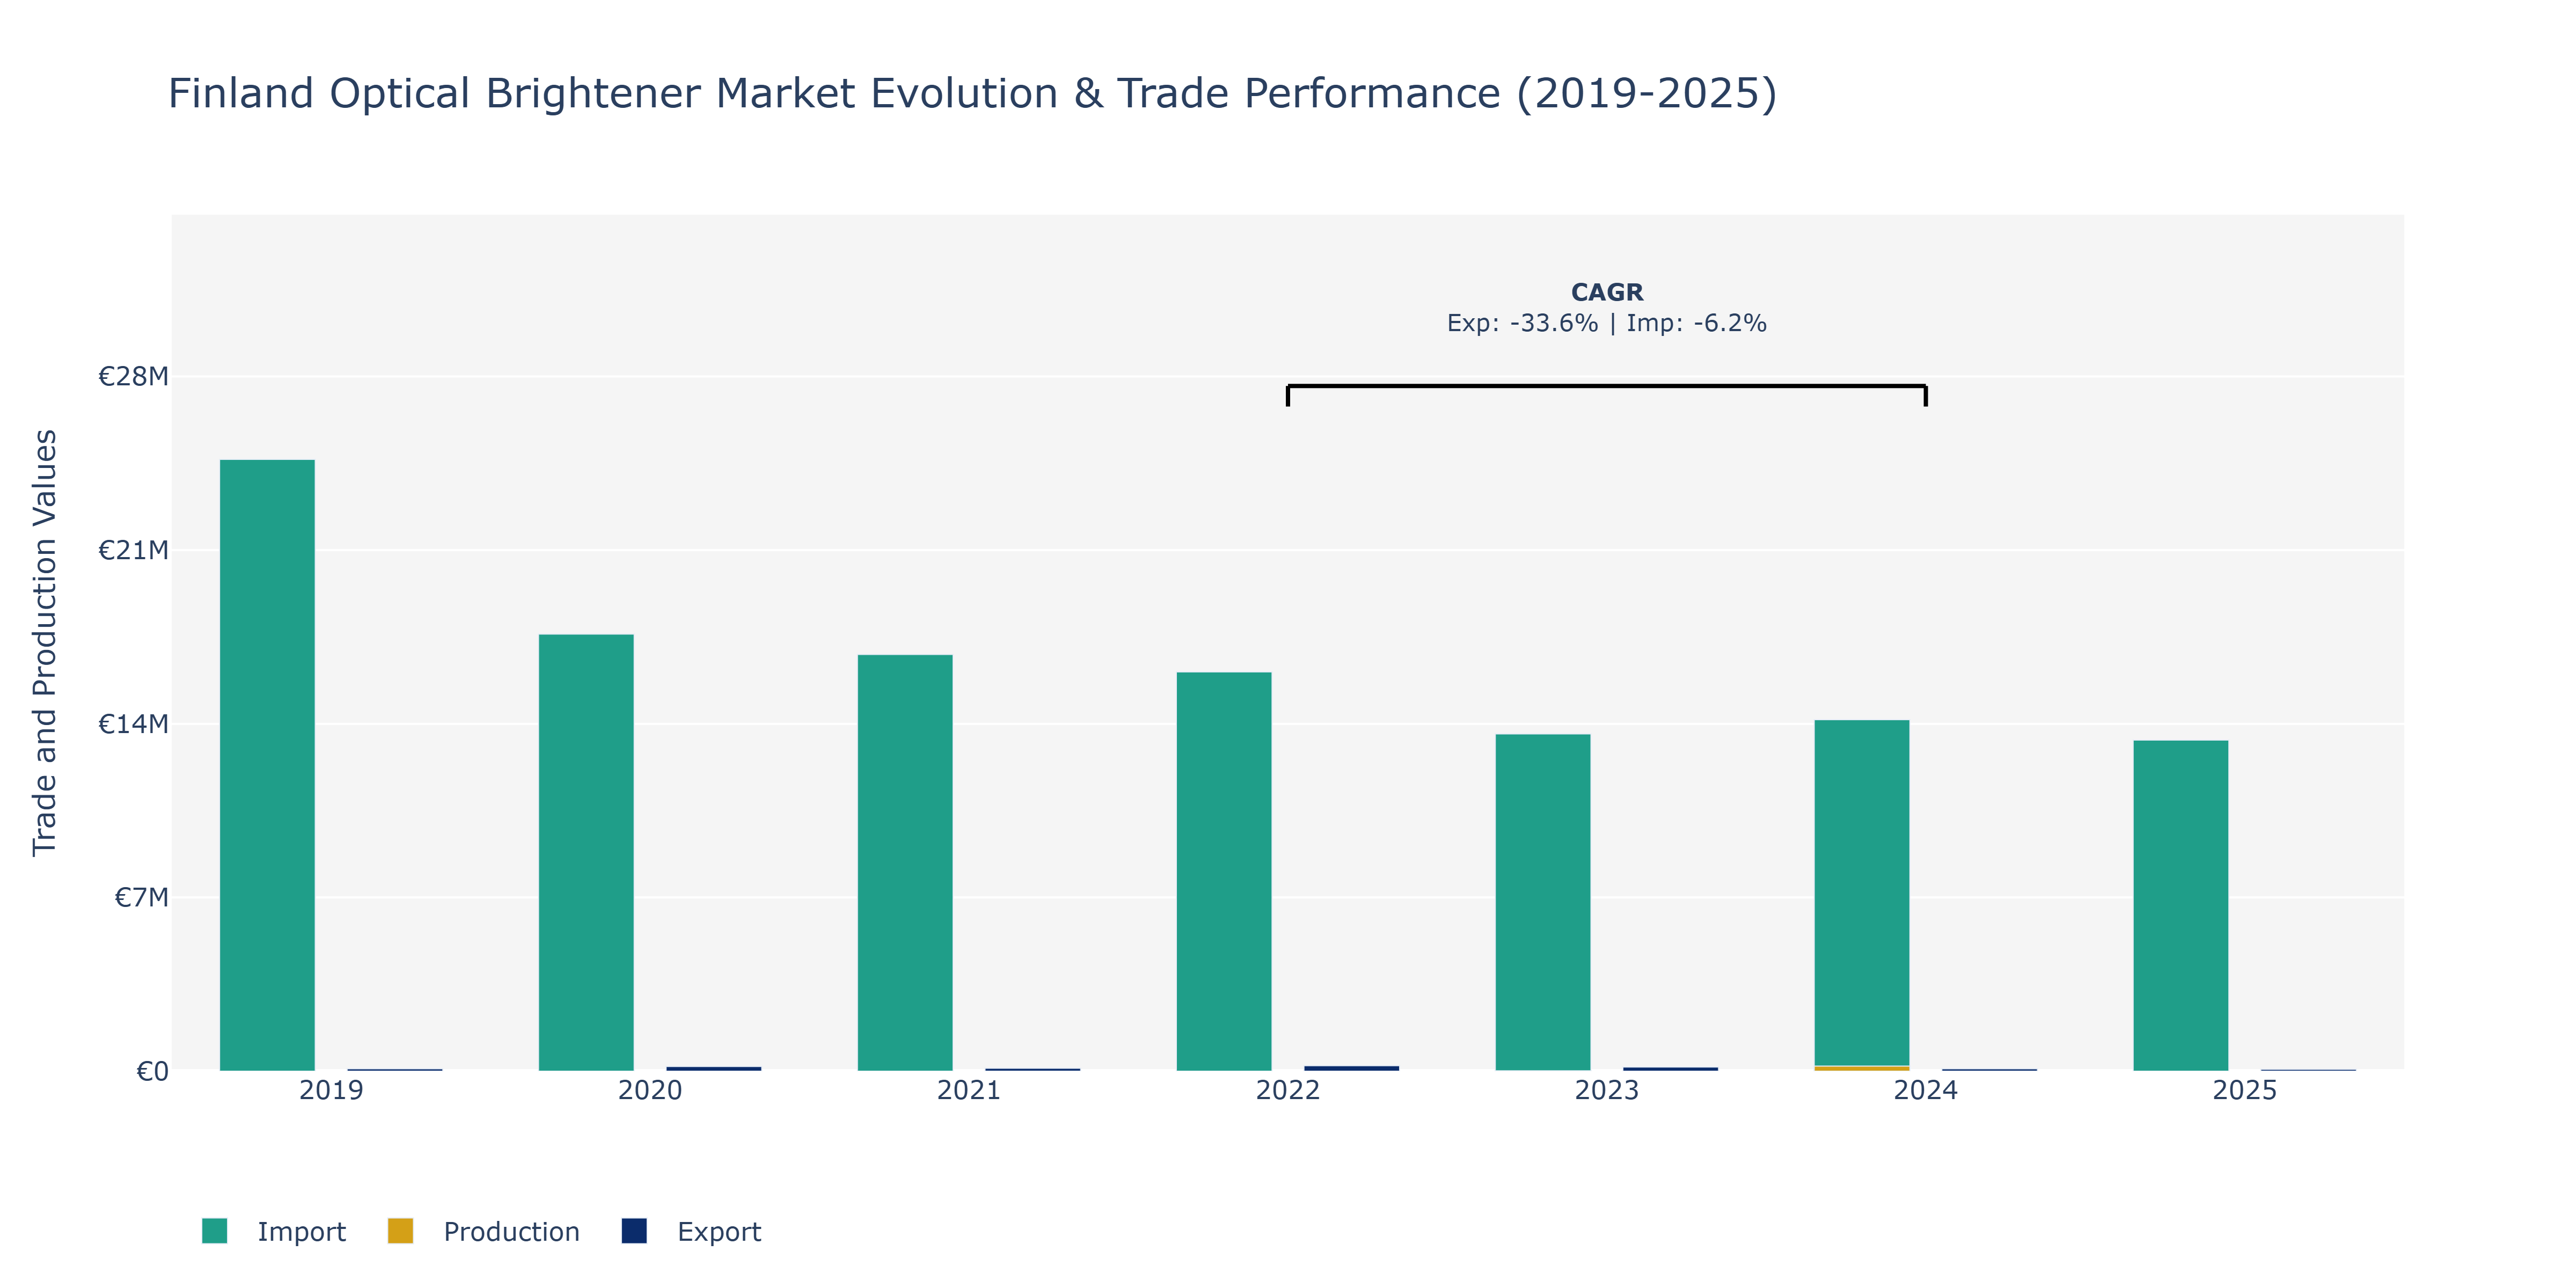
In the Finland Optical Brightener Market, exports displayed varying trends over the years, reaching a peak in 2022 at €224.5 thousand before declining in 2023 and 2024 to €169.0 thousand and €98.89 thousand, respectively. This fluctuation may be attributed to changing global demand patterns for optical brighteners in industries such as textiles and detergents. Conversely, imports showcased a gradual decrease from €24.66 million in 2019 to €13.35 million in 2025, potentially indicating a shift towards domestic production or alternative sourcing strategies. This surge in production could be linked to technological advancements, improved manufacturing processes, and growing investments in the domestic optical brightener industry. Such trends reflect a complex interplay of global market dynamics and local industry developments within the optical brightener sector in Finland.
Key Highlights of the Report:
- Finland Optical Brightener Market Outlook
- Market Size of Finland Optical Brightener Market, 2025
- Forecast of Finland Optical Brightener Market, 2032
- Historical Data and Forecast of Finland Optical Brightener Revenues & Volume for the Period 2022 - 2032
- Finland Optical Brightener Market Trend Evolution
- Finland Optical Brightener Market Drivers and Challenges
- Finland Optical Brightener Price Trends
- Finland Optical Brightener Porter's Five Forces
- Finland Optical Brightener Industry Life Cycle
- Historical Data and Forecast of Finland Optical Brightener Market Revenues & Volume By Chemical Type for the Period 2022 - 2032
- Historical Data and Forecast of Finland Optical Brightener Market Revenues & Volume By Triazine-stilbenes for the Period 2022 - 2032
- Historical Data and Forecast of Finland Optical Brightener Market Revenues & Volume By Coumarins for the Period 2022 - 2032
- Historical Data and Forecast of Finland Optical Brightener Market Revenues & Volume By Imidazolines for the Period 2022 - 2032
- Historical Data and Forecast of Finland Optical Brightener Market Revenues & Volume By Diazoles for the Period 2022 - 2032
- Historical Data and Forecast of Finland Optical Brightener Market Revenues & Volume By Benzoxazolines for the Period 2022 - 2032
- Historical Data and Forecast of Finland Optical Brightener Market Revenues & Volume By Other Chemical Types for the Period 2022 - 2032
- Historical Data and Forecast of Finland Optical Brightener Market Revenues & Volume By Application for the Period 2022 - 2032
- Historical Data and Forecast of Finland Optical Brightener Market Revenues & Volume By Detergent brightener for the Period 2022 - 2032
- Historical Data and Forecast of Finland Optical Brightener Market Revenues & Volume By Paper Brightening for the Period 2022 - 2032
- Historical Data and Forecast of Finland Optical Brightener Market Revenues & Volume By Fiber Whitening for the Period 2022 - 2032
- Historical Data and Forecast of Finland Optical Brightener Market Revenues & Volume By Textile Whitening for the Period 2022 - 2032
- Historical Data and Forecast of Finland Optical Brightener Market Revenues & Volume By Cosmetics for the Period 2022 - 2032
- Historical Data and Forecast of Finland Optical Brightener Market Revenues & Volume By Other Applications for the Period 2022 - 2032
- Finland Optical Brightener Import Export Trade Statistics
- Market Opportunity Assessment By Chemical Type
- Market Opportunity Assessment By Application
- Finland Optical Brightener Top Companies Market Share
- Finland Optical Brightener Competitive Benchmarking By Technical and Operational Parameters
- Finland Optical Brightener Company Profiles
- Finland Optical Brightener Key Strategic Recommendations
Frequently Asked Questions About the Market Study (FAQs):
6Wresearch actively monitors the Finland Optical Brightener Market and publishes its comprehensive annual report, highlighting emerging trends, growth drivers, revenue analysis, and forecast outlook. Our insights help businesses to make data-backed strategic decisions with ongoing market dynamics. Our analysts track relevent industries related to the Finland Optical Brightener Market, allowing our clients with actionable intelligence and reliable forecasts tailored to emerging regional needs.
Yes, we provide customisation as per your requirements. To learn more, feel free to contact us on sales@6wresearch.com
1 Executive Summary |
2 Introduction |
2.1 Key Highlights of the Report |
2.2 Report Description |
2.3 Market Scope & Segmentation |
2.4 Research Methodology |
2.5 Assumptions |
3 Finland Optical Brightener Market Overview |
3.1 Finland Country Macro Economic Indicators |
3.2 Finland Optical Brightener Market Revenues & Volume, 2022 & 2032F |
3.3 Finland Optical Brightener Market - Industry Life Cycle |
3.4 Finland Optical Brightener Market - Porter's Five Forces |
3.5 Finland Optical Brightener Market Revenues & Volume Share, By Chemical Type, 2022 & 2032F |
3.6 Finland Optical Brightener Market Revenues & Volume Share, By Application, 2022 & 2032F |
4 Finland Optical Brightener Market Dynamics |
4.1 Impact Analysis |
4.2 Market Drivers |
4.2.1 Growing demand for eco-friendly and sustainable optical brighteners in Finland. |
4.2.2 Increasing awareness about the benefits of optical brighteners in various industries. |
4.2.3 Technological advancements leading to the development of more efficient and effective optical brightener products. |
4.3 Market Restraints |
4.3.1 Stringent regulations and standards related to the use of optical brighteners in Finland. |
4.3.2 Fluctuating raw material prices affecting the production costs of optical brighteners. |
5 Finland Optical Brightener Market Trends |
6 Finland Optical Brightener Market, By Types |
6.1 Finland Optical Brightener Market, By Chemical Type |
6.1.1 Overview and Analysis |
6.1.2 Finland Optical Brightener Market Revenues & Volume, By Chemical Type, 2022 - 2032F |
6.1.3 Finland Optical Brightener Market Revenues & Volume, By Triazine-stilbenes, 2022 - 2032F |
6.1.4 Finland Optical Brightener Market Revenues & Volume, By Coumarins, 2022 - 2032F |
6.1.5 Finland Optical Brightener Market Revenues & Volume, By Imidazolines, 2022 - 2032F |
6.1.6 Finland Optical Brightener Market Revenues & Volume, By Diazoles, 2022 - 2032F |
6.1.7 Finland Optical Brightener Market Revenues & Volume, By Benzoxazolines, 2022 - 2032F |
6.1.8 Finland Optical Brightener Market Revenues & Volume, By Other Chemical Types, 2022 - 2032F |
6.2 Finland Optical Brightener Market, By Application |
6.2.1 Overview and Analysis |
6.2.2 Finland Optical Brightener Market Revenues & Volume, By Detergent brightener, 2022 - 2032F |
6.2.3 Finland Optical Brightener Market Revenues & Volume, By Paper Brightening, 2022 - 2032F |
6.2.4 Finland Optical Brightener Market Revenues & Volume, By Fiber Whitening, 2022 - 2032F |
6.2.5 Finland Optical Brightener Market Revenues & Volume, By Textile Whitening, 2022 - 2032F |
6.2.6 Finland Optical Brightener Market Revenues & Volume, By Cosmetics, 2022 - 2032F |
6.2.7 Finland Optical Brightener Market Revenues & Volume, By Other Applications, 2022 - 2032F |
7 Finland Optical Brightener Market Import-Export Trade Statistics |
7.1 Finland Optical Brightener Market Export to Major Countries |
7.2 Finland Optical Brightener Market Imports from Major Countries |
8 Finland Optical Brightener Market Key Performance Indicators |
8.1 Environmental impact assessment of optical brighteners used in Finland. |
8.2 Adoption rate of innovative optical brightener products in different industries. |
8.3 Research and development investments in sustainable optical brightener technologies. |
9 Finland Optical Brightener Market - Opportunity Assessment |
9.1 Finland Optical Brightener Market Opportunity Assessment, By Chemical Type, 2022 & 2032F |
9.2 Finland Optical Brightener Market Opportunity Assessment, By Application, 2022 & 2032F |
10 Finland Optical Brightener Market - Competitive Landscape |
10.1 Finland Optical Brightener Market Revenue Share, By Companies, 2025 |
10.2 Finland Optical Brightener Market Competitive Benchmarking, By Operating and Technical Parameters |
11 Company Profiles |
12 Recommendations |
13 Disclaimer |
Export potential assessment - trade Analytics for 2030
Export potential enables firms to identify high-growth global markets with greater confidence by combining advanced trade intelligence with a structured quantitative methodology. The framework analyzes emerging demand trends and country-level import patterns while integrating macroeconomic and trade datasets such as GDP and population forecasts, bilateral import–export flows, tariff structures, elasticity differentials between developed and developing economies, geographic distance, and import demand projections. Using weighted trade values from 2020–2024 as the base period to project country-to-country export potential for 2030, these inputs are operationalized through calculated drivers such as gravity model parameters, tariff impact factors, and projected GDP per-capita growth. Through an analysis of hidden potentials, demand hotspots, and market conditions that are most favorable to success, this method enables firms to focus on target countries, maximize returns, and global expansion with data, backed by accuracy.
By factoring in the projected importer demand gap that is currently unmet and could be potential opportunity, it identifies the potential for the Exporter (Country) among 190 countries, against the general trade analysis, which identifies the biggest importer or exporter.
To discover high-growth global markets and optimize your business strategy:
Click Here
Pricing
- Single User License$ 1,995
- Department License$ 2,400
- Site License$ 3,120
- Global License$ 3,795

Search
Thought Leadership and Analyst Meet


Our Clients
Latest Reports
- Philippines Polyhydroxybutyrate-co-Hydroxyvalerate Market (2026-2032) | Trends, Insights, Challenges, Restraints, Competition, Size, Value, Forecast, Pricing, Share, Outlook, Revenue, Investment Opportunities, Strategy, Drivers, Demand, Growth, segmentation, Analysis, Companies
- Peru Polyhydroxybutyrate-co-Hydroxyvalerate Market (2026-2032) | Growth, Demand, Challenges, Share, Trends, Analysis, Pricing, Investment Opportunities, Drivers, Value, Forecast, Competition, Size, Companies, Insights, Outlook, Restraints, segmentation, Revenue, Strategy
- Pakistan Polyhydroxybutyrate-co-Hydroxyvalerate Market (2026-2032) | Restraints, segmentation, Pricing, Forecast, Share, Strategy, Competition, Trends, Insights, Drivers, Challenges, Growth, Revenue, Outlook, Value, Investment Opportunities, Companies, Size, Analysis, Demand
- Oman Polyhydroxybutyrate-co-Hydroxyvalerate Market (2026-2032) | Drivers, segmentation, Insights, Competition, Pricing, Outlook, Size, Revenue, Challenges, Forecast, Analysis, Growth, Value, Share, Trends, Investment Opportunities, Strategy, Restraints, Companies, Demand
- Nigeria Polyhydroxybutyrate-co-Hydroxyvalerate Market (2026-2032) | Value, Investment Opportunities, Analysis, Revenue, Restraints, Pricing, Outlook, Competition, Demand, Growth, Forecast, Companies, Trends, Challenges, segmentation, Drivers, Insights, Share, Size, Strategy
- Nepal Polyhydroxybutyrate-co-Hydroxyvalerate Market (2026-2032) | Insights, Analysis, Drivers, Share, Revenue, Demand, segmentation, Investment Opportunities, Competition, Forecast, Growth, Pricing, Companies, Strategy, Trends, Restraints, Challenges, Outlook, Size, Value
- Myanmar Polyhydroxybutyrate-co-Hydroxyvalerate Market (2026-2032) | Outlook, Revenue, Strategy, Restraints, Drivers, segmentation, Share, Forecast, Competition, Insights, Growth, Pricing, Size, Demand, Value, Companies, Trends, Challenges, Investment Opportunities, Analysis
- Morocco Polyhydroxybutyrate-co-Hydroxyvalerate Market (2026-2032) | Outlook, Investment Opportunities, Restraints, Strategy, Forecast, Challenges, Drivers, Growth, Companies, segmentation, Trends, Size, Competition, Revenue, Demand, Insights, Share, Analysis, Value, Pricing
- Mexico Polyhydroxybutyrate-co-Hydroxyvalerate Market (2026-2032) | Size, Drivers, Outlook, Share, Strategy, Growth, Pricing, Challenges, Companies, Demand, Value, Investment Opportunities, Restraints, Trends, Forecast, segmentation, Analysis, Insights, Competition, Revenue
- Malaysia Polyhydroxybutyrate-co-Hydroxyvalerate Market (2026-2032) | Share, segmentation, Size, Companies, Analysis, Insights, Forecast, Value, Revenue, Drivers, Restraints, Challenges, Investment Opportunities, Trends, Competition, Strategy, Demand, Growth, Outlook, Pricing
Industry Events and Analyst Meet

HIMTEX 2026

India Refining Summit 2026

India EV Show 2026

EV tech India Expo 2026

Auto Tech Asia 2026
Whitepaper
- Middle East & Africa Commercial Security Market Click here to view more.
- Middle East & Africa Fire Safety Systems & Equipment Market Click here to view more.
- GCC Drone Market Click here to view more.
- Middle East Lighting Fixture Market Click here to view more.
- GCC Physical & Perimeter Security Market Click here to view more.
6WResearch In News
- Doha a strategic location for EV manufacturing hub: IPA Qatar
- Demand for luxury TVs surging in the GCC, says Samsung
- Empowering Growth: The Thriving Journey of Bangladesh’s Cable Industry
- Demand for luxury TVs surging in the GCC, says Samsung
- Video call with a traditional healer? Once unthinkable, it’s now common in South Africa
- Intelligent Buildings To Smooth GCC’s Path To Net Zero