Finland Phenolic Resins Market (2025-2031) | Share, Revenue, Growth, Value, Companies, Forecast, Segmentation, Trends, Outlook, Industry, Size & Analysis
Market Forecast By Product (Novolac, Resol, Others), By Application (Wood Adhesives, Molding, Insulation, Laminates, Paper Impregnation, Coatings, Others) And Competitive Landscape
| Product Code: ETC4679374 | Publication Date: Nov 2023 | Updated Date: Nov 2025 | Product Type: Market Research Report | |
| Publisher: 6Wresearch | Author: Shubham Deep | No. of Pages: 60 | No. of Figures: 30 | No. of Tables: 5 |
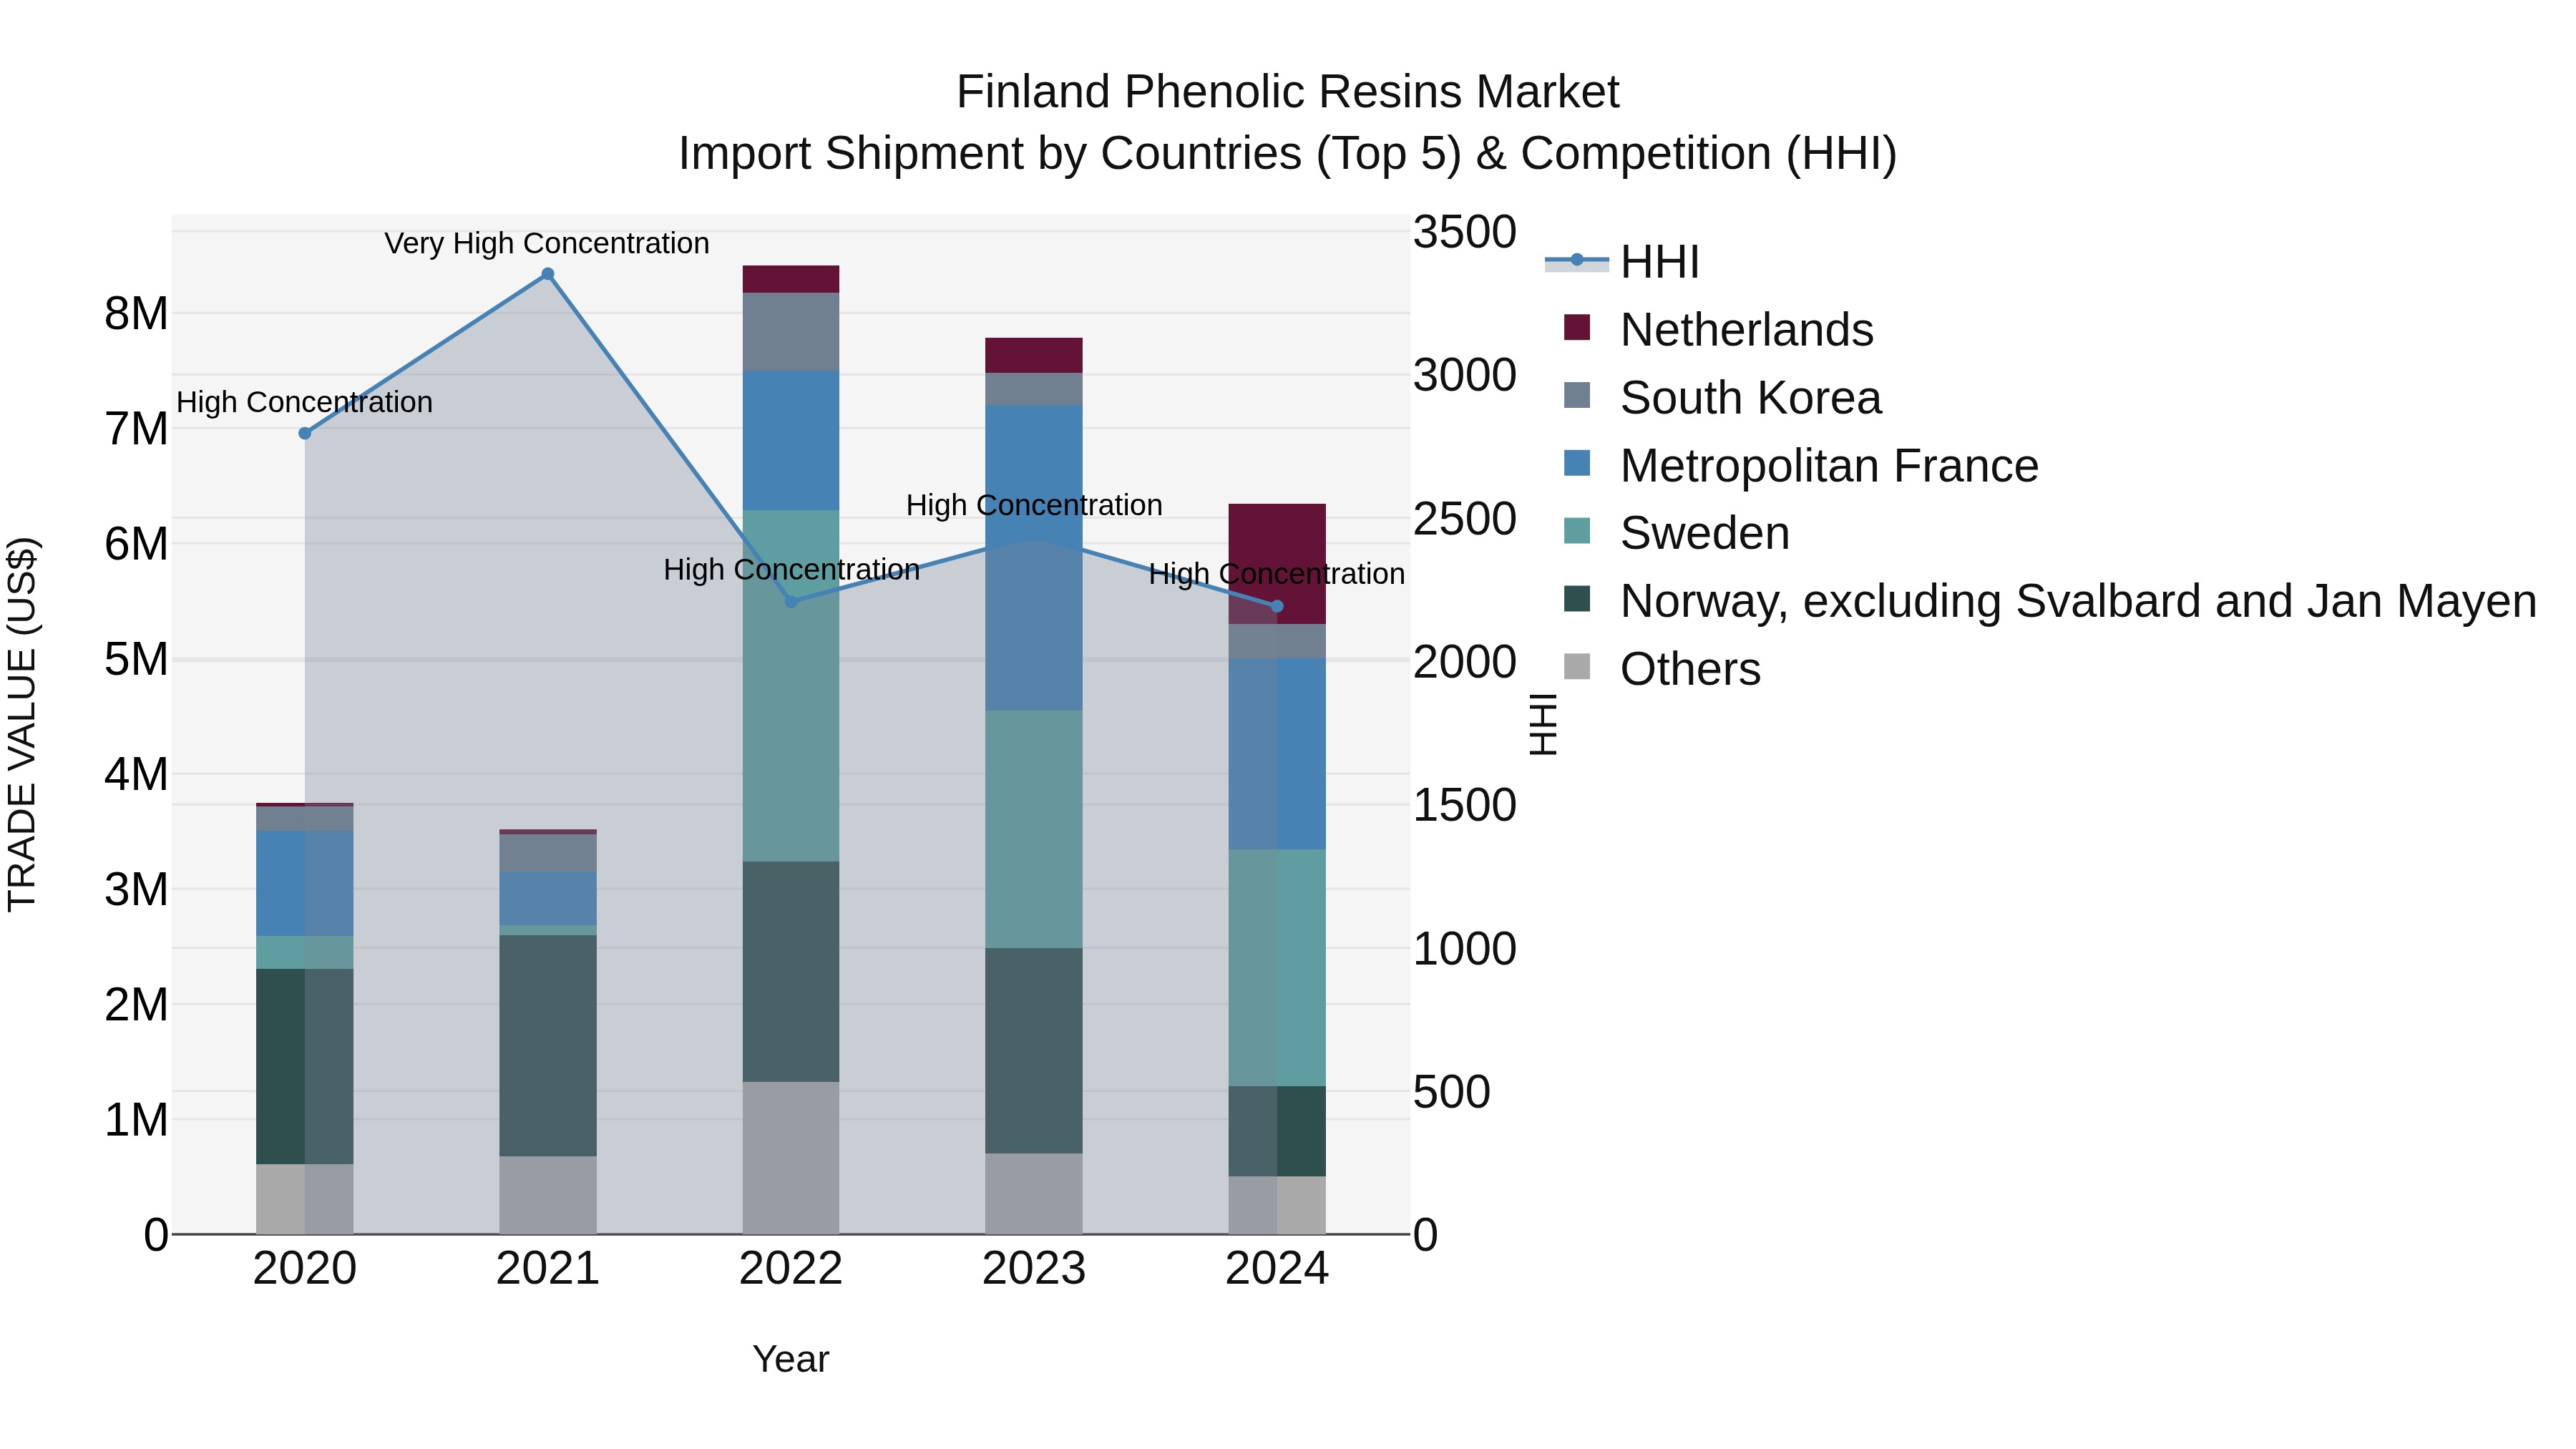
Finland Phenolic Resins Market Top 5 Importing Countries and Market Competition (HHI) Analysis
In 2024, Finland continued to witness a significant influx of phenolic resins imports, with key suppliers being Sweden, Metropolitan France, Netherlands, Norway, and South Korea. The market remained highly concentrated, as indicated by the high Herfindahl-Hirschman Index (HHI). Despite a slight decline in growth rate from 2023 to 2024, the compound annual growth rate (CAGR) over the period of 2020-2024 stood at an impressive 14.09%. This data suggests a robust demand for phenolic resins in Finland, highlighting the country`s reliance on imports for this particular product.
Finland Phenolic Resins Market Overview
The phenolic resins market in Finland is expanding due to the increasing demand for these resins in automotive, construction, and electronics industries. Their high heat resistance and durability make phenolic resins ideal for use in various industrial applications, from adhesives to coatings.
Drivers of the market
The phenolic resins market in Finland is expanding due to the increasing demand for these resins in industries such as automotive, construction, and electronics. Phenolic resins are valued for their high heat resistance, durability, and insulating properties, making them ideal for use in coatings, adhesives, and electrical components. Additionally, the demand for lightweight and fire-resistant materials continues to support market growth.
Challenges of the market
The Phenolic Resins market in Finland encounters challenges related to the growing preference for eco-friendly and low-emission materials in manufacturing. The high cost of raw materials used in the production of phenolic resins, coupled with environmental concerns over their chemical components, has led to increased pressure on manufacturers to innovate and develop more sustainable alternatives. The market also faces competition from thermosetting plastics and other resin types that offer similar performance with lower costs.
Government Policy of the market
The Finnish governments commitment to sustainable and environmentally friendly industrial practices encourages the use of phenolic resins in various applications. Regulations that support advanced manufacturing processes in industries such as automotive and construction drive market demand. Finlands focus on reducing carbon emissions supports the growth of resin-based products.
Key Highlights of the Report:
- Finland Phenolic Resins Market Outlook
- Market Size of Finland Phenolic Resins Market, 2024
- Forecast of Finland Phenolic Resins Market, 2031
- Historical Data and Forecast of Finland Phenolic Resins Revenues & Volume for the Period 2021-2031
- Finland Phenolic Resins Market Trend Evolution
- Finland Phenolic Resins Market Drivers and Challenges
- Finland Phenolic Resins Price Trends
- Finland Phenolic Resins Porter`s Five Forces
- Finland Phenolic Resins Industry Life Cycle
- Historical Data and Forecast of Finland Phenolic Resins Market Revenues & Volume By Product for the Period 2021-2031
- Historical Data and Forecast of Finland Phenolic Resins Market Revenues & Volume By Novolac for the Period 2021-2031
- Historical Data and Forecast of Finland Phenolic Resins Market Revenues & Volume By Resol for the Period 2021-2031
- Historical Data and Forecast of Finland Phenolic Resins Market Revenues & Volume By Others for the Period 2021-2031
- Historical Data and Forecast of Finland Phenolic Resins Market Revenues & Volume By Application for the Period 2021-2031
- Historical Data and Forecast of Finland Phenolic Resins Market Revenues & Volume By Wood Adhesives for the Period 2021-2031
- Historical Data and Forecast of Finland Phenolic Resins Market Revenues & Volume By Molding for the Period 2021-2031
- Historical Data and Forecast of Finland Phenolic Resins Market Revenues & Volume By Insulation for the Period 2021-2031
- Historical Data and Forecast of Finland Phenolic Resins Market Revenues & Volume By Laminates for the Period 2021-2031
- Historical Data and Forecast of Finland Phenolic Resins Market Revenues & Volume By Paper Impregnation for the Period 2021-2031
- Historical Data and Forecast of Finland Phenolic Resins Market Revenues & Volume By Coatings for the Period 2021-2031
- Historical Data and Forecast of Finland Phenolic Resins Market Revenues & Volume By Others for the Period 2021-2031
- Finland Phenolic Resins Import Export Trade Statistics
- Market Opportunity Assessment By Product
- Market Opportunity Assessment By Application
- Finland Phenolic Resins Top Companies Market Share
- Finland Phenolic Resins Competitive Benchmarking By Technical and Operational Parameters
- Finland Phenolic Resins Company Profiles
- Finland Phenolic Resins Key Strategic Recommendations
Frequently Asked Questions About the Market Study (FAQs):
6Wresearch actively monitors the Finland Phenolic Resins Market and publishes its comprehensive annual report, highlighting emerging trends, growth drivers, revenue analysis, and forecast outlook. Our insights help businesses to make data-backed strategic decisions with ongoing market dynamics. Our analysts track relevent industries related to the Finland Phenolic Resins Market, allowing our clients with actionable intelligence and reliable forecasts tailored to emerging regional needs.
Yes, we provide customisation as per your requirements. To learn more, feel free to contact us on sales@6wresearch.com
1 Executive Summary |
2 Introduction |
2.1 Key Highlights of the Report |
2.2 Report Description |
2.3 Market Scope & Segmentation |
2.4 Research Methodology |
2.5 Assumptions |
3 Finland Phenolic Resins Market Overview |
3.1 Finland Country Macro Economic Indicators |
3.2 Finland Phenolic Resins Market Revenues & Volume, 2021 & 2031F |
3.3 Finland Phenolic Resins Market - Industry Life Cycle |
3.4 Finland Phenolic Resins Market - Porter's Five Forces |
3.5 Finland Phenolic Resins Market Revenues & Volume Share, By Product, 2021 & 2031F |
3.6 Finland Phenolic Resins Market Revenues & Volume Share, By Application, 2021 & 2031F |
4 Finland Phenolic Resins Market Dynamics |
4.1 Impact Analysis |
4.2 Market Drivers |
4.2.1 Increasing demand for eco-friendly and sustainable materials in various industries |
4.2.2 Growing construction sector in Finland |
4.2.3 Rising focus on energy efficiency and insulation materials |
4.3 Market Restraints |
4.3.1 Volatility in raw material prices |
4.3.2 Stringent regulations regarding emissions and environmental impact |
4.3.3 Competition from alternative materials such as epoxy resins |
5 Finland Phenolic Resins Market Trends |
6 Finland Phenolic Resins Market Segmentations |
6.1 Finland Phenolic Resins Market, By Product |
6.1.1 Overview and Analysis |
6.1.2 Finland Phenolic Resins Market Revenues & Volume, By Novolac, 2021-2031F |
6.1.3 Finland Phenolic Resins Market Revenues & Volume, By Resol, 2021-2031F |
6.1.4 Finland Phenolic Resins Market Revenues & Volume, By Others, 2021-2031F |
6.2 Finland Phenolic Resins Market, By Application |
6.2.1 Overview and Analysis |
6.2.2 Finland Phenolic Resins Market Revenues & Volume, By Wood Adhesives, 2021-2031F |
6.2.3 Finland Phenolic Resins Market Revenues & Volume, By Molding, 2021-2031F |
6.2.4 Finland Phenolic Resins Market Revenues & Volume, By Insulation, 2021-2031F |
6.2.5 Finland Phenolic Resins Market Revenues & Volume, By Laminates, 2021-2031F |
6.2.6 Finland Phenolic Resins Market Revenues & Volume, By Paper Impregnation, 2021-2031F |
6.2.7 Finland Phenolic Resins Market Revenues & Volume, By Coatings, 2021-2031F |
7 Finland Phenolic Resins Market Import-Export Trade Statistics |
7.1 Finland Phenolic Resins Market Export to Major Countries |
7.2 Finland Phenolic Resins Market Imports from Major Countries |
8 Finland Phenolic Resins Market Key Performance Indicators |
8.1 Adoption rate of phenolic resins in key industries (e.g., construction, automotive) |
8.2 Number of new product innovations and applications using phenolic resins |
8.3 Investment in research and development for enhancing phenolic resin properties |
8.4 Environmental certifications and compliance levels for phenolic resin manufacturers |
8.5 Market penetration of phenolic resins in emerging applications (e.g., electronics, aerospace) |
9 Finland Phenolic Resins Market - Opportunity Assessment |
9.1 Finland Phenolic Resins Market Opportunity Assessment, By Product, 2021 & 2031F |
9.2 Finland Phenolic Resins Market Opportunity Assessment, By Application, 2021 & 2031F |
10 Finland Phenolic Resins Market - Competitive Landscape |
10.1 Finland Phenolic Resins Market Revenue Share, By Companies, 2024 |
10.2 Finland Phenolic Resins Market Competitive Benchmarking, By Operating and Technical Parameters |
11 Company Profiles |
12 Recommendations | 13 Disclaimer |
Global Go To Market Strategy - 2030
Export potential enables firms to identify high-growth global markets with greater confidence by combining advanced trade intelligence with a structured quantitative methodology. The framework analyzes emerging demand trends and country-level import patterns while integrating macroeconomic and trade datasets such as GDP and population forecasts, bilateral import–export flows, tariff structures, elasticity differentials between developed and developing economies, geographic distance, and import demand projections. Using weighted trade values from 2020–2024 as the base period to project country-to-country export potential for 2030, these inputs are operationalized through calculated drivers such as gravity model parameters, tariff impact factors, and projected GDP per-capita growth. Through an analysis of hidden potentials, demand hotspots, and market conditions that are most favorable to success, this method enables firms to focus on target countries, maximize returns, and global expansion with data, backed by accuracy.
By factoring in the projected importer demand gap that is currently unmet and could be potential opportunity, it identifies the potential for the Exporter (Country) among 190 countries, against the general trade analysis, which identifies the biggest importer or exporter.
To discover high-growth global markets and optimize your business strategy:
Click Here
Pricing
- Single User License$ 1,995
- Department License$ 2,400
- Site License$ 3,120
- Global License$ 3,795

Leadership Perspectives from Industry Events
Search
Thought Leadership and Analyst Meet


Our Clients
6WResearch In News
- Doha a strategic location for EV manufacturing hub: IPA Qatar
- Demand for luxury TVs surging in the GCC, says Samsung
- Empowering Growth: The Thriving Journey of Bangladesh’s Cable Industry
- Demand for luxury TVs surging in the GCC, says Samsung
- Video call with a traditional healer? Once unthinkable, it’s now common in South Africa
- Intelligent Buildings To Smooth GCC’s Path To Net Zero
Latest Reports
- Taiwan Airport Wireless Infrastructure Market (2026-2032)
- Vietnam Airport Wireless Infrastructure Market (2026-2032)
- Thailand Airport Wireless Infrastructure Market (2026-2032)
- South Korea Airport Wireless Infrastructure Market (2026-2032)
- Romania Airport Wireless Infrastructure Market (2026-2032)
- Qatar Airport Wireless Infrastructure Market (2026-2032)
- Philippines Airport Wireless Infrastructure Market (2026-2032)
- Japan Airport Wireless Infrastructure Market (2026-2032)
- Taiwan Airport Winter Services Market (2026-2032)
- Vietnam Airport Winter Services Market (2026-2032)
Industry Events and Analyst Meet

HIMTEX 2026

India Refining Summit 2026

India EV Show 2026

EV tech India Expo 2026

Auto Tech Asia 2026
Whitepaper
- Middle East & Africa Commercial Security Market Click here to view more.
- Middle East & Africa Fire Safety Systems & Equipment Market Click here to view more.
- GCC Drone Market Click here to view more.
- Middle East Lighting Fixture Market Click here to view more.
- GCC Physical & Perimeter Security Market Click here to view more.