Finland Vanadium compounds Market (2026-2032) | Forecast, Companies, Outlook, Revenue, Analysis, Share, Trends, Value, Industry, Size, Growth & Segmentation
Market Forecast By Application (Chemical Catalysts, Pharmaceuticals, Pigments, Glaze) And Competitive Landscape
| Product Code: ETC4811443 | Publication Date: Nov 2023 | Updated Date: Apr 2026 | Product Type: Market Research Report | |
| Publisher: 6Wresearch | Author: Shubham Padhi | No. of Pages: 60 | No. of Figures: 30 | No. of Tables: 5 |
Finland Vanadium Compounds Market Size (2020-2030)
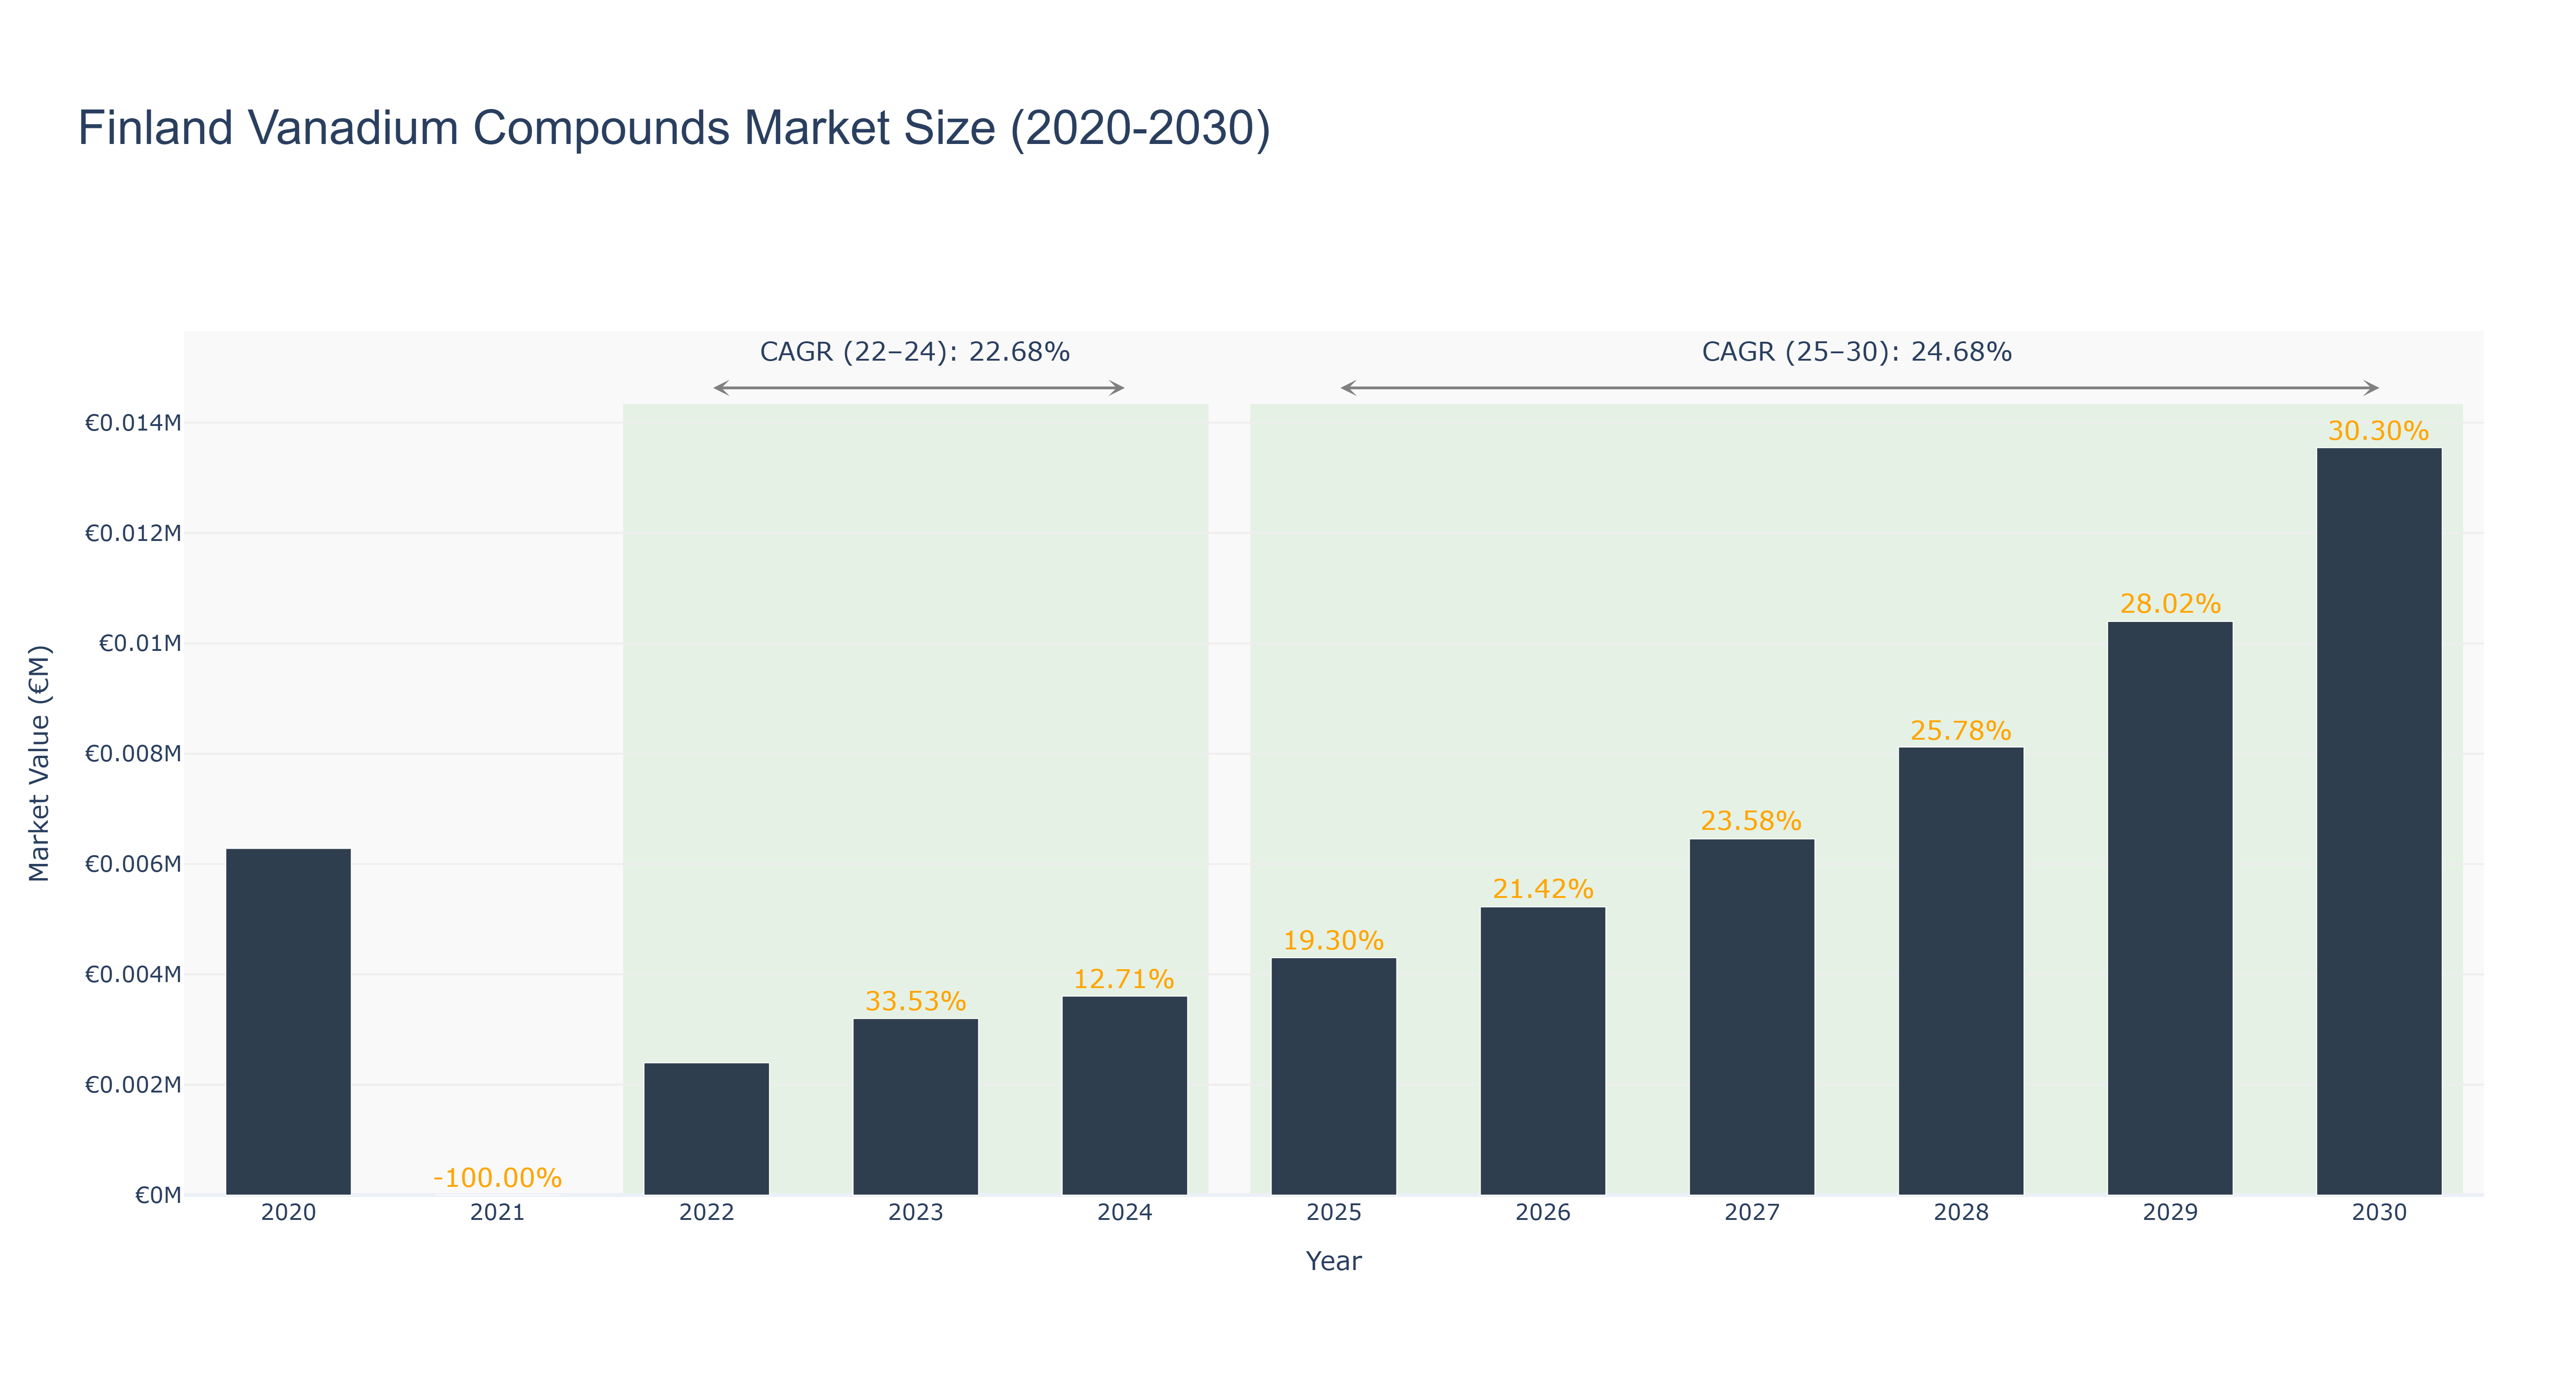
The Finland Vanadium Compounds Market is on a positive trajectory, recovering from a significant downturn in 2021, where market size plummeted by 100% to €2.40 thousand in 2022. The market has since rebounded, reaching €3.20 thousand in 2023 and further growing to €3.61 thousand in 2024, reflecting an actual CAGR of 22.68% from 2022 to 2024. Looking ahead, the forecasted period from 2025 to 2030 indicates robust growth, with projected market sizes increasing from €4.30 thousand in 2025 to €13.55 thousand by 2030, representing a CAGR of 24.68%. Key drivers for this growth include increasing demand for vanadium in battery storage applications and renewable energy technologies. Additionally, ongoing investments in sustainable energy projects in Finland are expected to fuel further market expansion, positioning the country as a significant player in the global vanadium compounds sector.
Finland Vanadium Compounds Market: Production & Trade Performance (2019-2025)
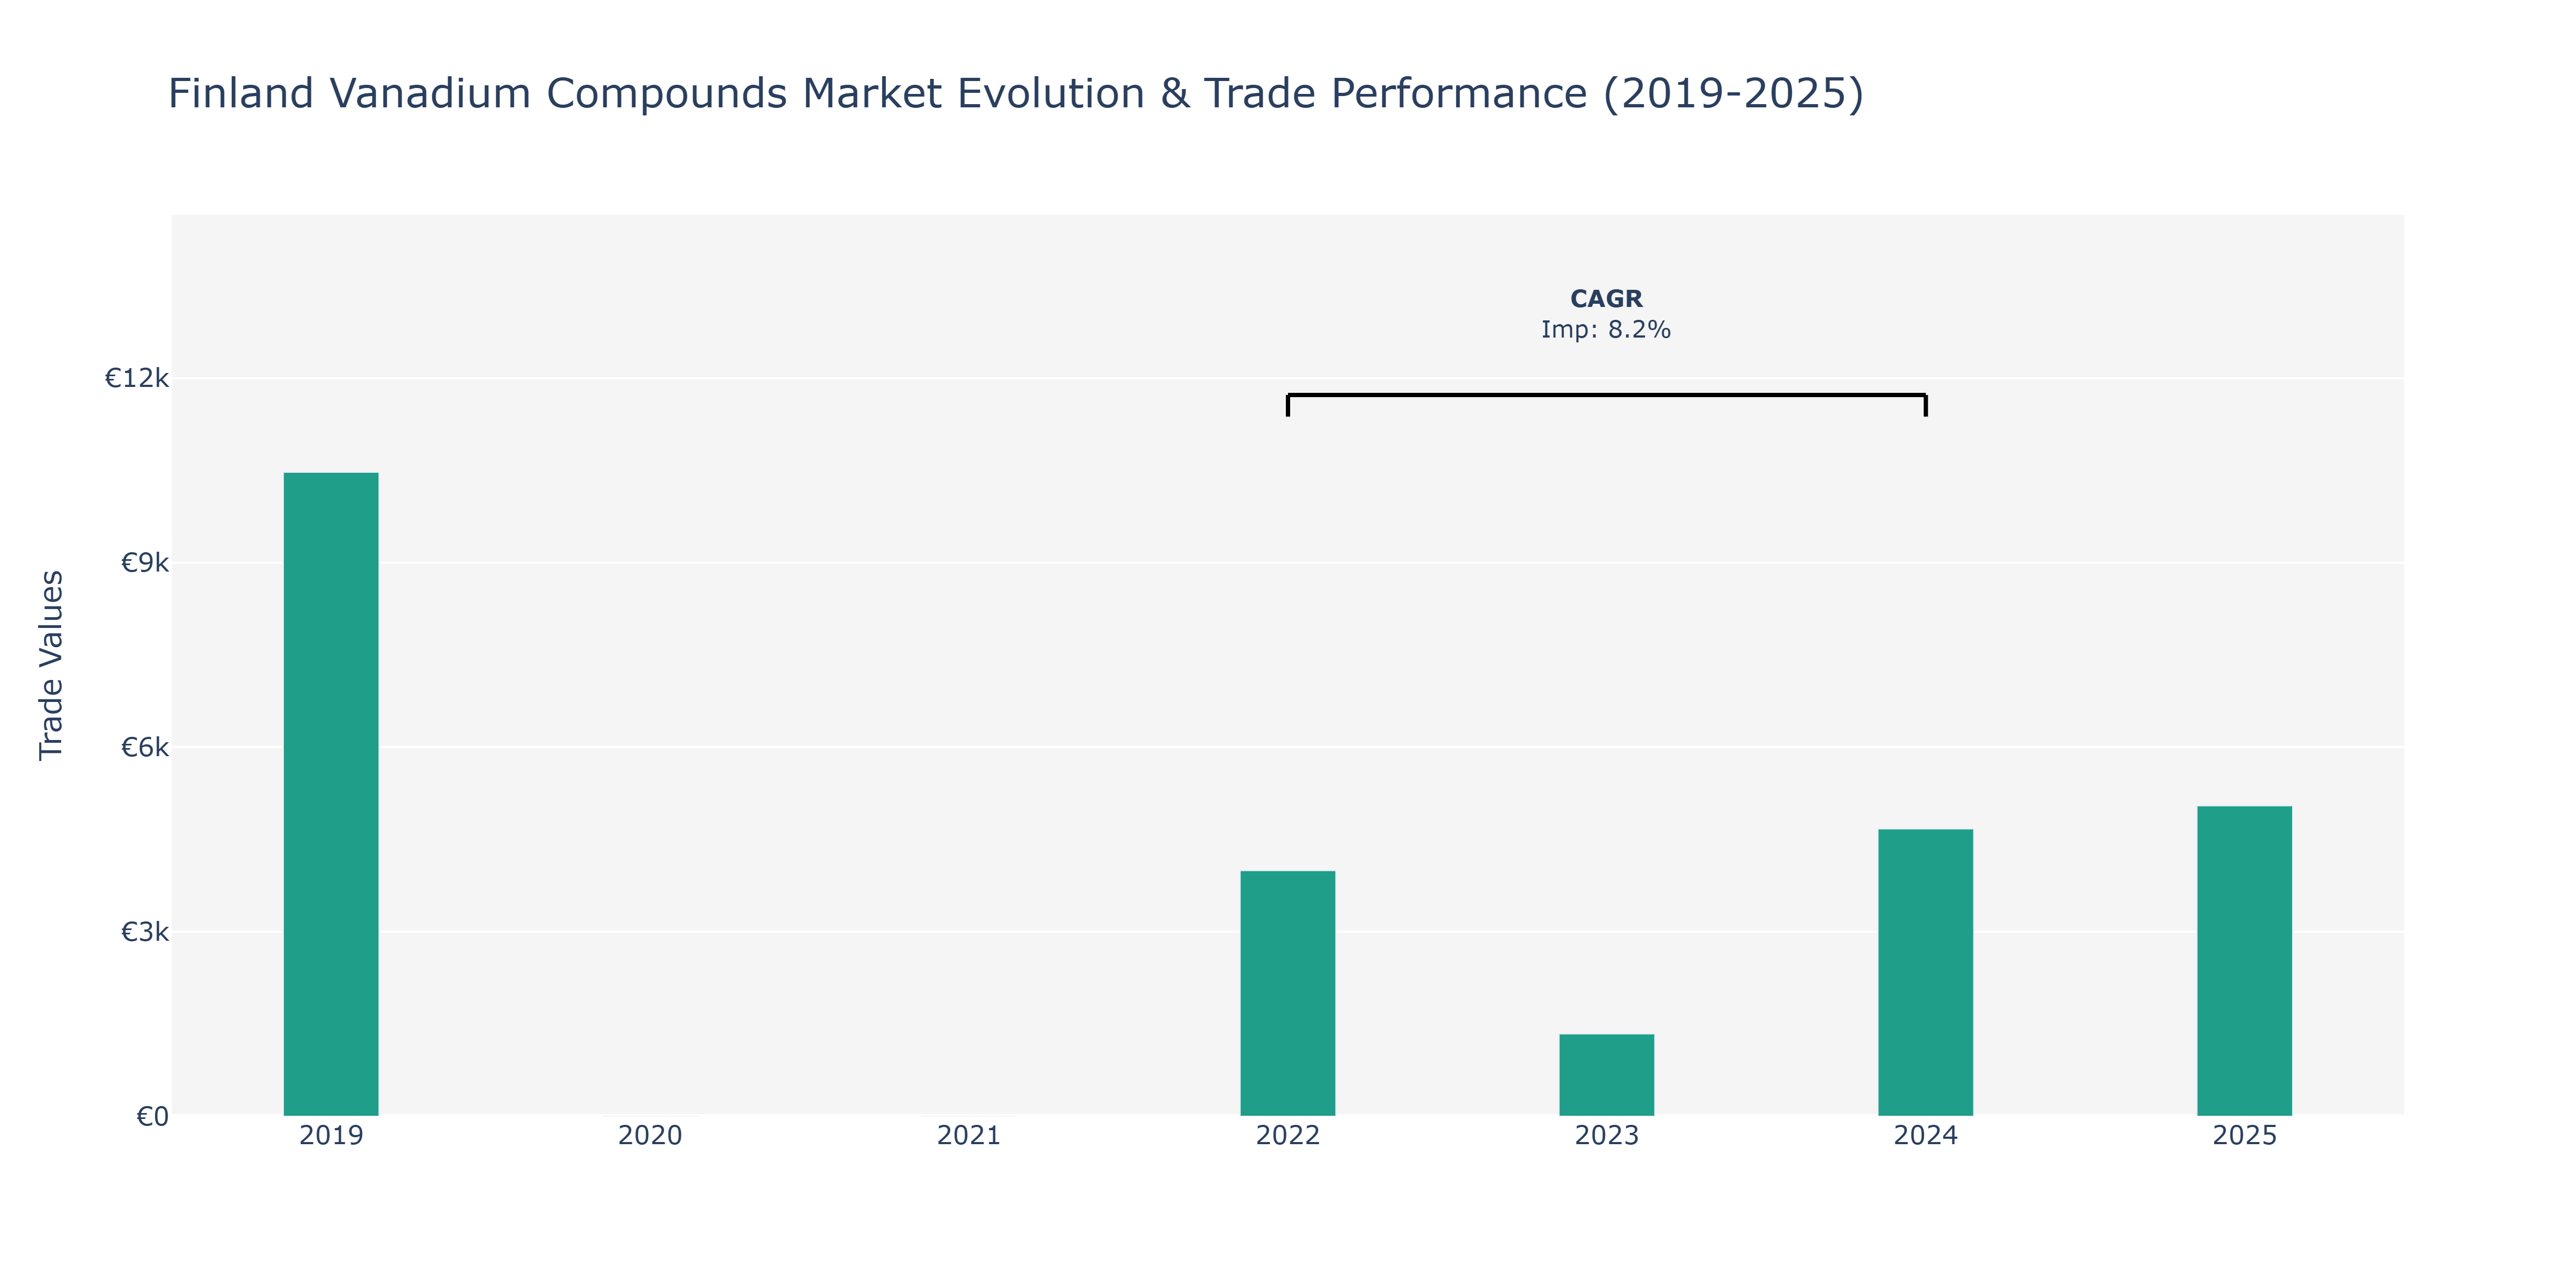
Between 2019 and 2025, Finland's Vanadium Compounds Market witnessed notable fluctuations in imports. In 2019, imports stood at €10.47 thousand, showcasing a considerable decrease to €3.99 thousand in 2022. This steep decline could be attributed to various factors such as changing market dynamics, shifts in demand, or alterations in trade policies. However, by 2023, imports plummeted further to €1.34 thousand, marking a significant downturn. The subsequent years saw a gradual recovery with imports reaching €4.67 thousand in 2024 and slightly increasing to around €5.05 thousand in 2025. These fluctuations could be influenced by global economic conditions, changes in supply chains, or advancements in alternative technologies. The observed trends highlight the market's responsiveness to external factors, necessitating strategic planning and adaptability within the industry to navigate through uncertainties and leverage potential growth opportunities.
Key Highlights of the Report:
- Finland Vanadium compounds Market Outlook
- Market Size of Finland Vanadium compounds Market, 2025
- Forecast of Finland Vanadium compounds Market, 2032
- Historical Data and Forecast of Finland Vanadium compounds Revenues & Volume for the Period 2022 - 2032F
- Finland Vanadium compounds Market Trend Evolution
- Finland Vanadium compounds Market Drivers and Challenges
- Finland Vanadium compounds Price Trends
- Finland Vanadium compounds Porter`s Five Forces
- Finland Vanadium compounds Industry Life Cycle
- Historical Data and Forecast of Finland Vanadium compounds Market Revenues & Volume By Application for the Period 2022 - 2032F
- Historical Data and Forecast of Finland Vanadium compounds Market Revenues & Volume By Chemical Catalysts for the Period 2022 - 2032F
- Historical Data and Forecast of Finland Vanadium compounds Market Revenues & Volume By Pharmaceuticals for the Period 2022 - 2032F
- Historical Data and Forecast of Finland Vanadium compounds Market Revenues & Volume By Pigments for the Period 2022 - 2032F
- Historical Data and Forecast of Finland Vanadium compounds Market Revenues & Volume By Glaze for the Period 2022 - 2032F
- Finland Vanadium compounds Import Export Trade Statistics
- Market Opportunity Assessment By Application
- Finland Vanadium compounds Top Companies Market Share
- Finland Vanadium compounds Competitive Benchmarking By Technical and Operational Parameters
- Finland Vanadium compounds Company Profiles
- Finland Vanadium compounds Key Strategic Recommendations
Frequently Asked Questions About the Market Study (FAQs):
6Wresearch actively monitors the Finland Vanadium compounds Market and publishes its comprehensive annual report, highlighting emerging trends, growth drivers, revenue analysis, and forecast outlook. Our insights help businesses to make data-backed strategic decisions with ongoing market dynamics. Our analysts track relevent industries related to the Finland Vanadium compounds Market, allowing our clients with actionable intelligence and reliable forecasts tailored to emerging regional needs.
Yes, we provide customisation as per your requirements. To learn more, feel free to contact us on sales@6wresearch.com
1 Executive Summary |
2 Introduction |
2.1 Key Highlights of the Report |
2.2 Report Description |
2.3 Market Scope & Segmentation |
2.4 Research Methodology |
2.5 Assumptions |
3 Finland Vanadium compounds Market Overview |
3.1 Finland Country Macro Economic Indicators |
3.2 Finland Vanadium compounds Market Revenues & Volume, 2022 & 2032F |
3.3 Finland Vanadium compounds Market - Industry Life Cycle |
3.4 Finland Vanadium compounds Market - Porter's Five Forces |
3.5 Finland Vanadium compounds Market Revenues & Volume Share, By Application, 2022 & 2032F |
4 Finland Vanadium compounds Market Dynamics |
4.1 Impact Analysis |
4.2 Market Drivers |
4.2.1 Increasing demand for energy storage solutions utilizing vanadium compounds |
4.2.2 Growing adoption of vanadium compounds in steel production for strengthening and reducing weight |
4.2.3 Favorable government regulations promoting the use of vanadium compounds in various industries |
4.3 Market Restraints |
4.3.1 Volatility in vanadium prices due to fluctuations in supply and demand |
4.3.2 High production costs associated with refining and processing vanadium compounds |
4.3.3 Environmental concerns related to the extraction and processing of vanadium |
5 Finland Vanadium compounds Market Trends |
6 Finland Vanadium compounds Market Segmentations |
6.1 Finland Vanadium compounds Market, By Application |
6.1.1 Overview and Analysis |
6.1.2 Finland Vanadium compounds Market Revenues & Volume, By Chemical Catalysts, 2022 - 2032F |
6.1.3 Finland Vanadium compounds Market Revenues & Volume, By Pharmaceuticals, 2022 - 2032F |
6.1.4 Finland Vanadium compounds Market Revenues & Volume, By Pigments, 2022 - 2032F |
6.1.5 Finland Vanadium compounds Market Revenues & Volume, By Glaze, 2022 - 2032F |
7 Finland Vanadium compounds Market Import-Export Trade Statistics |
7.1 Finland Vanadium compounds Market Export to Major Countries |
7.2 Finland Vanadium compounds Market Imports from Major Countries |
8 Finland Vanadium compounds Market Key Performance Indicators |
8.1 Research and development investment in vanadium compound technologies |
8.2 Number of new applications utilizing vanadium compounds |
8.3 Adoption rate of vanadium compounds in key industries |
8.4 Regulatory changes impacting the usage of vanadium compounds |
9 Finland Vanadium compounds Market - Opportunity Assessment |
9.1 Finland Vanadium compounds Market Opportunity Assessment, By Application, 2022 & 2032F |
10 Finland Vanadium compounds Market - Competitive Landscape |
10.1 Finland Vanadium compounds Market Revenue Share, By Companies, 2025 |
10.2 Finland Vanadium compounds Market Competitive Benchmarking, By Operating and Technical Parameters |
11 Company Profiles |
12 Recommendations | 13 Disclaimer |
Global Go To Market Strategy - 2030
Export potential enables firms to identify high-growth global markets with greater confidence by combining advanced trade intelligence with a structured quantitative methodology. The framework analyzes emerging demand trends and country-level import patterns while integrating macroeconomic and trade datasets such as GDP and population forecasts, bilateral import–export flows, tariff structures, elasticity differentials between developed and developing economies, geographic distance, and import demand projections. Using weighted trade values from 2020–2024 as the base period to project country-to-country export potential for 2030, these inputs are operationalized through calculated drivers such as gravity model parameters, tariff impact factors, and projected GDP per-capita growth. Through an analysis of hidden potentials, demand hotspots, and market conditions that are most favorable to success, this method enables firms to focus on target countries, maximize returns, and global expansion with data, backed by accuracy.
By factoring in the projected importer demand gap that is currently unmet and could be potential opportunity, it identifies the potential for the Exporter (Country) among 190 countries, against the general trade analysis, which identifies the biggest importer or exporter.
To discover high-growth global markets and optimize your business strategy:
Click Here
Pricing
- Single User License$ 1,995
- Department License$ 2,400
- Site License$ 3,120
- Global License$ 3,795

Leadership Perspectives from Industry Events
Search
Thought Leadership and Analyst Meet


Our Clients
6WResearch In News
- Doha a strategic location for EV manufacturing hub: IPA Qatar
- Demand for luxury TVs surging in the GCC, says Samsung
- Empowering Growth: The Thriving Journey of Bangladesh’s Cable Industry
- Demand for luxury TVs surging in the GCC, says Samsung
- Video call with a traditional healer? Once unthinkable, it’s now common in South Africa
- Intelligent Buildings To Smooth GCC’s Path To Net Zero
Latest Reports
- Taiwan Airport Wireless Infrastructure Market (2026-2032)
- Vietnam Airport Wireless Infrastructure Market (2026-2032)
- Thailand Airport Wireless Infrastructure Market (2026-2032)
- South Korea Airport Wireless Infrastructure Market (2026-2032)
- Romania Airport Wireless Infrastructure Market (2026-2032)
- Qatar Airport Wireless Infrastructure Market (2026-2032)
- Philippines Airport Wireless Infrastructure Market (2026-2032)
- Japan Airport Wireless Infrastructure Market (2026-2032)
- Taiwan Airport Winter Services Market (2026-2032)
- Vietnam Airport Winter Services Market (2026-2032)
Industry Events and Analyst Meet

HIMTEX 2026

India Refining Summit 2026

India EV Show 2026

EV tech India Expo 2026

Auto Tech Asia 2026
Whitepaper
- Middle East & Africa Commercial Security Market Click here to view more.
- Middle East & Africa Fire Safety Systems & Equipment Market Click here to view more.
- GCC Drone Market Click here to view more.
- Middle East Lighting Fixture Market Click here to view more.
- GCC Physical & Perimeter Security Market Click here to view more.