France Container Fleet Market (2026-2032) | Growth, Value, Size & Revenue, Forecast, Industry, Companies, Competitive Landscape, Share, Analysis, Outlook, Trends, Segmentation
Market Forecast By Product Type (Dry Container, Reefer Container, Brake Fluid) And Competitive Landscape
| Product Code: ETC7216282 | Publication Date: Sep 2024 | Updated Date: Apr 2026 | Product Type: Market Research Report | |
| Publisher: 6Wresearch | Author: Sumit Sagar | No. of Pages: 75 | No. of Figures: 35 | No. of Tables: 20 |
France Container Fleet Market Size (2020-2030)
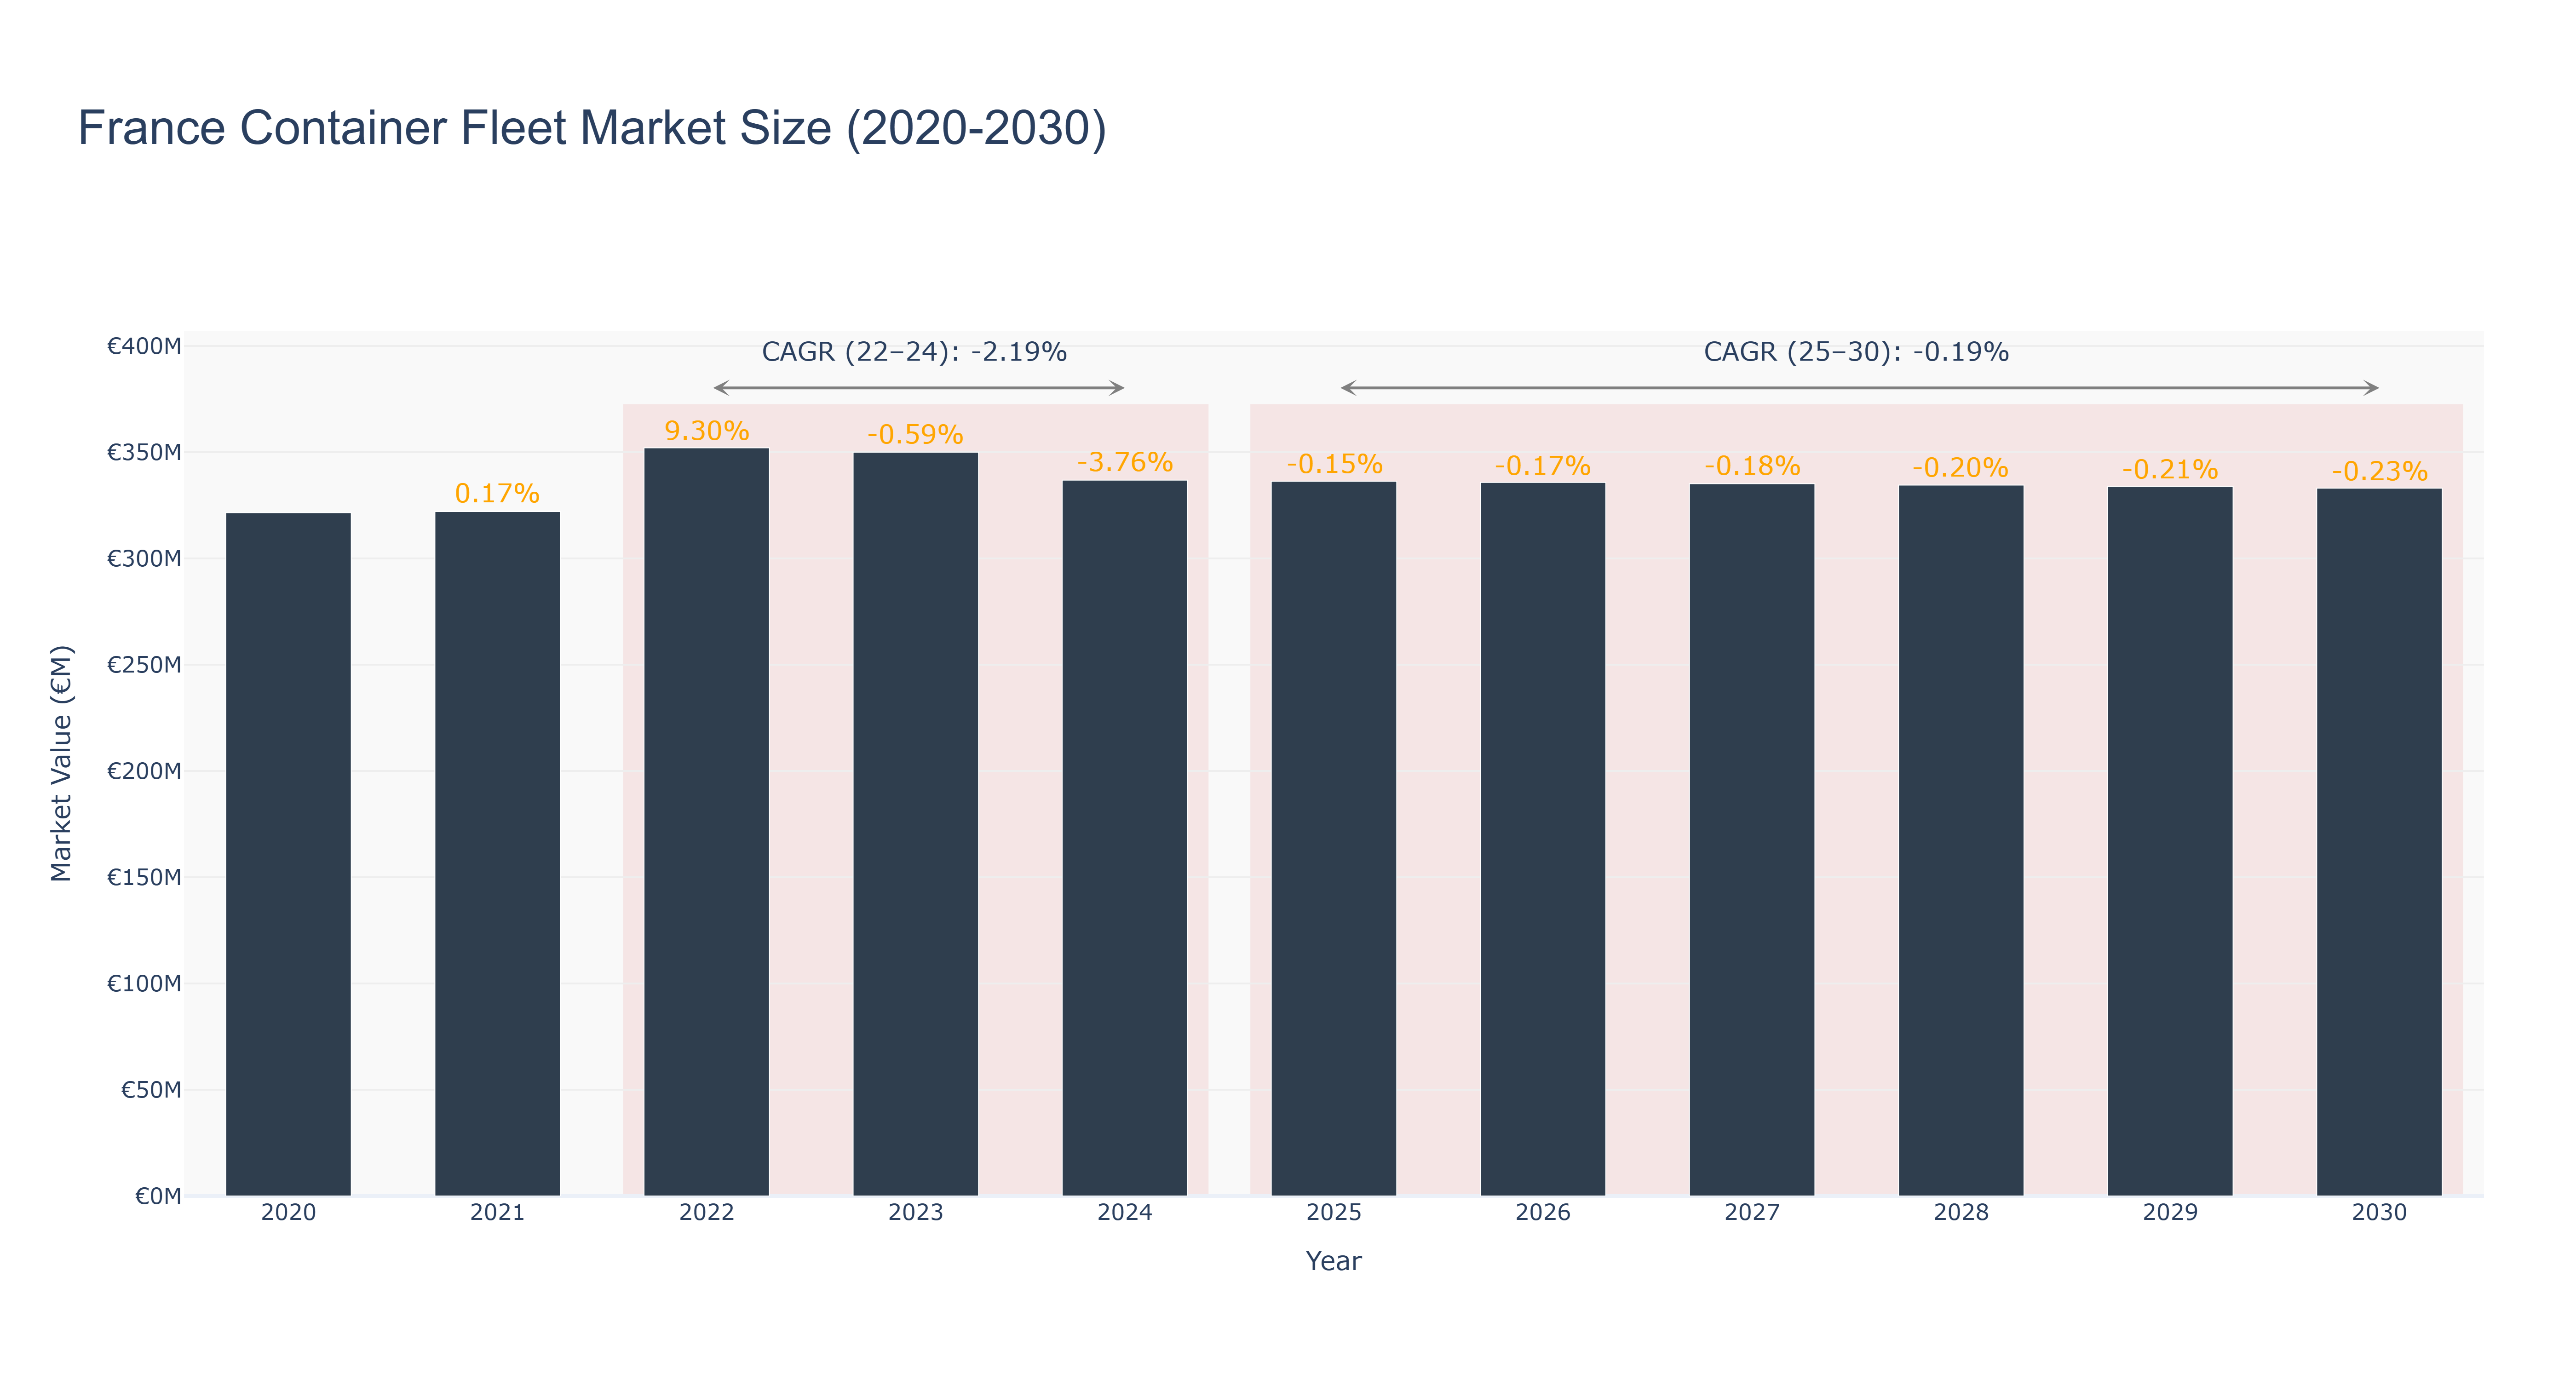
France Container Fleet Market has seen fluctuations in market size over the years. The peak market size of €352.05 million was recorded in 2022, followed by a decline to €336.81 million in 2024. The forecasted market size from 2025 to 2030 shows a downward trend, with an expected market size of €333.02 million in 2030. The CAGR for the period 2022-24 is -2.19%, indicating a decline, while the CAGR for 2025-30 is -0.19%. The market has been impacted by factors such as economic uncertainties, changing consumer preferences, and regulatory challenges. Looking ahead, upcoming investments in sustainable container fleet technologies and digitalization initiatives are expected to drive market growth in the near future, enhancing operational efficiency and reducing environmental impact.
France Container Fleet Market: Production & Trade Performance (2019-2025)
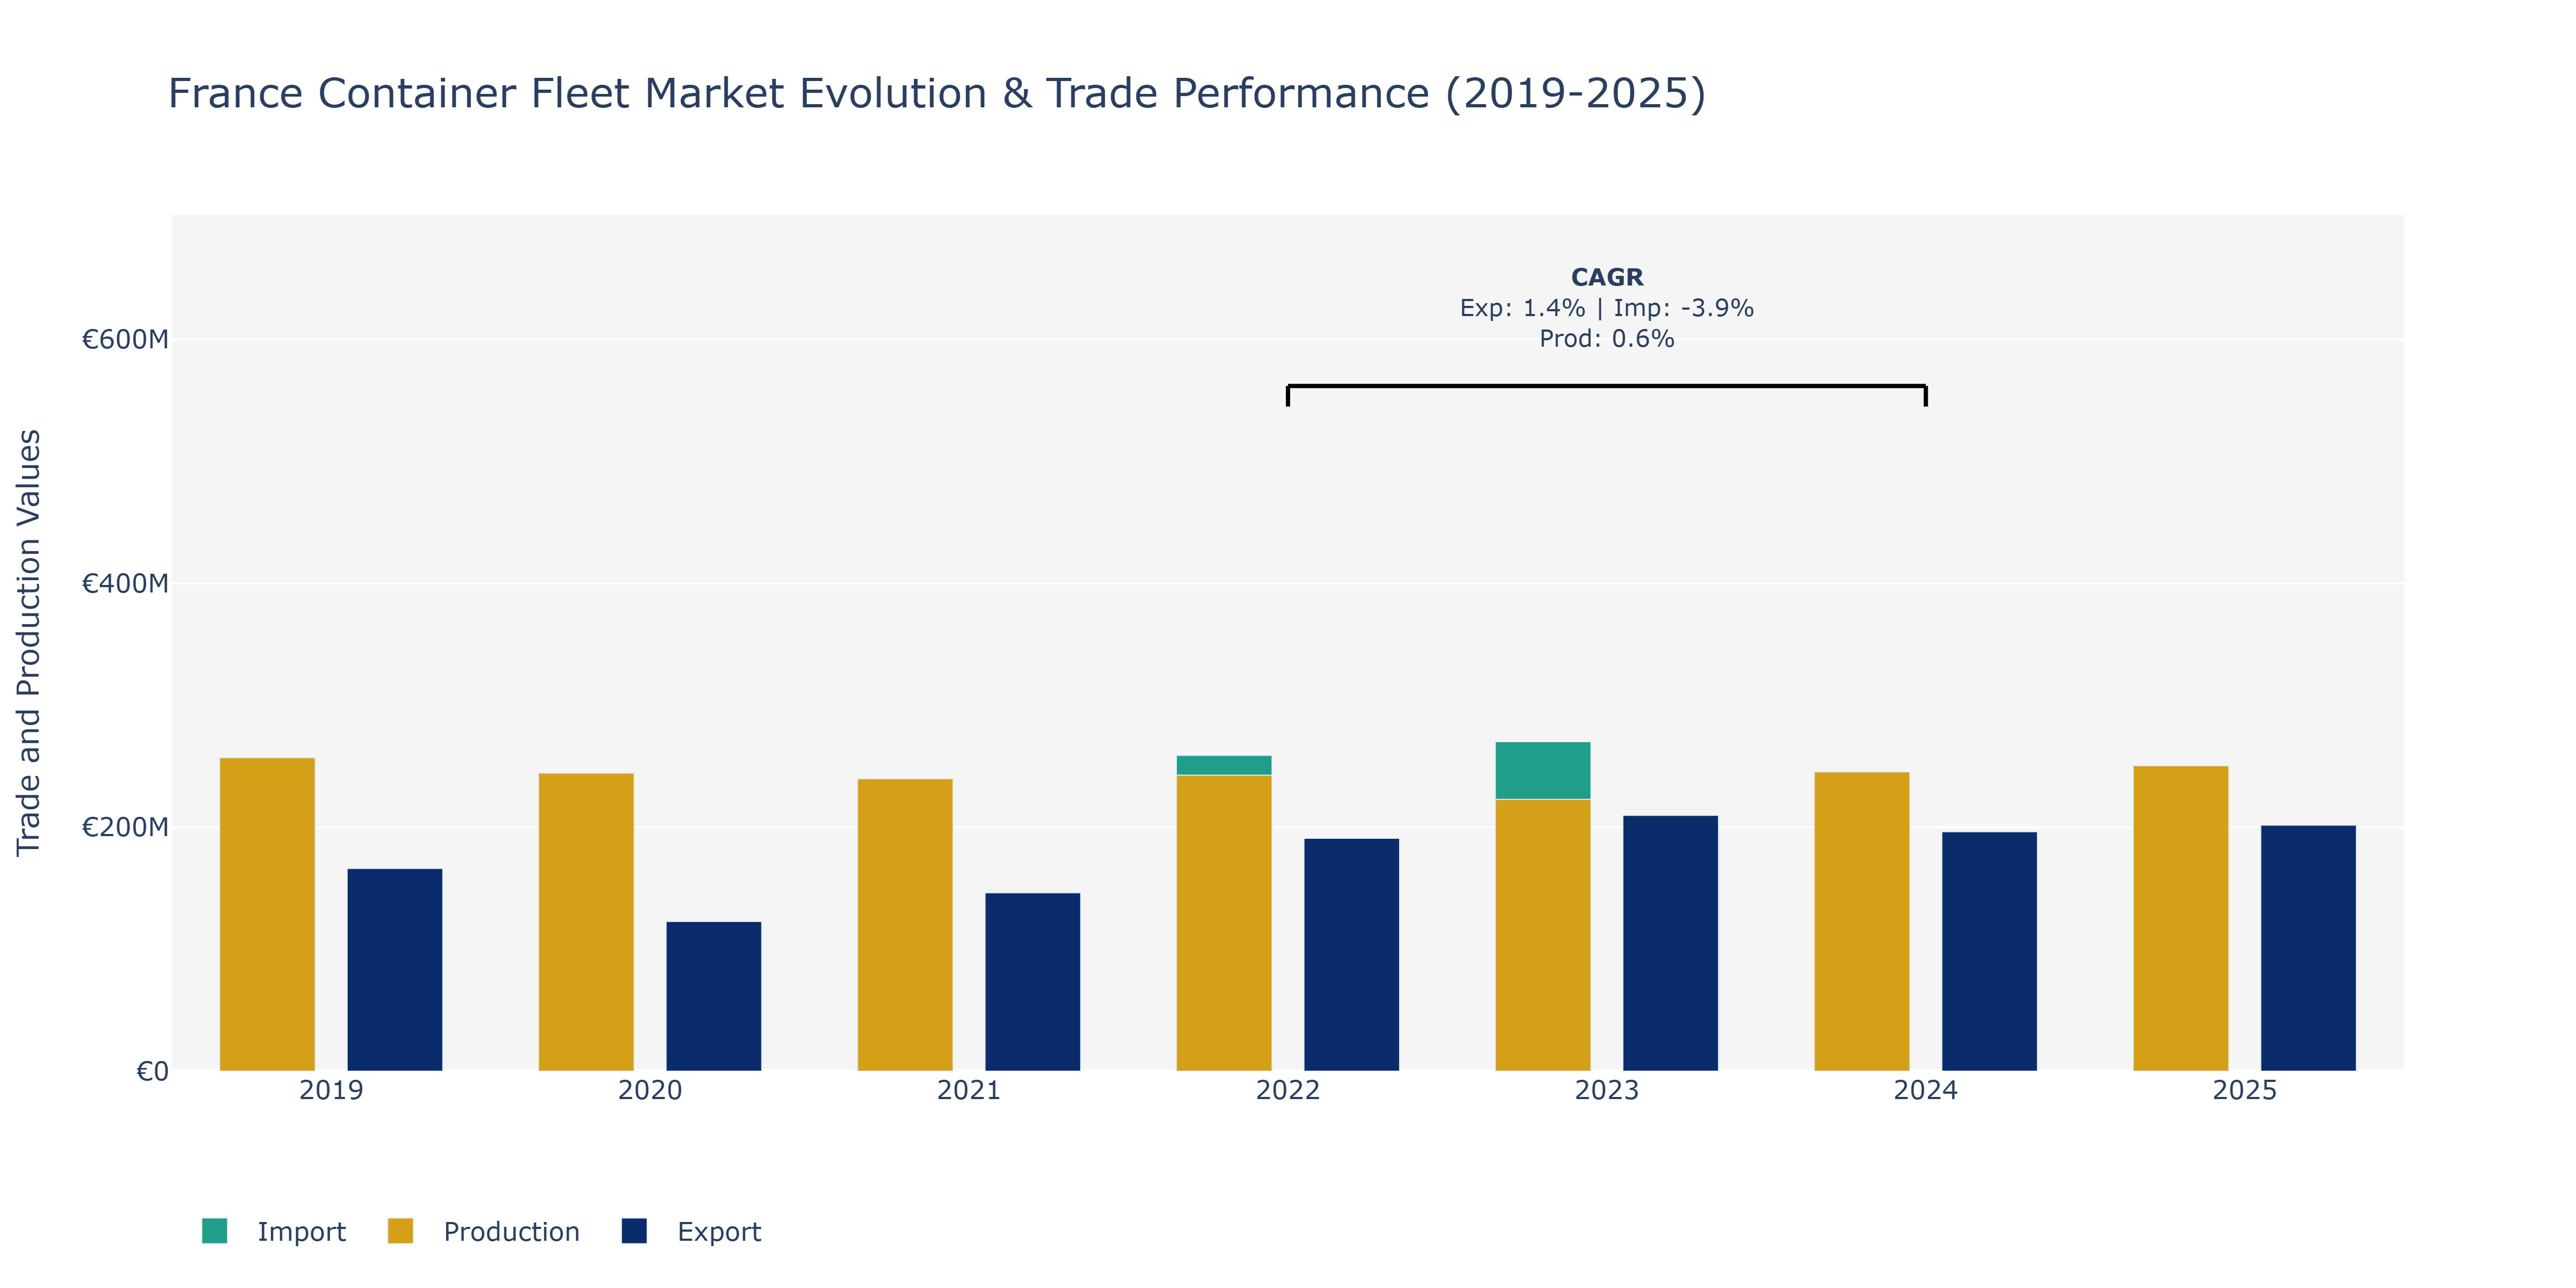
Between 2019 and 2025, France's Container Fleet Market demonstrated various trends in Exports, Imports, and Production. Exports saw a decline from €166.24 million in 2019 to a low of €122.77 million in 2020, followed by a recovery and growth to €201.74 million in 2025. Imports, on the other hand, fluctuated between €150.74 million in 2020 and €270.22 million in 2023, stabilizing at €235.61 million in 2025. Production levels fluctuated but maintained an overall upward trajectory, peaking at €257.12 million in 2019 and reaching €250.54 million in 2025. The fluctuations in imports could be influenced by global economic conditions, trade agreements, and shipping regulations. France's strong manufacturing sector and strategic location could have positively impacted production levels, despite some fluctuations. The growth in exports could be attributed to increased demand for French goods globally and efforts to expand market reach through trade agreements and logistics enhancements.
Key Highlights of the Report:
- France Container Fleet Market Outlook
- Market Size of France Container Fleet Market, 2025
- Forecast of France Container Fleet Market, 2032
- Historical Data and Forecast of France Container Fleet Revenues & Volume for the Period 2022 - 2032
- France Container Fleet Market Trend Evolution
- France Container Fleet Market Drivers and Challenges
- France Container Fleet Price Trends
- France Container Fleet Porter's Five Forces
- France Container Fleet Industry Life Cycle
- Historical Data and Forecast of France Container Fleet Market Revenues & Volume By Product Type for the Period 2022 - 2032
- Historical Data and Forecast of France Container Fleet Market Revenues & Volume By Dry Container for the Period 2022 - 2032
- Historical Data and Forecast of France Container Fleet Market Revenues & Volume By Reefer Container for the Period 2022 - 2032
- Historical Data and Forecast of France Container Fleet Market Revenues & Volume By Brake Fluid for the Period 2022 - 2032
- France Container Fleet Import Export Trade Statistics
- Market Opportunity Assessment By Product Type
- France Container Fleet Top Companies Market Share
- France Container Fleet Competitive Benchmarking By Technical and Operational Parameters
- France Container Fleet Company Profiles
- France Container Fleet Key Strategic Recommendations
Frequently Asked Questions About the Market Study (FAQs):
6Wresearch actively monitors the France Container Fleet Market and publishes its comprehensive annual report, highlighting emerging trends, growth drivers, revenue analysis, and forecast outlook. Our insights help businesses to make data-backed strategic decisions with ongoing market dynamics. Our analysts track relevent industries related to the France Container Fleet Market, allowing our clients with actionable intelligence and reliable forecasts tailored to emerging regional needs.
Yes, we provide customisation as per your requirements. To learn more, feel free to contact us on sales@6wresearch.com
1 Executive Summary |
2 Introduction |
2.1 Key Highlights of the Report |
2.2 Report Description |
2.3 Market Scope & Segmentation |
2.4 Research Methodology |
2.5 Assumptions |
3 France Container Fleet Market Overview |
3.1 France Country Macro Economic Indicators |
3.2 France Container Fleet Market Revenues & Volume, 2022 & 2032F |
3.3 France Container Fleet Market - Industry Life Cycle |
3.4 France Container Fleet Market - Porter's Five Forces |
3.5 France Container Fleet Market Revenues & Volume Share, By Product Type, 2022 & 2032F |
4 France Container Fleet Market Dynamics |
4.1 Impact Analysis |
4.2 Market Drivers |
4.2.1 Increasing global trade activities leading to higher demand for container shipping services. |
4.2.2 Technological advancements in container fleet management improving efficiency and reducing costs. |
4.2.3 Government initiatives promoting sustainable transportation solutions, leading to the adoption of eco-friendly container fleets. |
4.3 Market Restraints |
4.3.1 Fluctuating fuel prices impacting operational costs of container fleet companies. |
4.3.2 Regulatory challenges and compliance requirements affecting the operations of container fleet providers. |
4.3.3 Economic uncertainties and geopolitical factors influencing trade patterns and demand for container shipping services. |
5 France Container Fleet Market Trends |
6 France Container Fleet Market, By Types |
6.1 France Container Fleet Market, By Product Type |
6.1.1 Overview and Analysis |
6.1.2 France Container Fleet Market Revenues & Volume, By Product Type, 2022 - 2032F |
6.1.3 France Container Fleet Market Revenues & Volume, By Dry Container, 2022 - 2032F |
6.1.4 France Container Fleet Market Revenues & Volume, By Reefer Container, 2022 - 2032F |
6.1.5 France Container Fleet Market Revenues & Volume, By Brake Fluid, 2022 - 2032F |
7 France Container Fleet Market Import-Export Trade Statistics |
7.1 France Container Fleet Market Export to Major Countries |
7.2 France Container Fleet Market Imports from Major Countries |
8 France Container Fleet Market Key Performance Indicators |
8.1 Average fleet age: Lower average fleet age indicates modernization and efficiency in the container fleet market. |
8.2 Fleet utilization rate: Higher utilization rate signifies effective management of container assets. |
8.3 Carbon footprint reduction: Tracking the reduction in carbon emissions per container mile as a measure of sustainability efforts. |
9 France Container Fleet Market - Opportunity Assessment |
9.1 France Container Fleet Market Opportunity Assessment, By Product Type, 2022 & 2032F |
10 France Container Fleet Market - Competitive Landscape |
10.1 France Container Fleet Market Revenue Share, By Companies, 2025 |
10.2 France Container Fleet Market Competitive Benchmarking, By Operating and Technical Parameters |
11 Company Profiles |
12 Recommendations |
13 Disclaimer |
Global Go To Market Strategy - 2030
Export potential enables firms to identify high-growth global markets with greater confidence by combining advanced trade intelligence with a structured quantitative methodology. The framework analyzes emerging demand trends and country-level import patterns while integrating macroeconomic and trade datasets such as GDP and population forecasts, bilateral import–export flows, tariff structures, elasticity differentials between developed and developing economies, geographic distance, and import demand projections. Using weighted trade values from 2020–2024 as the base period to project country-to-country export potential for 2030, these inputs are operationalized through calculated drivers such as gravity model parameters, tariff impact factors, and projected GDP per-capita growth. Through an analysis of hidden potentials, demand hotspots, and market conditions that are most favorable to success, this method enables firms to focus on target countries, maximize returns, and global expansion with data, backed by accuracy.
By factoring in the projected importer demand gap that is currently unmet and could be potential opportunity, it identifies the potential for the Exporter (Country) among 190 countries, against the general trade analysis, which identifies the biggest importer or exporter.
To discover high-growth global markets and optimize your business strategy:
Click Here
Pricing
- Single User License$ 1,995
- Department License$ 2,400
- Site License$ 3,120
- Global License$ 3,795

Leadership Perspectives from Industry Events
Search
Thought Leadership and Analyst Meet


Our Clients
6WResearch In News
- India Air Conditioner Market Set for Strong Rebound in 2026 After Weather-Led Correction and GST-Driven Recovery: 6Wresearch
- ADAS in India: How Automatic Emergency Braking, Blind Spot Detection & Driver Monitoring are Transforming Road Safety
- Doha a strategic location for EV manufacturing hub: IPA Qatar
- Demand for luxury TVs surging in the GCC, says Samsung
- Empowering Growth: The Thriving Journey of Bangladesh’s Cable Industry
- Demand for luxury TVs surging in the GCC, says Samsung
Latest Reports
- Poland Fire Protection Systems Market (2026-2032)
- Cape Verde Portable Hand-Thrown Extinguisher Market (2026-2032)
- Canada Portable Hand-Thrown Extinguisher Market (2026-2032)
- Cameroon Portable Hand-Thrown Extinguisher Market (2026-2032)
- Burundi Portable Hand-Thrown Extinguisher Market (2026-2032)
- Burkina Faso Portable Hand-Thrown Extinguisher Market (2026-2032)
- Bulgaria Portable Hand-Thrown Extinguisher Market (2026-2032)
- Brunei Portable Hand-Thrown Extinguisher Market (2026-2032)
- Botswana Portable Hand-Thrown Extinguisher Market (2026-2032)
- Bosnia and Herzegovina Portable Hand-Thrown Extinguisher Market (2026-2032)
Industry Events and Analyst Meet

HIMTEX 2026

India Refining Summit 2026

India EV Show 2026

EV tech India Expo 2026

Auto Tech Asia 2026
Whitepaper
- Middle East & Africa Commercial Security Market Click here to view more.
- Middle East & Africa Fire Safety Systems & Equipment Market Click here to view more.
- GCC Drone Market Click here to view more.
- Middle East Lighting Fixture Market Click here to view more.
- GCC Physical & Perimeter Security Market Click here to view more.