France Direct Reduced Iron (DRI) Market (2026-2032) | Companies, Segmentation, Analysis, Outlook, Competitive Landscape, Share, Growth, Industry, Size & Revenue, Value, Forecast, Trends
Market Forecast By Form (Pellets, Lumps), By Production Process (Gas-based, Coal-based), By Grade (Grade A (FeM 81% Min), Grade B (FeM 78 To 80 %), Grade C (FeM < 78%)) And Competitive Landscape
| Product Code: ETC7217321 | Publication Date: Sep 2024 | Updated Date: Apr 2026 | Product Type: Market Research Report | |
| Publisher: 6Wresearch | Author: Sumit Sagar | No. of Pages: 75 | No. of Figures: 35 | No. of Tables: 20 |
France Direct Reduced Iron (Dri) Market Size (2020-2030)
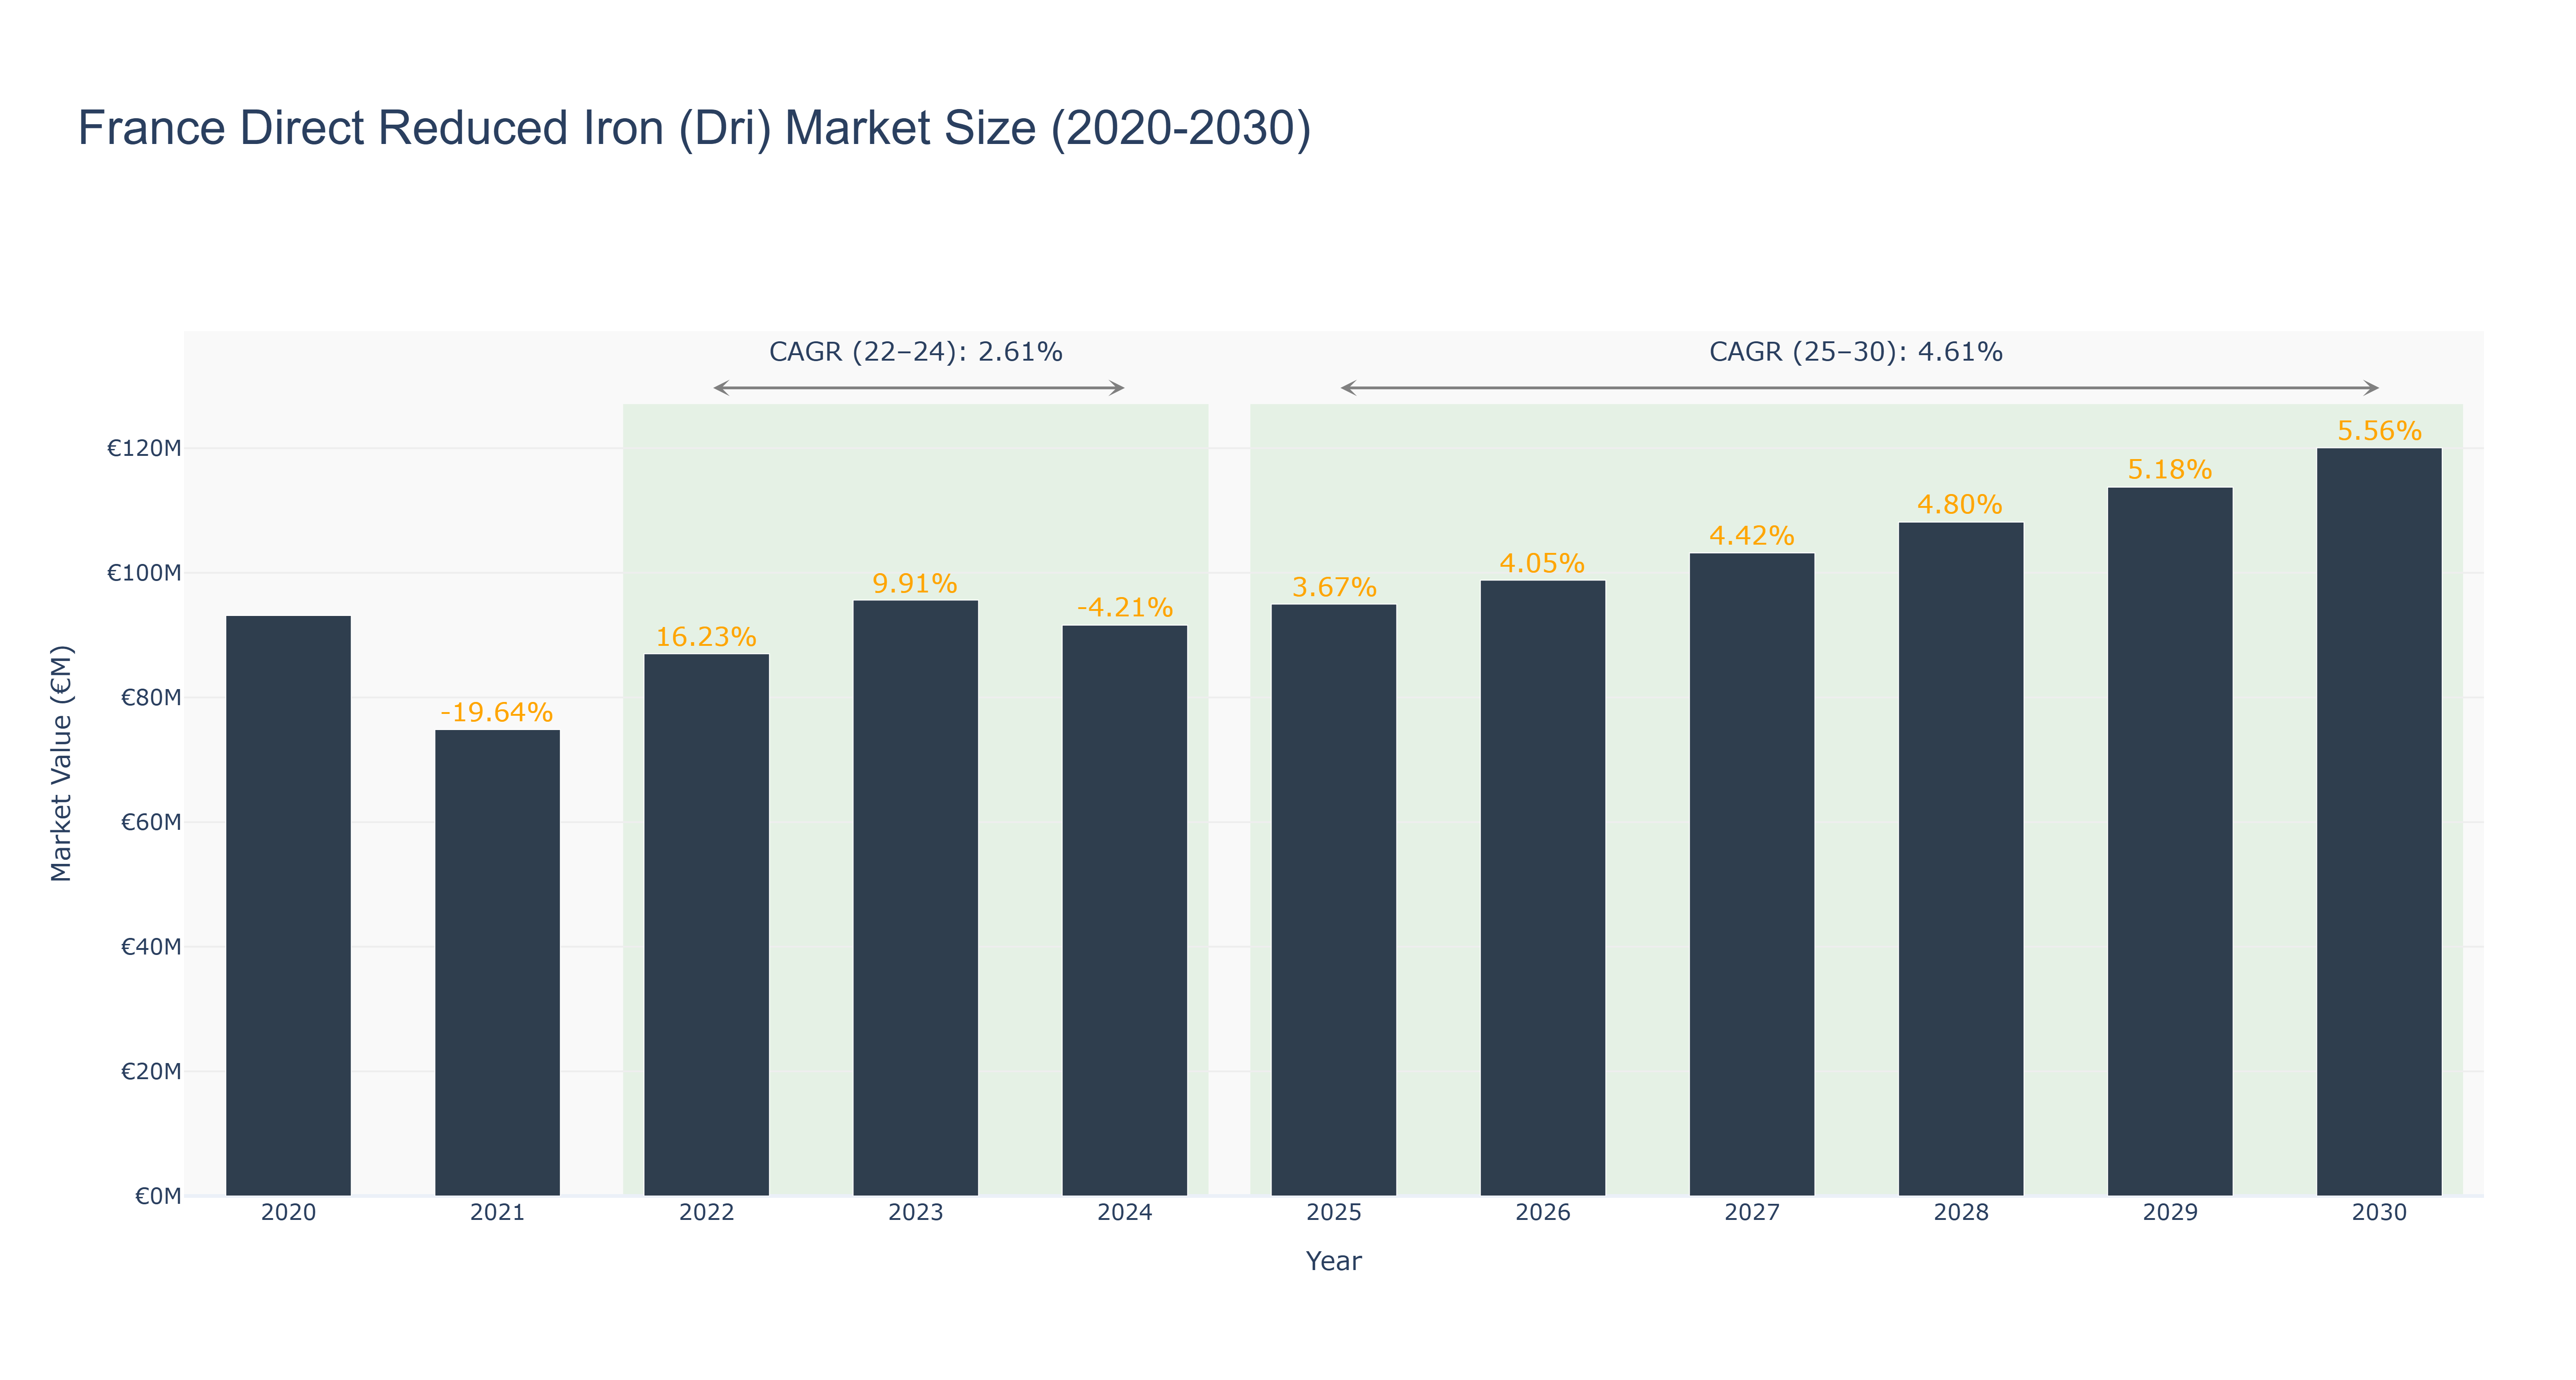
France Direct Reduced Iron (DRI) Market has shown a fluctuating trend over the years. The market peaked in 2030 with a size of €120.07 million, growing steadily at a CAGR of 5.56% from 2025 to 2030. However, from 2020 to 2024, the market experienced a decline in size, hitting its lowest point in 2021 at €74.86 million. The market rebounded in 2022 and continued to grow, driven by increasing demand for DRI in the steel industry. The recent CAGR (2022-24) of 2.61% indicates a moderate growth phase, while the forecasted CAGR (2025-30) of 4.61% suggests a more robust expansion in the coming years. Looking ahead, upcoming infrastructure projects in France, such as the development of new steel plants, are expected to further boost the demand for DRI, supporting the market's growth trajectory.
France Direct Reduced Iron (Dri) Market: Production & Trade Performance (2019-2025)
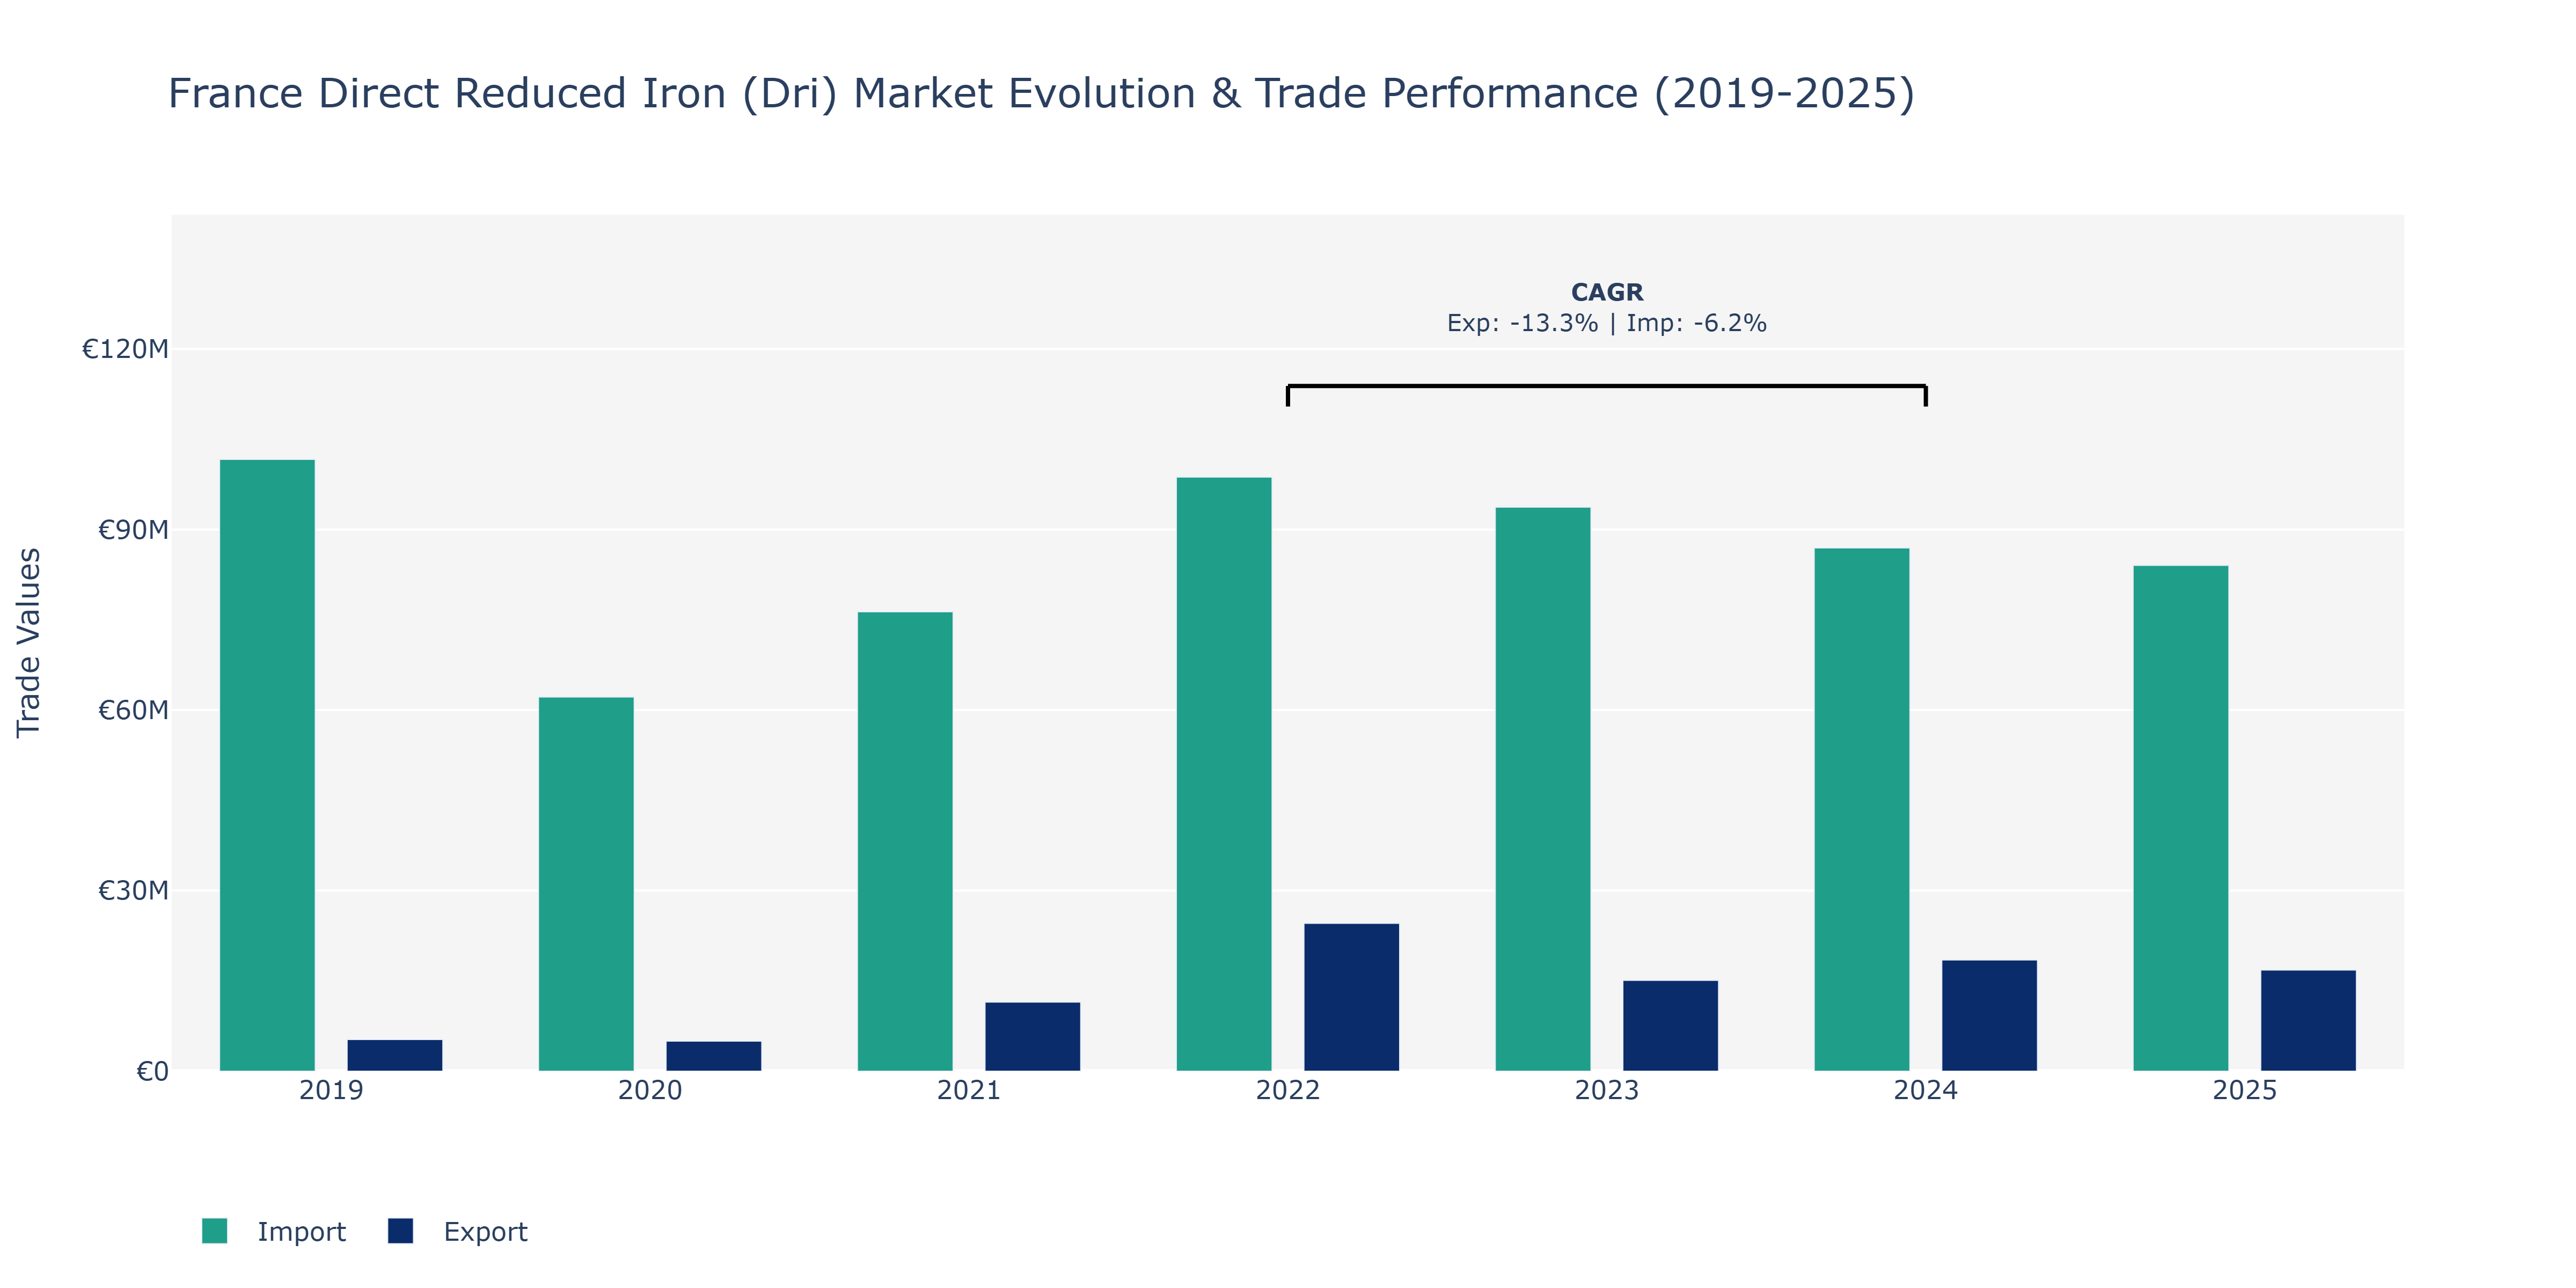
The France Direct Reduced Iron (DRI) market witnessed fluctuations in both exports and imports from 2019 to 2025. In 2019, exports were at €5.26 million and imports at €101.65 million. In 2021, a significant increase in exports to €11.48 million was observed while imports rose to €76.34 million. The peak export value was reached in 2022 at €24.57 million, followed by a slight decline in the following years. Imports peaked in 2022 at €98.72 million and have shown a gradual decrease since then. The fluctuations in exports and imports can be attributed to global market demand, changes in international trade policies, and economic conditions impacting the steel industry. Factors like infrastructure investments, technological advancements, and shifts in global supply chains have influenced the movements in exports and imports of DRI in France.
Key Highlights of the Report:
- France Direct Reduced Iron (DRI) Market Outlook
- Market Size of France Direct Reduced Iron (DRI) Market, 2025
- Forecast of France Direct Reduced Iron (DRI) Market, 2032
- Historical Data and Forecast of France Direct Reduced Iron (DRI) Revenues & Volume for the Period 2022 - 2032
- France Direct Reduced Iron (DRI) Market Trend Evolution
- France Direct Reduced Iron (DRI) Market Drivers and Challenges
- France Direct Reduced Iron (DRI) Price Trends
- France Direct Reduced Iron (DRI) Porter's Five Forces
- France Direct Reduced Iron (DRI) Industry Life Cycle
- Historical Data and Forecast of France Direct Reduced Iron (DRI) Market Revenues & Volume By Form for the Period 2022 - 2032
- Historical Data and Forecast of France Direct Reduced Iron (DRI) Market Revenues & Volume By Pellets for the Period 2022 - 2032
- Historical Data and Forecast of France Direct Reduced Iron (DRI) Market Revenues & Volume By Lumps for the Period 2022 - 2032
- Historical Data and Forecast of France Direct Reduced Iron (DRI) Market Revenues & Volume By Production Process for the Period 2022 - 2032
- Historical Data and Forecast of France Direct Reduced Iron (DRI) Market Revenues & Volume By Gas-based for the Period 2022 - 2032
- Historical Data and Forecast of France Direct Reduced Iron (DRI) Market Revenues & Volume By Coal-based for the Period 2022 - 2032
- Historical Data and Forecast of France Direct Reduced Iron (DRI) Market Revenues & Volume By Grade for the Period 2022 - 2032
- Historical Data and Forecast of France Direct Reduced Iron (DRI) Market Revenues & Volume By Grade A (FeM 81% Min) for the Period 2022 - 2032
- Historical Data and Forecast of France Direct Reduced Iron (DRI) Market Revenues & Volume By Grade B (FeM 78 To 80 %) for the Period 2022 - 2032
- Historical Data and Forecast of France Direct Reduced Iron (DRI) Market Revenues & Volume By Grade C (FeM < 78%) for the Period 2022 - 2032
- France Direct Reduced Iron (DRI) Import Export Trade Statistics
- Market Opportunity Assessment By Form
- Market Opportunity Assessment By Production Process
- Market Opportunity Assessment By Grade
- France Direct Reduced Iron (DRI) Top Companies Market Share
- France Direct Reduced Iron (DRI) Competitive Benchmarking By Technical and Operational Parameters
- France Direct Reduced Iron (DRI) Company Profiles
- France Direct Reduced Iron (DRI) Key Strategic Recommendations
Frequently Asked Questions About the Market Study (FAQs):
6Wresearch actively monitors the France Direct Reduced Iron (DRI) Market and publishes its comprehensive annual report, highlighting emerging trends, growth drivers, revenue analysis, and forecast outlook. Our insights help businesses to make data-backed strategic decisions with ongoing market dynamics. Our analysts track relevent industries related to the France Direct Reduced Iron (DRI) Market, allowing our clients with actionable intelligence and reliable forecasts tailored to emerging regional needs.
Yes, we provide customisation as per your requirements. To learn more, feel free to contact us on sales@6wresearch.com
1 Executive Summary |
2 Introduction |
2.1 Key Highlights of the Report |
2.2 Report Description |
2.3 Market Scope & Segmentation |
2.4 Research Methodology |
2.5 Assumptions |
3 France Direct Reduced Iron (DRI) Market Overview |
3.1 France Country Macro Economic Indicators |
3.2 France Direct Reduced Iron (DRI) Market Revenues & Volume, 2022 & 2032F |
3.3 France Direct Reduced Iron (DRI) Market - Industry Life Cycle |
3.4 France Direct Reduced Iron (DRI) Market - Porter's Five Forces |
3.5 France Direct Reduced Iron (DRI) Market Revenues & Volume Share, By Form, 2022 & 2032F |
3.6 France Direct Reduced Iron (DRI) Market Revenues & Volume Share, By Production Process, 2022 & 2032F |
3.7 France Direct Reduced Iron (DRI) Market Revenues & Volume Share, By Grade, 2022 & 2032F |
4 France Direct Reduced Iron (DRI) Market Dynamics |
4.1 Impact Analysis |
4.2 Market Drivers |
4.2.1 Increasing demand for steel production in France |
4.2.2 Growing focus on sustainable and environmentally friendly steel manufacturing processes |
4.2.3 Government initiatives promoting the use of direct reduced iron (DRI) as a raw material |
4.3 Market Restraints |
4.3.1 Fluctuating raw material prices impacting DRI production costs |
4.3.2 Intense competition from alternative steel production methods |
4.3.3 Regulatory challenges and compliance requirements in the DRI production process |
5 France Direct Reduced Iron (DRI) Market Trends |
6 France Direct Reduced Iron (DRI) Market, By Types |
6.1 France Direct Reduced Iron (DRI) Market, By Form |
6.1.1 Overview and Analysis |
6.1.2 France Direct Reduced Iron (DRI) Market Revenues & Volume, By Form, 2022 - 2032F |
6.1.3 France Direct Reduced Iron (DRI) Market Revenues & Volume, By Pellets, 2022 - 2032F |
6.1.4 France Direct Reduced Iron (DRI) Market Revenues & Volume, By Lumps, 2022 - 2032F |
6.2 France Direct Reduced Iron (DRI) Market, By Production Process |
6.2.1 Overview and Analysis |
6.2.2 France Direct Reduced Iron (DRI) Market Revenues & Volume, By Gas-based, 2022 - 2032F |
6.2.3 France Direct Reduced Iron (DRI) Market Revenues & Volume, By Coal-based, 2022 - 2032F |
6.3 France Direct Reduced Iron (DRI) Market, By Grade |
6.3.1 Overview and Analysis |
6.3.2 France Direct Reduced Iron (DRI) Market Revenues & Volume, By Grade A (FeM 81% Min), 2022 - 2032F |
6.3.3 France Direct Reduced Iron (DRI) Market Revenues & Volume, By Grade B (FeM 78 To 80 %), 2022 - 2032F |
6.3.4 France Direct Reduced Iron (DRI) Market Revenues & Volume, By Grade C (FeM < 78%), 2022 - 2032F |
7 France Direct Reduced Iron (DRI) Market Import-Export Trade Statistics |
7.1 France Direct Reduced Iron (DRI) Market Export to Major Countries |
7.2 France Direct Reduced Iron (DRI) Market Imports from Major Countries |
8 France Direct Reduced Iron (DRI) Market Key Performance Indicators |
8.1 Energy efficiency improvements in DRI production processes |
8.2 Percentage of DRI used in total steel production in France |
8.3 Carbon footprint reduction achieved through DRI utilization |
8.4 Investment in research and development for DRI technology advancements |
8.5 Adoption rate of DRI technology by steel manufacturers in France |
9 France Direct Reduced Iron (DRI) Market - Opportunity Assessment |
9.1 France Direct Reduced Iron (DRI) Market Opportunity Assessment, By Form, 2022 & 2032F |
9.2 France Direct Reduced Iron (DRI) Market Opportunity Assessment, By Production Process, 2022 & 2032F |
9.3 France Direct Reduced Iron (DRI) Market Opportunity Assessment, By Grade, 2022 & 2032F |
10 France Direct Reduced Iron (DRI) Market - Competitive Landscape |
10.1 France Direct Reduced Iron (DRI) Market Revenue Share, By Companies, 2025 |
10.2 France Direct Reduced Iron (DRI) Market Competitive Benchmarking, By Operating and Technical Parameters |
11 Company Profiles |
12 Recommendations |
13 Disclaimer |
Export potential assessment - trade Analytics for 2030
Export potential enables firms to identify high-growth global markets with greater confidence by combining advanced trade intelligence with a structured quantitative methodology. The framework analyzes emerging demand trends and country-level import patterns while integrating macroeconomic and trade datasets such as GDP and population forecasts, bilateral import–export flows, tariff structures, elasticity differentials between developed and developing economies, geographic distance, and import demand projections. Using weighted trade values from 2020–2024 as the base period to project country-to-country export potential for 2030, these inputs are operationalized through calculated drivers such as gravity model parameters, tariff impact factors, and projected GDP per-capita growth. Through an analysis of hidden potentials, demand hotspots, and market conditions that are most favorable to success, this method enables firms to focus on target countries, maximize returns, and global expansion with data, backed by accuracy.
By factoring in the projected importer demand gap that is currently unmet and could be potential opportunity, it identifies the potential for the Exporter (Country) among 190 countries, against the general trade analysis, which identifies the biggest importer or exporter.
To discover high-growth global markets and optimize your business strategy:
Click Here
Pricing
- Single User License$ 1,995
- Department License$ 2,400
- Site License$ 3,120
- Global License$ 3,795

Search
Thought Leadership and Analyst Meet


Our Clients
Latest Reports
- Canada Cloud CFD Market (2026-2032) | Size & Revenue, Industry, Growth, Competitive Landscape, Forecast, Segmentation, Value, Outlook, Trends, Share, Analysis, Companies
- Taiwan Food Delivery Platform Market (2026-2032) | Companies, Outlook, Analysis, Trends, Value, Revenue, Segmentation, Share, Forecast, Competitive Landscape, Growth, Size & Forecast
- United Kingdom (UK) Long-term Care Insurance Market (2026-2032) | Growth, Share, Consumer Insights, Drivers, Opportunities, Competition, Pricing Analysis, Segments, Restraints, Companies, Competitive, Value, Outlook, Size, Demand, Analysis, Challenges, Strategic Insights, Investment Trends, Revenue, Trends, Supply, Forecast
- United Kingdom (UK) Long Term Care Market (2026-2032) | Companies, Outlook, Analysis, Trends, Value, Revenue, Segmentation, Share, Forecast, Competitive Landscape, Growth, Size & Forecast
- Iraq Insulation and Waterproofing Market (2026-2032) | Outlook, Drivers, Growth, Size, Share, Industry, Revenue, Trends, Demand, Competitive, Strategic Insights, Opportunities, Segments, Companies, Challenges, Strategy, Consumer Insights, Analysis, Investment Trends, Value, Segmentation, Forecast, Restraints
- India Switchgear Market Outlook (2026-2032) | Size, Share, Trends, Growth, Revenue, Forecast, Analysis, Value, Outlook
- Pakistan Contraceptive Implants Market (2025-2031) | Demand, Growth, Size, Share, Industry, Pricing Analysis, Competitive, Strategic Insights, Strategy, Consumer Insights, Analysis, Investment Trends, Opportunities, Revenue, Segments, Value, Segmentation, Supply, Forecast, Restraints, Outlook, Competition, Drivers, Trends, Companies, Challenges
- Sri Lanka Packaging Market (2026-2032) | Outlook, Competition, Drivers, Trends, Demand, Pricing Analysis, Competitive, Strategic Insights, Companies, Challenges, Strategy, Consumer Insights, Analysis, Investment Trends, Opportunities, Growth, Size, Share, Industry, Revenue, Segments, Value, Segmentation, Supply, Forecast, Restraints
- India Kids Watches Market (2026-2032) | Strategy, Consumer Insights, Analysis, Investment Trends, Opportunities, Growth, Size, Share, Industry, Revenue, Segments, Value, Segmentation, Supply, Forecast, Restraints, Outlook, Competition, Drivers, Trends, Demand, Pricing Analysis, Competitive, Strategic Insights, Companies, Challenges
- Saudi Arabia Core Assurance Service Market (2025-2031) | Strategy, Consumer Insights, Analysis, Investment Trends, Opportunities, Growth, Size, Share, Industry, Revenue, Segments, Value, Segmentation, Supply, Forecast, Restraints, Outlook, Competition, Drivers, Trends, Demand, Pricing Analysis, Competitive, Strategic Insights, Companies, Challenges
Industry Events and Analyst Meet

India EV Show 2026

EV tech India Expo 2026

Auto Tech Asia 2026

Battery Tech India 2026

Smart Production Solutions Guangzhou 2026
Whitepaper
- Middle East & Africa Commercial Security Market Click here to view more.
- Middle East & Africa Fire Safety Systems & Equipment Market Click here to view more.
- GCC Drone Market Click here to view more.
- Middle East Lighting Fixture Market Click here to view more.
- GCC Physical & Perimeter Security Market Click here to view more.
6WResearch In News
- Doha a strategic location for EV manufacturing hub: IPA Qatar
- Demand for luxury TVs surging in the GCC, says Samsung
- Empowering Growth: The Thriving Journey of Bangladesh’s Cable Industry
- Demand for luxury TVs surging in the GCC, says Samsung
- Video call with a traditional healer? Once unthinkable, it’s now common in South Africa
- Intelligent Buildings To Smooth GCC’s Path To Net Zero