Gambia Microspheres Market (2026-2032) | Size, Segmentation, Companies, Growth, Share, Trends, Analysis, Revenue, Outlook, Industry, Value & Forecast
Market Forecast By Type (Hollow, Solid), By Raw Material (Glass, Ceramic, Fly Ash, Polymer, Metallic), By Application (Construction Composites, Medical Technology, Cosmetics & Personal Care, Automotive, Oil & Gas) And Competitive Landscape
| Product Code: ETC5706117 | Publication Date: Nov 2023 | Updated Date: Mar 2026 | Product Type: Market Research Report | |
| Publisher: 6Wresearch | Author: Sumit Sagar | No. of Pages: 60 | No. of Figures: 30 | No. of Tables: 5 |
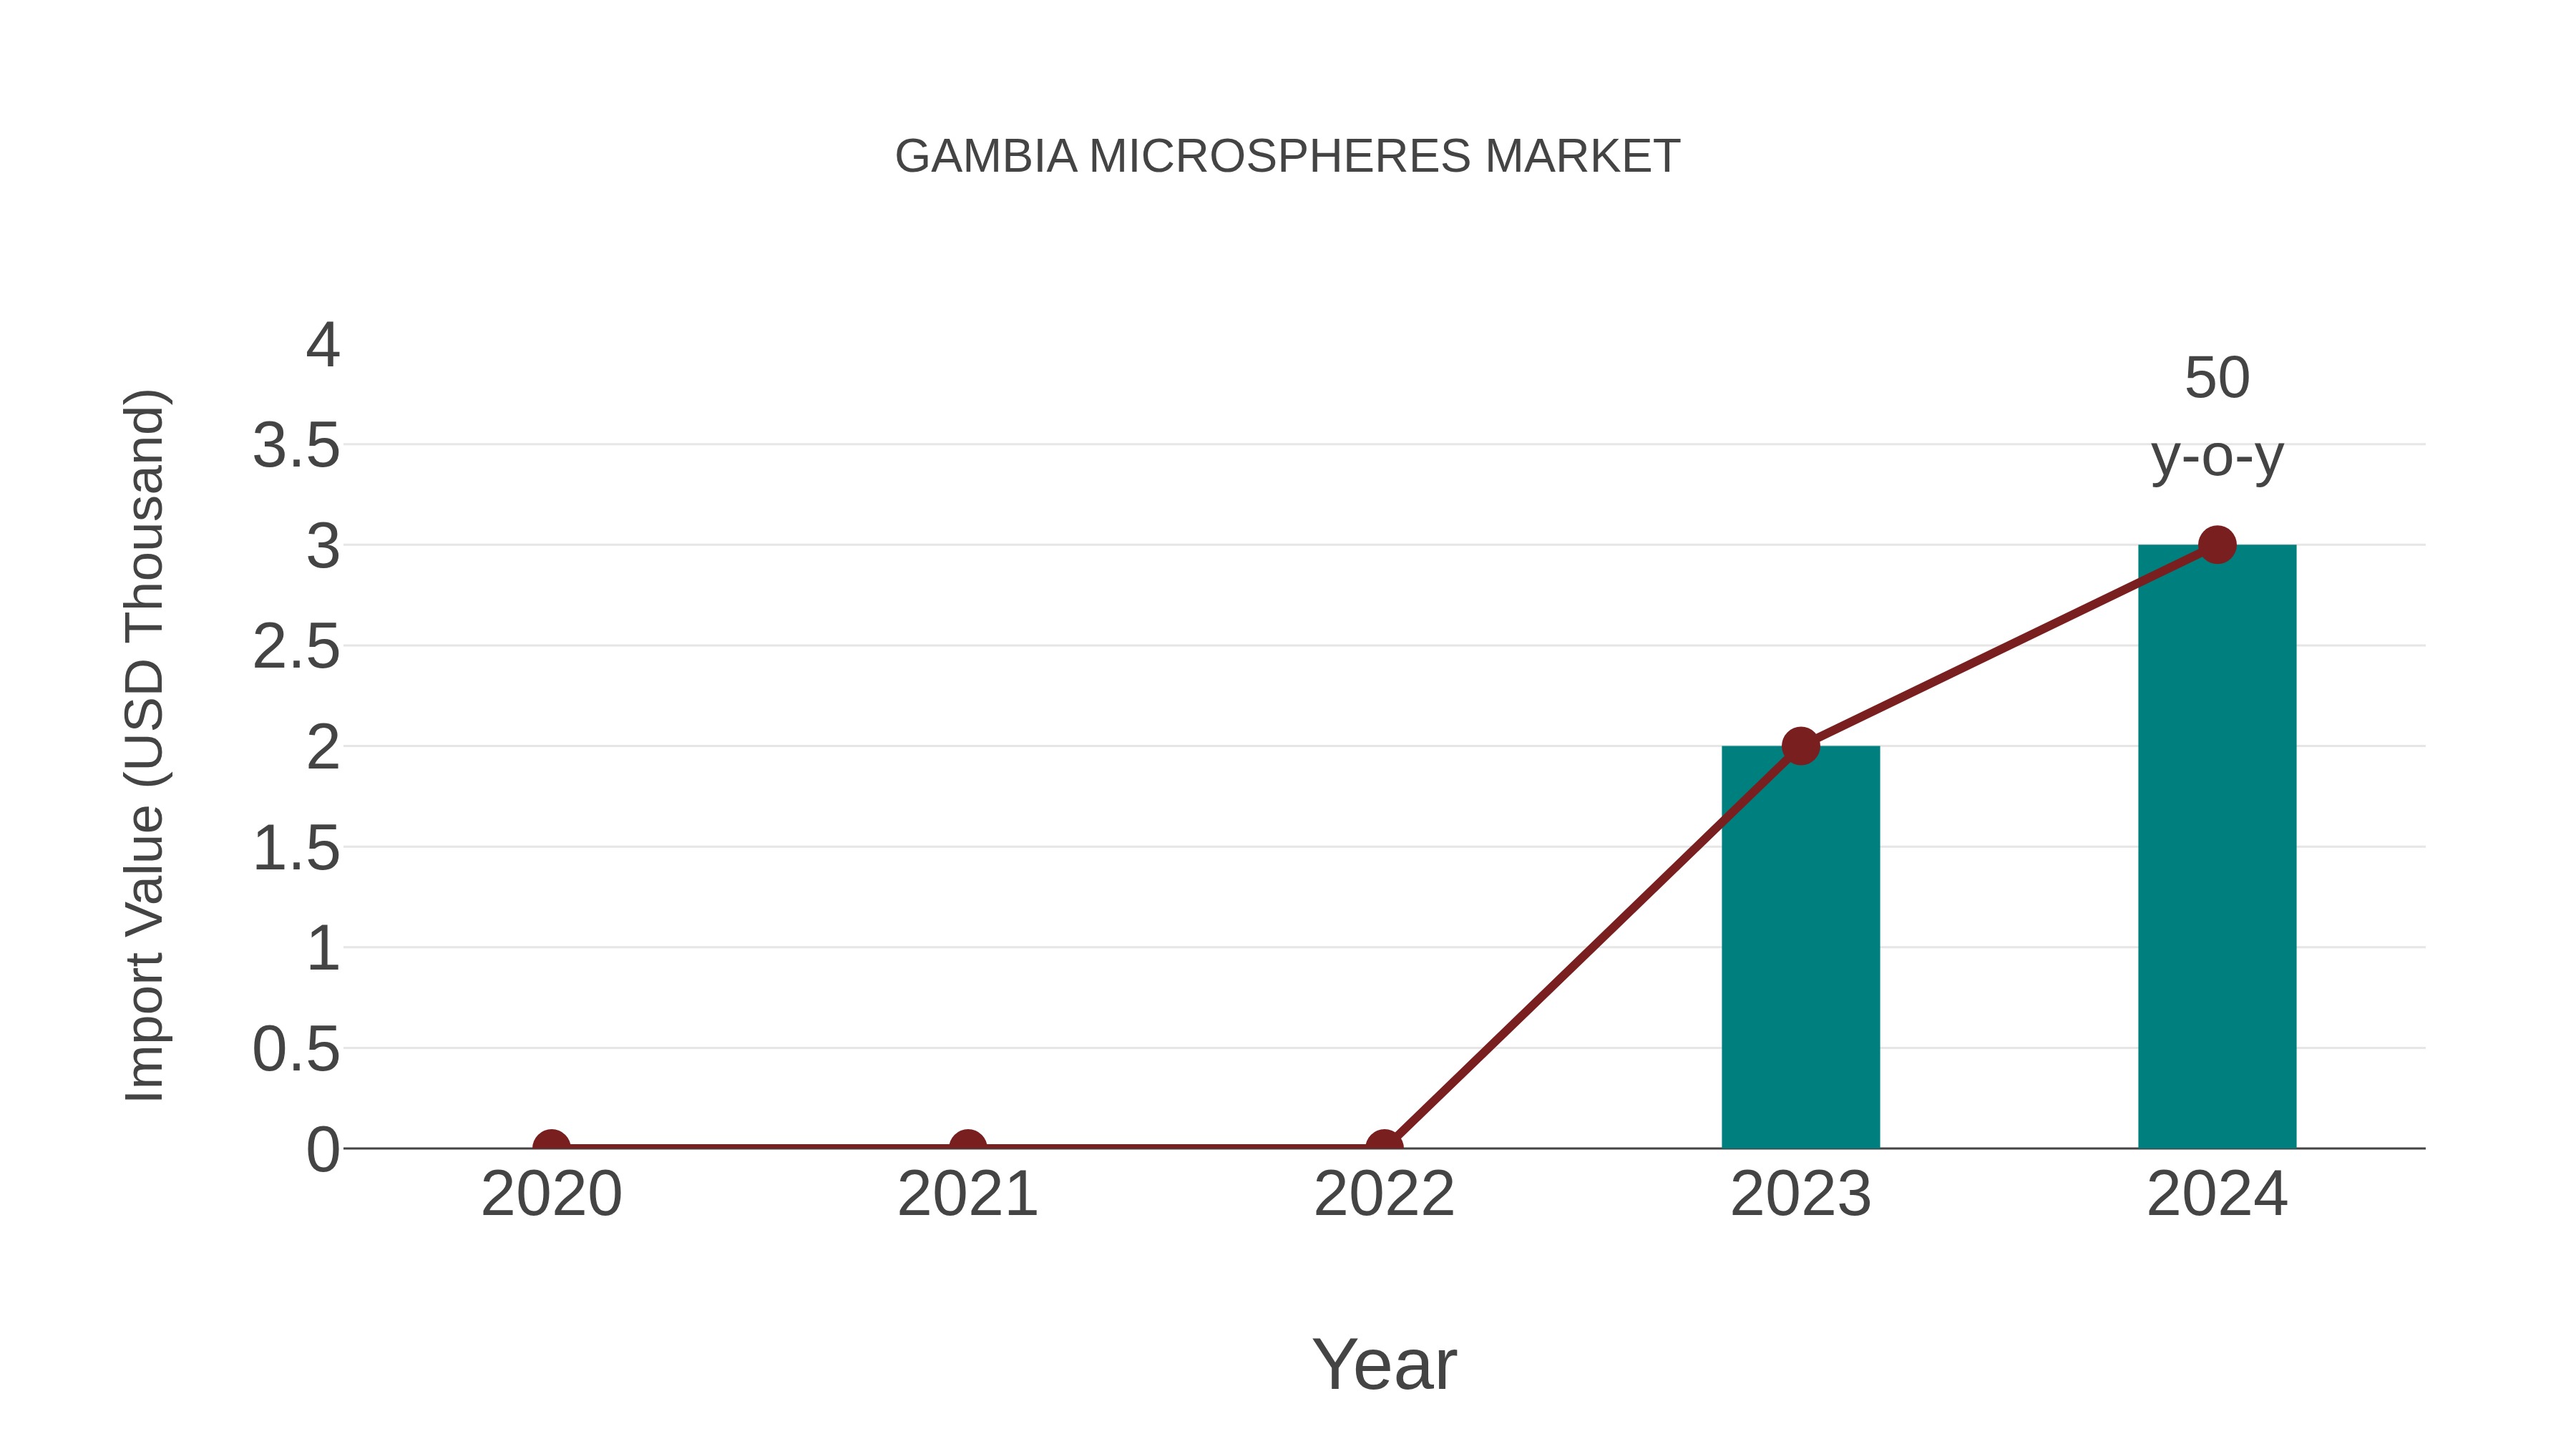
Gambia Microspheres Market: Import Trend Analysis
The import trend for Gambia`s microspheres market in the past showed a steady increase due to growing demand in various industries such as healthcare, cosmetics, and construction. This trend was driven by the need for advanced materials and technologies in the country.
Gambia Microspheres Market Overview
The microspheres market in Gambia is benefiting from the increasing use of these tiny spherical particles in applications such as drug delivery, diagnostics, and material science. Microspheres are used in a wide range of industries due to their unique properties, including controlled release and lightweight characteristics. As Gambias healthcare and industrial sectors grow, the demand for microspheres is expected to rise.
Drivers of the market
Microspheres find growing applications in construction, healthcare, and cosmetics industries in Gambia. Their lightweight and durable properties drive adoption, supported by increasing industrialization and innovation.
Challenges of the market
The Microspheres Market in Gambia is constrained by limited industrial applications and high import costs. The absence of local manufacturing capabilities and research facilities further impedes market expansion.
Government Policy of the market
The Gambian government supports the microspheres market, particularly for applications in pharmaceuticals, cosmetics, and industrial sectors. Policies encourage research and development in microsphere production, fostering innovation in drug delivery systems, diagnostics, and other applications. The government provides financial incentives for businesses involved in microsphere technology and ensures that products meet safety and quality standards.
Key Highlights of the Report:
- Gambia Microspheres Market Outlook
- Market Size of Gambia Microspheres Market, 2025
- Forecast of Gambia Microspheres Market, 2032
- Historical Data and Forecast of Gambia Microspheres Revenues & Volume for the Period 2022-2032F
- Gambia Microspheres Market Trend Evolution
- Gambia Microspheres Market Drivers and Challenges
- Gambia Microspheres Price Trends
- Gambia Microspheres Porter`s Five Forces
- Gambia Microspheres Industry Life Cycle
- Historical Data and Forecast of Gambia Microspheres Market Revenues & Volume By Type for the Period 2022-2032F
- Historical Data and Forecast of Gambia Microspheres Market Revenues & Volume By Hollow for the Period 2022-2032F
- Historical Data and Forecast of Gambia Microspheres Market Revenues & Volume By Solid for the Period 2022-2032F
- Historical Data and Forecast of Gambia Microspheres Market Revenues & Volume By Raw Material for the Period 2022-2032F
- Historical Data and Forecast of Gambia Microspheres Market Revenues & Volume By Glass for the Period 2022-2032F
- Historical Data and Forecast of Gambia Microspheres Market Revenues & Volume By Ceramic for the Period 2022-2032F
- Historical Data and Forecast of Gambia Microspheres Market Revenues & Volume By Fly Ash for the Period 2022-2032F
- Historical Data and Forecast of Gambia Microspheres Market Revenues & Volume By Polymer for the Period 2022-2032F
- Historical Data and Forecast of Gambia Microspheres Market Revenues & Volume By Metallic for the Period 2022-2032F
- Historical Data and Forecast of Gambia Microspheres Market Revenues & Volume By Application for the Period 2022-2032F
- Historical Data and Forecast of Gambia Microspheres Market Revenues & Volume By Construction Composites for the Period 2022-2032F
- Historical Data and Forecast of Gambia Microspheres Market Revenues & Volume By Medical Technology for the Period 2022-2032F
- Historical Data and Forecast of Gambia Microspheres Market Revenues & Volume By Cosmetics & Personal Care for the Period 2022-2032F
- Historical Data and Forecast of Gambia Microspheres Market Revenues & Volume By Automotive for the Period 2022-2032F
- Historical Data and Forecast of Gambia Microspheres Market Revenues & Volume By Oil & Gas for the Period 2022-2032F
- Gambia Microspheres Import Export Trade Statistics
- Market Opportunity Assessment By Type
- Market Opportunity Assessment By Raw Material
- Market Opportunity Assessment By Application
- Gambia Microspheres Top Companies Market Share
- Gambia Microspheres Competitive Benchmarking By Technical and Operational Parameters
- Gambia Microspheres Company Profiles
- Gambia Microspheres Key Strategic Recommendations
Gambia Microspheres Market (2026-2032): FAQs
6Wresearch actively monitors the Gambia Microspheres Market and publishes its comprehensive annual report, highlighting emerging trends, growth drivers, revenue analysis, and forecast outlook. Our insights help businesses to make data-backed strategic decisions with ongoing market dynamics. Our analysts track relevent industries related to the Gambia Microspheres Market, allowing our clients with actionable intelligence and reliable forecasts tailored to emerging regional needs.
Yes, we provide customisation as per your requirements. To learn more, feel free to contact us on sales@6wresearch.com
1 Executive Summary |
2 Introduction |
2.1 Key Highlights of the Report |
2.2 Report Description |
2.3 Market Scope & Segmentation |
2.4 Research Methodology |
2.5 Assumptions |
3 Gambia Microspheres Market Overview |
3.1 Gambia Country Macro Economic Indicators |
3.2 Gambia Microspheres Market Revenues & Volume, 2022 & 2032F |
3.3 Gambia Microspheres Market - Industry Life Cycle |
3.4 Gambia Microspheres Market - Porter's Five Forces |
3.5 Gambia Microspheres Market Revenues & Volume Share, By Type, 2022 & 2032F |
3.6 Gambia Microspheres Market Revenues & Volume Share, By Raw Material, 2022 & 2032F |
3.7 Gambia Microspheres Market Revenues & Volume Share, By Application, 2022 & 2032F |
4 Gambia Microspheres Market Dynamics |
4.1 Impact Analysis |
4.2 Market Drivers |
4.2.1 Increasing demand for advanced drug delivery systems. |
4.2.2 Growing adoption of microspheres in the healthcare sector for targeted drug delivery. |
4.2.3 Rising investments in research and development activities related to microsphere technology. |
4.3 Market Restraints |
4.3.1 High cost associated with the production and development of microspheres. |
4.3.2 Stringent regulatory requirements for the approval of microsphere-based products. |
4.3.3 Limited awareness and understanding of the benefits of microspheres among end-users. |
5 Gambia Microspheres Market Trends |
6 Gambia Microspheres Market Segmentations |
6.1 Gambia Microspheres Market, By Type |
6.1.1 Overview and Analysis |
6.1.2 Gambia Microspheres Market Revenues & Volume, By Hollow, 2022-2032F |
6.1.3 Gambia Microspheres Market Revenues & Volume, By Solid, 2022-2032F |
6.2 Gambia Microspheres Market, By Raw Material |
6.2.1 Overview and Analysis |
6.2.2 Gambia Microspheres Market Revenues & Volume, By Glass, 2022-2032F |
6.2.3 Gambia Microspheres Market Revenues & Volume, By Ceramic, 2022-2032F |
6.2.4 Gambia Microspheres Market Revenues & Volume, By Fly Ash, 2022-2032F |
6.2.5 Gambia Microspheres Market Revenues & Volume, By Polymer, 2022-2032F |
6.2.6 Gambia Microspheres Market Revenues & Volume, By Metallic, 2022-2032F |
6.3 Gambia Microspheres Market, By Application |
6.3.1 Overview and Analysis |
6.3.2 Gambia Microspheres Market Revenues & Volume, By Construction Composites, 2022-2032F |
6.3.3 Gambia Microspheres Market Revenues & Volume, By Medical Technology, 2022-2032F |
6.3.4 Gambia Microspheres Market Revenues & Volume, By Cosmetics & Personal Care, 2022-2032F |
6.3.5 Gambia Microspheres Market Revenues & Volume, By Automotive, 2022-2032F |
6.3.6 Gambia Microspheres Market Revenues & Volume, By Oil & Gas, 2022-2032F |
7 Gambia Microspheres Market Import-Export Trade Statistics |
7.1 Gambia Microspheres Market Export to Major Countries |
7.2 Gambia Microspheres Market Imports from Major Countries |
8 Gambia Microspheres Market Key Performance Indicators |
8.1 Research and development investment in microsphere technology. |
8.2 Number of patents filed for new microsphere formulations. |
8.3 Adoption rate of microsphere-based drug delivery systems in the healthcare sector. |
9 Gambia Microspheres Market - Opportunity Assessment |
9.1 Gambia Microspheres Market Opportunity Assessment, By Type, 2022 & 2032F |
9.2 Gambia Microspheres Market Opportunity Assessment, By Raw Material, 2022 & 2032F |
9.3 Gambia Microspheres Market Opportunity Assessment, By Application, 2022 & 2032F |
10 Gambia Microspheres Market - Competitive Landscape |
10.1 Gambia Microspheres Market Revenue Share, By Companies, 2025 |
10.2 Gambia Microspheres Market Competitive Benchmarking, By Operating and Technical Parameters |
11 Company Profiles |
12 Recommendations | 13 Disclaimer |
Export potential assessment - trade Analytics for 2030
Export potential enables firms to identify high-growth global markets with greater confidence by combining advanced trade intelligence with a structured quantitative methodology. The framework analyzes emerging demand trends and country-level import patterns while integrating macroeconomic and trade datasets such as GDP and population forecasts, bilateral import–export flows, tariff structures, elasticity differentials between developed and developing economies, geographic distance, and import demand projections. Using weighted trade values from 2020–2024 as the base period to project country-to-country export potential for 2030, these inputs are operationalized through calculated drivers such as gravity model parameters, tariff impact factors, and projected GDP per-capita growth. Through an analysis of hidden potentials, demand hotspots, and market conditions that are most favorable to success, this method enables firms to focus on target countries, maximize returns, and global expansion with data, backed by accuracy.
By factoring in the projected importer demand gap that is currently unmet and could be potential opportunity, it identifies the potential for the Exporter (Country) among 190 countries, against the general trade analysis, which identifies the biggest importer or exporter.
To discover high-growth global markets and optimize your business strategy:
Click Here
Pricing
- Single User License$ 1,995
- Department License$ 2,400
- Site License$ 3,120
- Global License$ 3,795

Search
Thought Leadership and Analyst Meet


Our Clients
Latest Reports
- Philippines Polyhydroxybutyrate-co-Hydroxyvalerate Market (2026-2032) | Trends, Insights, Challenges, Restraints, Competition, Size, Value, Forecast, Pricing, Share, Outlook, Revenue, Investment Opportunities, Strategy, Drivers, Demand, Growth, segmentation, Analysis, Companies
- Peru Polyhydroxybutyrate-co-Hydroxyvalerate Market (2026-2032) | Growth, Demand, Challenges, Share, Trends, Analysis, Pricing, Investment Opportunities, Drivers, Value, Forecast, Competition, Size, Companies, Insights, Outlook, Restraints, segmentation, Revenue, Strategy
- Pakistan Polyhydroxybutyrate-co-Hydroxyvalerate Market (2026-2032) | Restraints, segmentation, Pricing, Forecast, Share, Strategy, Competition, Trends, Insights, Drivers, Challenges, Growth, Revenue, Outlook, Value, Investment Opportunities, Companies, Size, Analysis, Demand
- Oman Polyhydroxybutyrate-co-Hydroxyvalerate Market (2026-2032) | Drivers, segmentation, Insights, Competition, Pricing, Outlook, Size, Revenue, Challenges, Forecast, Analysis, Growth, Value, Share, Trends, Investment Opportunities, Strategy, Restraints, Companies, Demand
- Nigeria Polyhydroxybutyrate-co-Hydroxyvalerate Market (2026-2032) | Value, Investment Opportunities, Analysis, Revenue, Restraints, Pricing, Outlook, Competition, Demand, Growth, Forecast, Companies, Trends, Challenges, segmentation, Drivers, Insights, Share, Size, Strategy
- Nepal Polyhydroxybutyrate-co-Hydroxyvalerate Market (2026-2032) | Insights, Analysis, Drivers, Share, Revenue, Demand, segmentation, Investment Opportunities, Competition, Forecast, Growth, Pricing, Companies, Strategy, Trends, Restraints, Challenges, Outlook, Size, Value
- Myanmar Polyhydroxybutyrate-co-Hydroxyvalerate Market (2026-2032) | Outlook, Revenue, Strategy, Restraints, Drivers, segmentation, Share, Forecast, Competition, Insights, Growth, Pricing, Size, Demand, Value, Companies, Trends, Challenges, Investment Opportunities, Analysis
- Morocco Polyhydroxybutyrate-co-Hydroxyvalerate Market (2026-2032) | Outlook, Investment Opportunities, Restraints, Strategy, Forecast, Challenges, Drivers, Growth, Companies, segmentation, Trends, Size, Competition, Revenue, Demand, Insights, Share, Analysis, Value, Pricing
- Mexico Polyhydroxybutyrate-co-Hydroxyvalerate Market (2026-2032) | Size, Drivers, Outlook, Share, Strategy, Growth, Pricing, Challenges, Companies, Demand, Value, Investment Opportunities, Restraints, Trends, Forecast, segmentation, Analysis, Insights, Competition, Revenue
- Malaysia Polyhydroxybutyrate-co-Hydroxyvalerate Market (2026-2032) | Share, segmentation, Size, Companies, Analysis, Insights, Forecast, Value, Revenue, Drivers, Restraints, Challenges, Investment Opportunities, Trends, Competition, Strategy, Demand, Growth, Outlook, Pricing
Industry Events and Analyst Meet

HIMTEX 2026

India Refining Summit 2026

India EV Show 2026

EV tech India Expo 2026

Auto Tech Asia 2026
Whitepaper
- Middle East & Africa Commercial Security Market Click here to view more.
- Middle East & Africa Fire Safety Systems & Equipment Market Click here to view more.
- GCC Drone Market Click here to view more.
- Middle East Lighting Fixture Market Click here to view more.
- GCC Physical & Perimeter Security Market Click here to view more.
6WResearch In News
- Doha a strategic location for EV manufacturing hub: IPA Qatar
- Demand for luxury TVs surging in the GCC, says Samsung
- Empowering Growth: The Thriving Journey of Bangladesh’s Cable Industry
- Demand for luxury TVs surging in the GCC, says Samsung
- Video call with a traditional healer? Once unthinkable, it’s now common in South Africa
- Intelligent Buildings To Smooth GCC’s Path To Net Zero