Georgia Amusement park Market (2026-2032) Outlook | Share, Growth, Companies, Analysis, Size, Industry, Trends, Value, Revenue & Forecast
Market Forecast By Rides (Mechanical Rides, Water Rides, Other Rides), By Age (Up to 18 Years, 19 to 35 Years, 36 to 50 Years, 51 to 65 Years, More than 65 Years), By Revenue Source (Ticket, Food & Beverage, Merchandise, Hotels/Resorts, Others) And Competitive Landscape
| Product Code: ETC097939 | Publication Date: Jun 2021 | Updated Date: Jun 2026 | Product Type: Report | |
| Publisher: 6Wresearch | Author: Shubham Deep | No. of Pages: 70 | No. of Figures: 35 | No. of Tables: 5 |
Georgia Amusement park Market Size, Share & Growth Rate
The Georgia Amusement park Market was estimated at USD 146 Million in 2025 and is projected to reach USD 160 Million by 2032, growing at a CAGR of 1.3% from 2026 to 2032. This growth trajectory is supported by a resurgence in domestic tourism, an increasing focus on innovative attractions, and enhanced marketing strategies that resonate with a diverse consumer base. As the industry evolves, parks are prioritizing guest experiences and integrating technology, which plays a significant role in attracting both local and out-of-state visitors.
Georgia Amusement park Market Growth Rate Analysis (2021-2032)
The Georgia amusement park market experienced a challenging phase in 2021, reflecting a decline of 3.6%, largely due to the lingering effects of the pandemic and resulting visitor hesitance. However, a robust recovery ensued in 2022 and 2023, showcasing growth rates of 5.1% and 5.5% respectively, fueled by pent-up consumer demand, significant investments in infrastructure, and the introduction of innovative attractions. While projections indicate a more modest growth trajectory of 0.2% to 1.9% from 2024 to 2032, these figures highlight a gradual stabilization. The industry's focus on digital enhancements and sustainable practices is expected to support growth through evolving consumer preferences, underlining the market's resilience amidst fluctuations.
Georgia Amusement park Market Year-wise Growth Rate and Key Drivers
This graph highlights how the Georgia Amusement park Market has steadily grown over the past five years, supported by major growth factors.
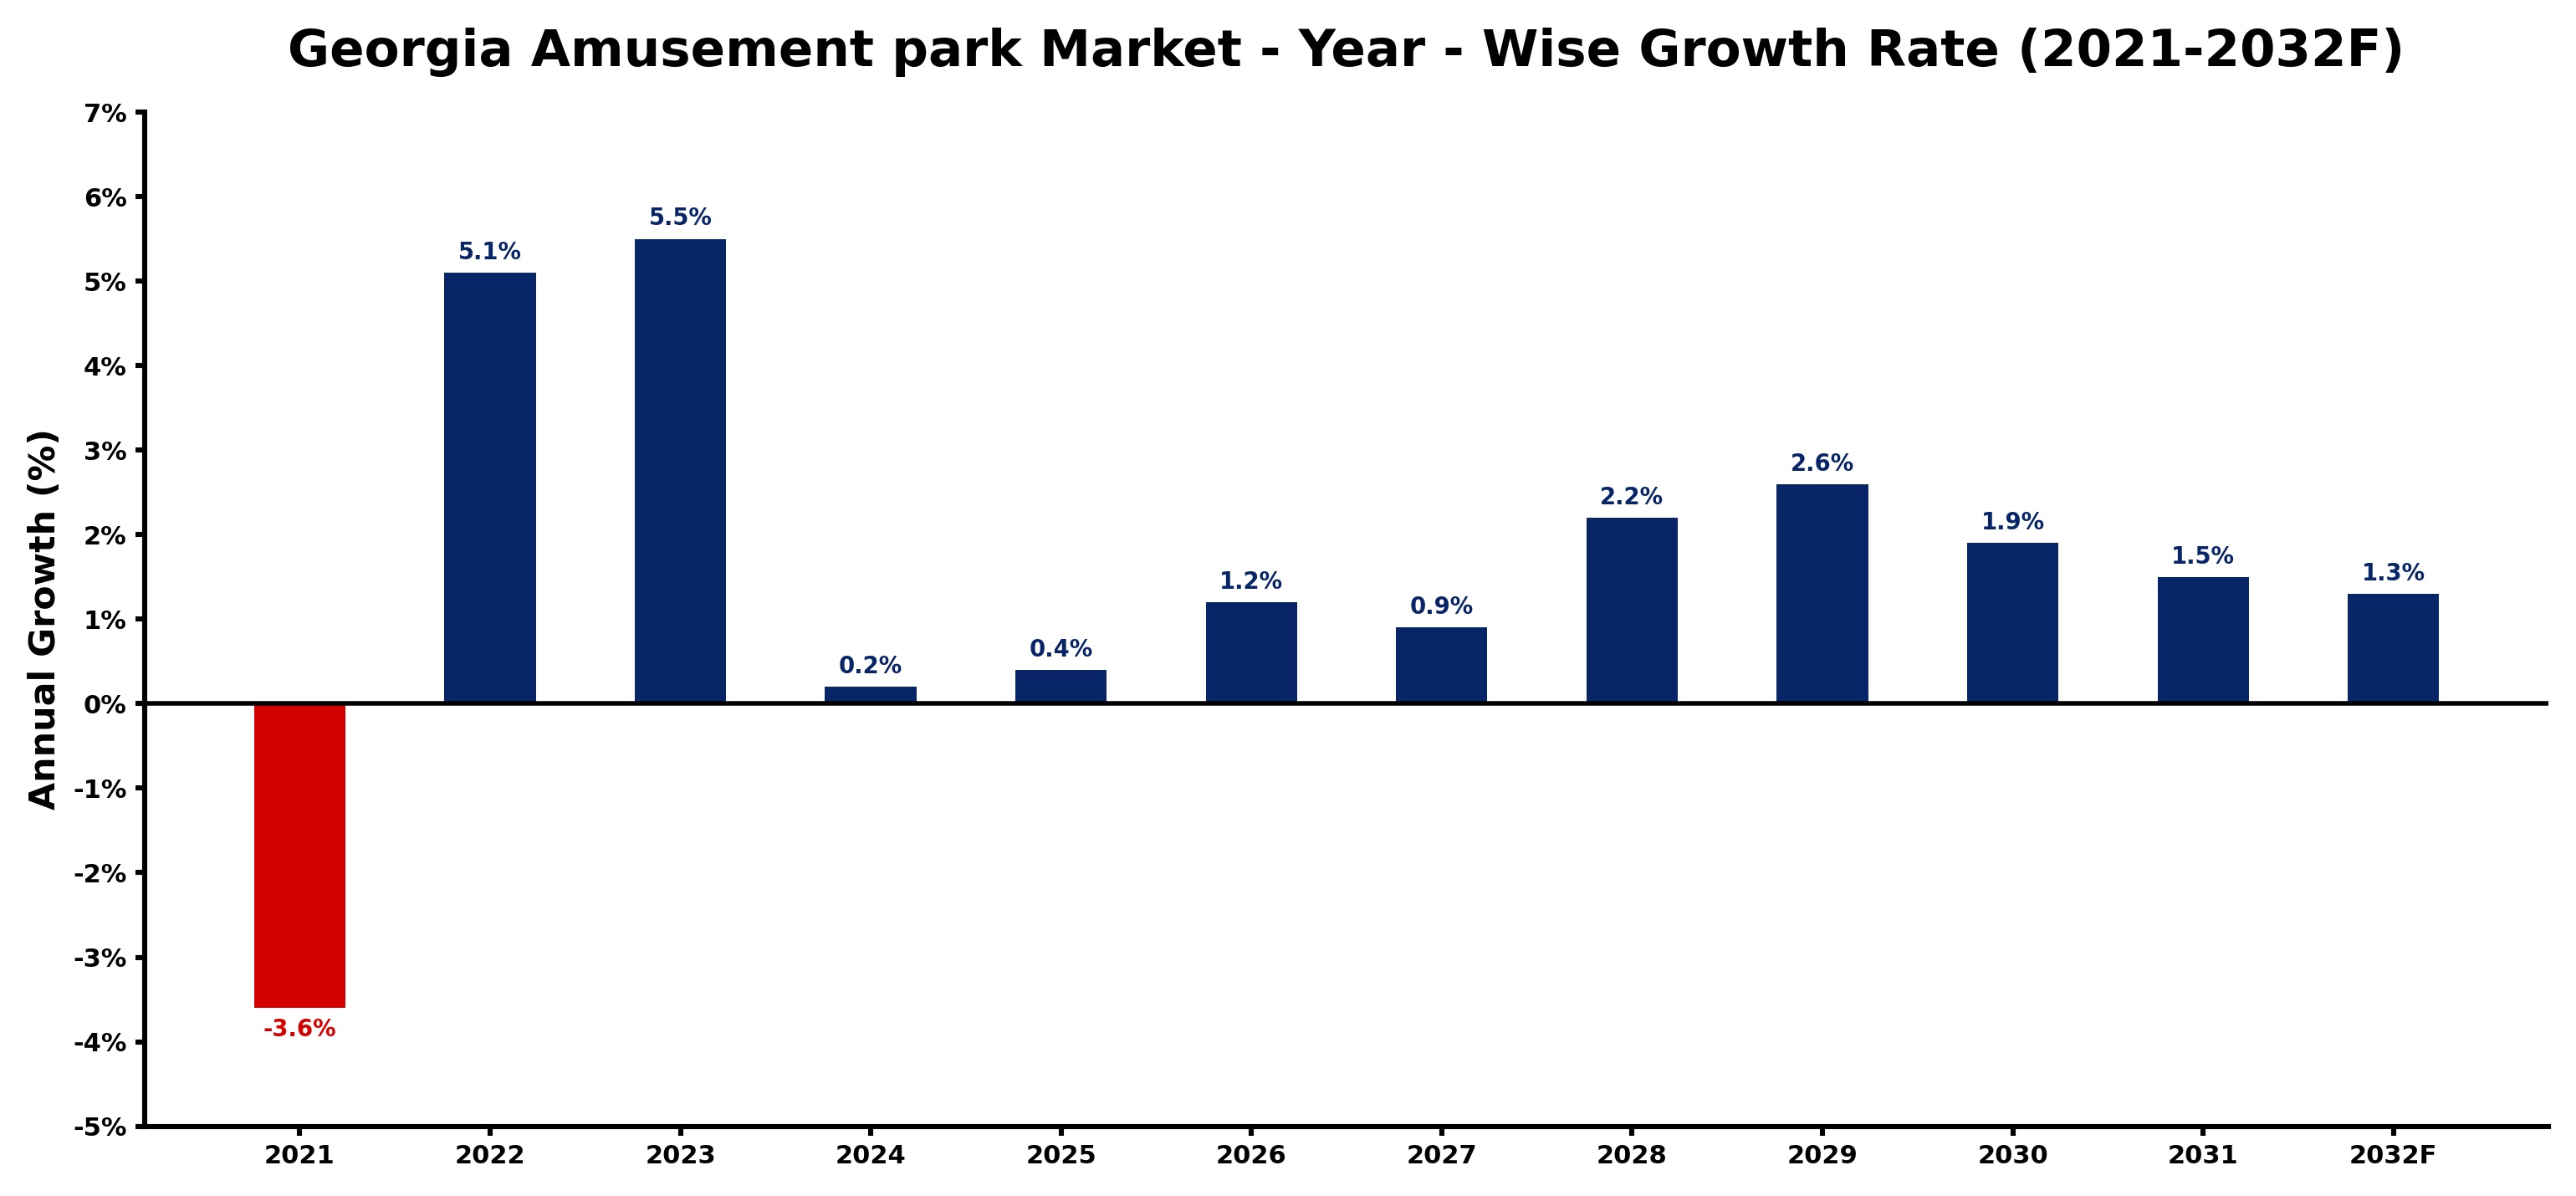
The table below presents the year‑wise growth rates along with the key drivers influencing the market
| Year | Growth Rate | Major Drivers |
| 2021 | -3.6% | Inflation pressures diminished amusement park equipment manufacturing investments |
| 2022 | 5.1% | Technology integration streamlined amusement ride safety compliance procedures |
| 2023 | 5.5% | New theme park constructions boost regional ride manufacturing demands |
| 2024 | 0.2% | Export driven leisure investments boost local amusement park attractions |
| 2025 | 0.4% | Upgraded ride systems boosted component manufacturing for local suppliers |
| 2026 | 1.2% | Amusement park technology upgrades boost demand for advanced ride components |
| 2027 | 0.9% | Increased family entertainment spending bolstered amusement ride manufacturing demand |
| 2028 | 2.2% | Export driven investment in amusement park infrastructure boosted equipment manufacturing |
| 2029 | 2.6% | New ride installations boosted local supplier component manufacturing efforts |
| 2030 | 1.9% | Capacity expansions in amusement parks boost ride manufacturing demand |
| 2031 | 1.5% | Infrastructure upgrades boost visitor capacity for amusement parks |
| 2032 | 1.3% | New ride installations drive local amusement park equipment manufacturing growth |
Note - Market size estimations and growth projections presented in this report are based on 6Wresearch’s advanced forecasting approach, validated with industry datasets as of June 2026.
Georgia Amusement park Market Synopsis
In the Georgia Amusement park Market, family-oriented attractions are witnessing a surge in popularity. Parks are increasingly offering themed events and interactive experiences that cater to various age groups, making visits enjoyable for all family members. This focus on inclusivity not only enriches guest experiences but also fosters repeat visits, ensuring a loyal customer base.
Moreover, technological advancements such as augmented reality enhancements in rides are drawing a tech-savvy crowd seeking novel experiences. This shift towards technology-driven entertainment is part of a larger trend within the industry, as parks strive to differentiate themselves in a competitive landscape.
Georgia Amusement park Market Key Takeaways
- The market is expected to grow from USD 146 Million in 2025 to USD 160 Million by 2032.
- Innovative attractions and immersive experiences are becoming key drivers of visitor engagement.
- Family-friendly offerings are increasingly popular, catering to diverse demographic segments.
- Effective marketing strategies are crucial in mitigating the impacts of seasonality.
- Technological integration is reshaping the visitor experience in Georgia amusement parks.
Evaluation of Restraints in Georgia Amusement park Market
Despite its positive outlook, the Georgia amusement park market grapples with significant restraints. Seasonality remains a major challenge, as parks depend heavily on weather conditions and peak tourist seasons for revenue. Operators often face the difficulty of maintaining steady attendance during off-peak times, necessitating the implementation of innovative marketing strategies. Moreover, the competitive landscape—marked by water parks, zoos, and other entertainment venues—complicates visitor retention efforts. Rising operational costs, including maintenance and labor, further stress profitability. Balancing these dynamics requires strategic foresight and adaptability from operators.
Georgia Amusement park Market Trends
The Georgia amusement park market is currently witnessing a notable trend towards sustainability and eco-friendly initiatives. Parks are implementing practices to minimize their environmental impact, appealing to a conscientious audience. Additionally, the integration of virtual reality and augmented reality technologies is on the rise, enhancing visitor experiences and creating more immersive attractions. These trends reflect a broader shift in consumer preferences towards experiential entertainment, where interactive, personalized experiences are becoming the norm. Family-oriented events and themed attractions further cater to this demand, ensuring a diverse audience.
Georgia Amusement park Market Opportunities
The potential for investment in the Georgia amusement park market is robust, particularly in light of the state's growing tourism industry. There are significant opportunities for developing new parks or expanding existing ones, especially in high-traffic areas like Atlanta and Savannah. As technology continues to advance, parks that incorporate cutting-edge attractions or themed experiences stand to differentiate themselves. Moreover, partnerships with local businesses and tourism boards can further amplify marketing efforts, increasing visibility and drawing more visitors.
Government Initiatives in the Georgia Amusement park Market
The regulation of the Georgia amusement park market is guided by strict safety policies designed to protect visitors. The Georgia Department of Labor oversees the compliance of amusement parks with safety guidelines, including regular maintenance and inspection of rides. These regulations are essential for maintaining operational standards and ensuring guest safety. Furthermore, government incentives aimed at enhancing tourism, such as marketing campaigns and public funding for attractions, contribute positively to the market landscape.
Future Insights of the Georgia Amusement park Market
Looking ahead to 2026-2032, the Georgia amusement park market is poised for promising growth. Rising disposable incomes and increased spending on leisure activities are expected to boost demand for amusement park experiences. Additionally, as technology advances, parks that adapt by introducing innovative attractions will likely capture a larger market share. The trend towards local tourism is also anticipated to continue, positioning Georgia's amusement parks as favorable destinations for both families and thrill-seekers. A focus on quality entertainment and guest experiences will further ensure that the market remains vibrant and attractive.
Georgia Amusement park Market Latest Developments (May 2025 - June 2026)
Recent developments in the Georgia amusement park market indicate a significant shift towards more immersive and technology-driven attractions. Parks are exploring partnerships with technology companies to enhance visitor experiences through augmented reality applications and interactive installations. In addition, there is a growing trend among parks to host seasonal events aimed at attracting visitors during typically slower months, thereby addressing seasonality issues. Efforts to implement more sustainable practices are also becoming more prevalent, with parks focusing on reducing their carbon footprint and increasing eco-friendly offerings.
Georgia Amusement park Market - Key Attractiveness of the Report
- 10 Years of Market Numbers
- Historical Data Starting from 2022 to 2025
- Base Year: 2025
- Forecast Data until 2032
- Key Performance Indicators Impacting the Market
- Major Upcoming Developments and Projects
Key Highlights of the Report:
- Georgia Amusement park Market Outlook
- Market Size of Georgia Amusement park Market, 2025
- Forecast of Georgia Amusement park Market, 2032
- Historical Data and Forecast of Georgia Amusement park Revenues & Volume for the Period 2022-2032F
- Georgia Amusement park Market Trend Evolution
- Georgia Amusement park Market Drivers and Challenges
- Georgia Amusement park Price Trends
- Georgia Amusement park Porter's Five Forces
- Georgia Amusement park Industry Life Cycle
- Historical Data and Forecast of Georgia Amusement park Market Revenues & Volume By Rides for the Period 2022-2032F
- Historical Data and Forecast of Georgia Amusement park Market Revenues & Volume By Mechanical Rides for the Period 2022-2032F
- Historical Data and Forecast of Georgia Amusement park Market Revenues & Volume By Water Rides for the Period 2022-2032F
- Historical Data and Forecast of Georgia Amusement park Market Revenues & Volume By Other Rides for the Period 2022-2032F
- Historical Data and Forecast of Georgia Amusement park Market Revenues & Volume By Age for the Period 2022-2032F
- Historical Data and Forecast of Georgia Amusement park Market Revenues & Volume By Up to 18 Years for the Period 2022-2032F
- Historical Data and Forecast of Georgia Amusement park Market Revenues & Volume By 19 to 35 Years for the Period 2022-2032F
- Historical Data and Forecast of Georgia Amusement park Market Revenues & Volume By 36 to 50 Years for the Period 2022-2032F
- Historical Data and Forecast of Georgia Amusement park Market Revenues & Volume By 51 to 65 Years for the Period 2022-2032F
- Historical Data and Forecast of Georgia Amusement park Market Revenues & Volume By More than 65 Years for the Period 2022-2032F
- Historical Data and Forecast of Georgia Amusement park Market Revenues & Volume By Revenue Source for the Period 2022-2032F
- Historical Data and Forecast of Georgia Amusement park Market Revenues & Volume By Ticket for the Period 2022-2032F
- Historical Data and Forecast of Georgia Amusement park Market Revenues & Volume By Food & Beverage for the Period 2022-2032F
- Historical Data and Forecast of Georgia Amusement park Market Revenues & Volume By Merchandise for the Period 2022-2032F
- Historical Data and Forecast of Georgia Amusement park Market Revenues & Volume By Hotels/Resorts for the Period 2022-2032F
- Historical Data and Forecast of Georgia Amusement park Market Revenues & Volume By Others for the Period 2022-2032F
- Georgia Amusement park Import Export Trade Statistics
- Market Opportunity Assessment By Rides
- Market Opportunity Assessment By Age
- Market Opportunity Assessment By Revenue Source
- Georgia Amusement park Top Companies Market Share
- Georgia Amusement park Competitive Benchmarking By Technical and Operational Parameters
- Georgia Amusement park Company Profiles
- Georgia Amusement park Key Strategic Recommendations
Georgia Amusement park Market - Frequently Asked Questions
The market is expected to grow from USD 146 Million in 2025 to USD 160 Million by 2032, with a CAGR of 1.3% from 2026 to 2032.
Parks are increasingly focusing on immersive experiences, incorporating advanced technology such as virtual and augmented reality to enhance attractions. This shift caters to a diverse audience seeking engaging and unique entertainment options.
Family-friendly attractions are vital to the market, as they not only attract a broader demographic but also promote repeat visits. Parks are prioritizing events and activities that engage all family members, ensuring inclusivity and enjoyment.
Seasonality is a significant challenge for operators, as attendance is heavily dependent on peak tourist seasons. Additionally, rising operational costs and competition from alternative entertainment options can impact profitability.
Government regulations ensure visitor safety through strict guidelines for ride maintenance and operations. Compliance with these regulations is crucial for maintaining a positive reputation and operating legally within the state.
6Wresearch actively monitors the Georgia Amusement park Market and publishes its comprehensive annual report, highlighting emerging trends, growth drivers, revenue analysis, and forecast outlook. Our insights help businesses to make data-backed strategic decisions with ongoing market dynamics. Our analysts track relevent industries related to the Georgia Amusement park Market, allowing our clients with actionable intelligence and reliable forecasts tailored to emerging regional needs.
Yes, we provide customisation as per your requirements. To learn more, feel free to contact us on sales@6wresearch.com
1 Executive Summary |
2 Introduction |
2.1 Key Highlights of the Report |
2.2 Report Description |
2.3 Market Scope & Segmentation |
2.4 Research Methodology |
2.5 Assumptions |
3 Georgia Amusement park Market Overview |
3.1 Georgia Country Macro Economic Indicators |
3.2 Georgia Amusement park Market Revenues & Volume, 2022 & 2032F |
3.3 Georgia Amusement park Market - Industry Life Cycle |
3.4 Georgia Amusement park Market - Porter's Five Forces |
3.5 Georgia Amusement park Market Revenues & Volume Share, By Rides, 2022 & 2032F |
3.6 Georgia Amusement park Market Revenues & Volume Share, By Age, 2022 & 2032F |
3.7 Georgia Amusement park Market Revenues & Volume Share, By Revenue Source, 2022 & 2032F |
4 Georgia Amusement park Market Dynamics |
4.1 Impact Analysis |
4.2 Market Drivers |
4.2.1 Growing disposable income of consumers in Georgia |
4.2.2 Increasing tourism in Georgia |
4.2.3 Innovation in ride technology and attractions |
4.2.4 Growth in family entertainment spending |
4.2.5 Favorable weather conditions for outdoor amusement parks in Georgia |
4.3 Market Restraints |
4.3.1 Seasonality of the amusement park industry in Georgia |
4.3.2 Competition from other entertainment options |
4.3.3 Regulatory challenges and compliance requirements |
4.3.4 Economic downturns impacting consumer spending |
4.3.5 Rising operational costs for maintaining and upgrading amusement park facilities |
5 Georgia Amusement park Market Trends |
6 Georgia Amusement park Market, By Types |
6.1 Georgia Amusement park Market, By Rides |
6.1.1 Overview and Analysis |
6.1.2 Georgia Amusement park Market Revenues & Volume, By Rides, 2022-2032F |
6.1.3 Georgia Amusement park Market Revenues & Volume, By Mechanical Rides, 2022-2032F |
6.1.4 Georgia Amusement park Market Revenues & Volume, By Water Rides, 2022-2032F |
6.1.5 Georgia Amusement park Market Revenues & Volume, By Other Rides, 2022-2032F |
6.2 Georgia Amusement park Market, By Age |
6.2.1 Overview and Analysis |
6.2.2 Georgia Amusement park Market Revenues & Volume, By Up to 18 Years, 2022-2032F |
6.2.3 Georgia Amusement park Market Revenues & Volume, By 19 to 35 Years, 2022-2032F |
6.2.4 Georgia Amusement park Market Revenues & Volume, By 36 to 50 Years, 2022-2032F |
6.2.5 Georgia Amusement park Market Revenues & Volume, By 51 to 65 Years, 2022-2032F |
6.2.6 Georgia Amusement park Market Revenues & Volume, By More than 65 Years, 2022-2032F |
6.3 Georgia Amusement park Market, By Revenue Source |
6.3.1 Overview and Analysis |
6.3.2 Georgia Amusement park Market Revenues & Volume, By Ticket, 2022-2032F |
6.3.3 Georgia Amusement park Market Revenues & Volume, By Food & Beverage, 2022-2032F |
6.3.4 Georgia Amusement park Market Revenues & Volume, By Merchandise, 2022-2032F |
6.3.5 Georgia Amusement park Market Revenues & Volume, By Hotels/Resorts, 2022-2032F |
6.3.6 Georgia Amusement park Market Revenues & Volume, By Others, 2022-2032F |
7 Georgia Amusement park Market Import-Export Trade Statistics |
7.1 Georgia Amusement park Market Export to Major Countries |
7.2 Georgia Amusement park Market Imports from Major Countries |
8 Georgia Amusement park Market Key Performance Indicators |
8.1 Visitor satisfaction ratings and feedback |
8.2 Average length of stay per visitor |
8.3 Percentage of repeat visitors |
8.4 Investment in new attractions and experiences |
8.5 Employee retention rates and training investments |
9 Georgia Amusement park Market - Opportunity Assessment |
9.1 Georgia Amusement park Market Opportunity Assessment, By Rides, 2022 & 2032F |
9.2 Georgia Amusement park Market Opportunity Assessment, By Age, 2022 & 2032F |
9.3 Georgia Amusement park Market Opportunity Assessment, By Revenue Source, 2022 & 2032F |
10 Georgia Amusement park Market - Competitive Landscape |
10.1 Georgia Amusement park Market Revenue Share, By Companies, 2025 |
10.2 Georgia Amusement park Market Competitive Benchmarking, By Operating and Technical Parameters |
11 Company Profiles |
12 Recommendations |
13 Disclaimer |
Global Go To Market Strategy - 2030
Export potential enables firms to identify high-growth global markets with greater confidence by combining advanced trade intelligence with a structured quantitative methodology. The framework analyzes emerging demand trends and country-level import patterns while integrating macroeconomic and trade datasets such as GDP and population forecasts, bilateral import–export flows, tariff structures, elasticity differentials between developed and developing economies, geographic distance, and import demand projections. Using weighted trade values from 2020–2024 as the base period to project country-to-country export potential for 2030, these inputs are operationalized through calculated drivers such as gravity model parameters, tariff impact factors, and projected GDP per-capita growth. Through an analysis of hidden potentials, demand hotspots, and market conditions that are most favorable to success, this method enables firms to focus on target countries, maximize returns, and global expansion with data, backed by accuracy.
By factoring in the projected importer demand gap that is currently unmet and could be potential opportunity, it identifies the potential for the Exporter (Country) among 190 countries, against the general trade analysis, which identifies the biggest importer or exporter.
To discover high-growth global markets and optimize your business strategy:
Click Here
Pricing
- Single User License$ 1,995
- Department License$ 2,400
- Site License$ 3,120
- Global License$ 3,795

Leadership Perspectives from Industry Events
Search
Thought Leadership and Analyst Meet


Our Clients
6WResearch In News
- India Air Conditioner Market Set for Strong Rebound in 2026 After Weather-Led Correction and GST-Driven Recovery: 6Wresearch
- ADAS in India: How Automatic Emergency Braking, Blind Spot Detection & Driver Monitoring are Transforming Road Safety
- Doha a strategic location for EV manufacturing hub: IPA Qatar
- Demand for luxury TVs surging in the GCC, says Samsung
- Empowering Growth: The Thriving Journey of Bangladesh’s Cable Industry
- Demand for luxury TVs surging in the GCC, says Samsung
Latest Reports
- Poland Fire Protection Systems Market (2026-2032)
- Cape Verde Portable Hand-Thrown Extinguisher Market (2026-2032)
- Canada Portable Hand-Thrown Extinguisher Market (2026-2032)
- Cameroon Portable Hand-Thrown Extinguisher Market (2026-2032)
- Burundi Portable Hand-Thrown Extinguisher Market (2026-2032)
- Burkina Faso Portable Hand-Thrown Extinguisher Market (2026-2032)
- Bulgaria Portable Hand-Thrown Extinguisher Market (2026-2032)
- Brunei Portable Hand-Thrown Extinguisher Market (2026-2032)
- Botswana Portable Hand-Thrown Extinguisher Market (2026-2032)
- Bosnia and Herzegovina Portable Hand-Thrown Extinguisher Market (2026-2032)
Industry Events and Analyst Meet

HIMTEX 2026

India Refining Summit 2026

India EV Show 2026

EV tech India Expo 2026

Auto Tech Asia 2026
Whitepaper
- Middle East & Africa Commercial Security Market Click here to view more.
- Middle East & Africa Fire Safety Systems & Equipment Market Click here to view more.
- GCC Drone Market Click here to view more.
- Middle East Lighting Fixture Market Click here to view more.
- GCC Physical & Perimeter Security Market Click here to view more.