Georgia Autoclaved Aerated Concrete Market (2026-2032) Outlook | Value, Growth, Revenue, Forecast, Trends, Size, Analysis, Companies, Share & Industry
Market Forecast By Product Type (Blocks, Others), By End User (Residential, Non-residential), By Application (Walls, Floors & Roofs, Others) And Competitive Landscape
| Product Code: ETC313380 | Publication Date: Aug 2022 | Updated Date: Jul 2026 | Product Type: Market Research Report | |
| Publisher: 6Wresearch | Author: Sumit Sagar | No. of Pages: 75 | No. of Figures: 35 | No. of Tables: 20 |
Georgia Autoclaved Aerated Concrete Market Size, Share & Growth Rate
The Georgia Autoclaved Aerated Concrete Market was estimated at USD 271 Million in 2025 and is projected to reach USD 373 Million by 2032, growing at a CAGR of 4.7% from 2026 to 2032. This positive trajectory is largely driven by heightened awareness of sustainable building practices and the urgent need for energy-efficient materials in the construction sector. Furthermore, government initiatives that advocate for greener construction technologies are solidifying AAC's position within Georgia's evolving infrastructure landscape.
Georgia Autoclaved Aerated Concrete Market Year-wise Growth Rate and Key Drivers
This graph highlights how the Georgia Autoclaved Aerated Concrete Market has steadily grown over the years, supported by major growth factors.
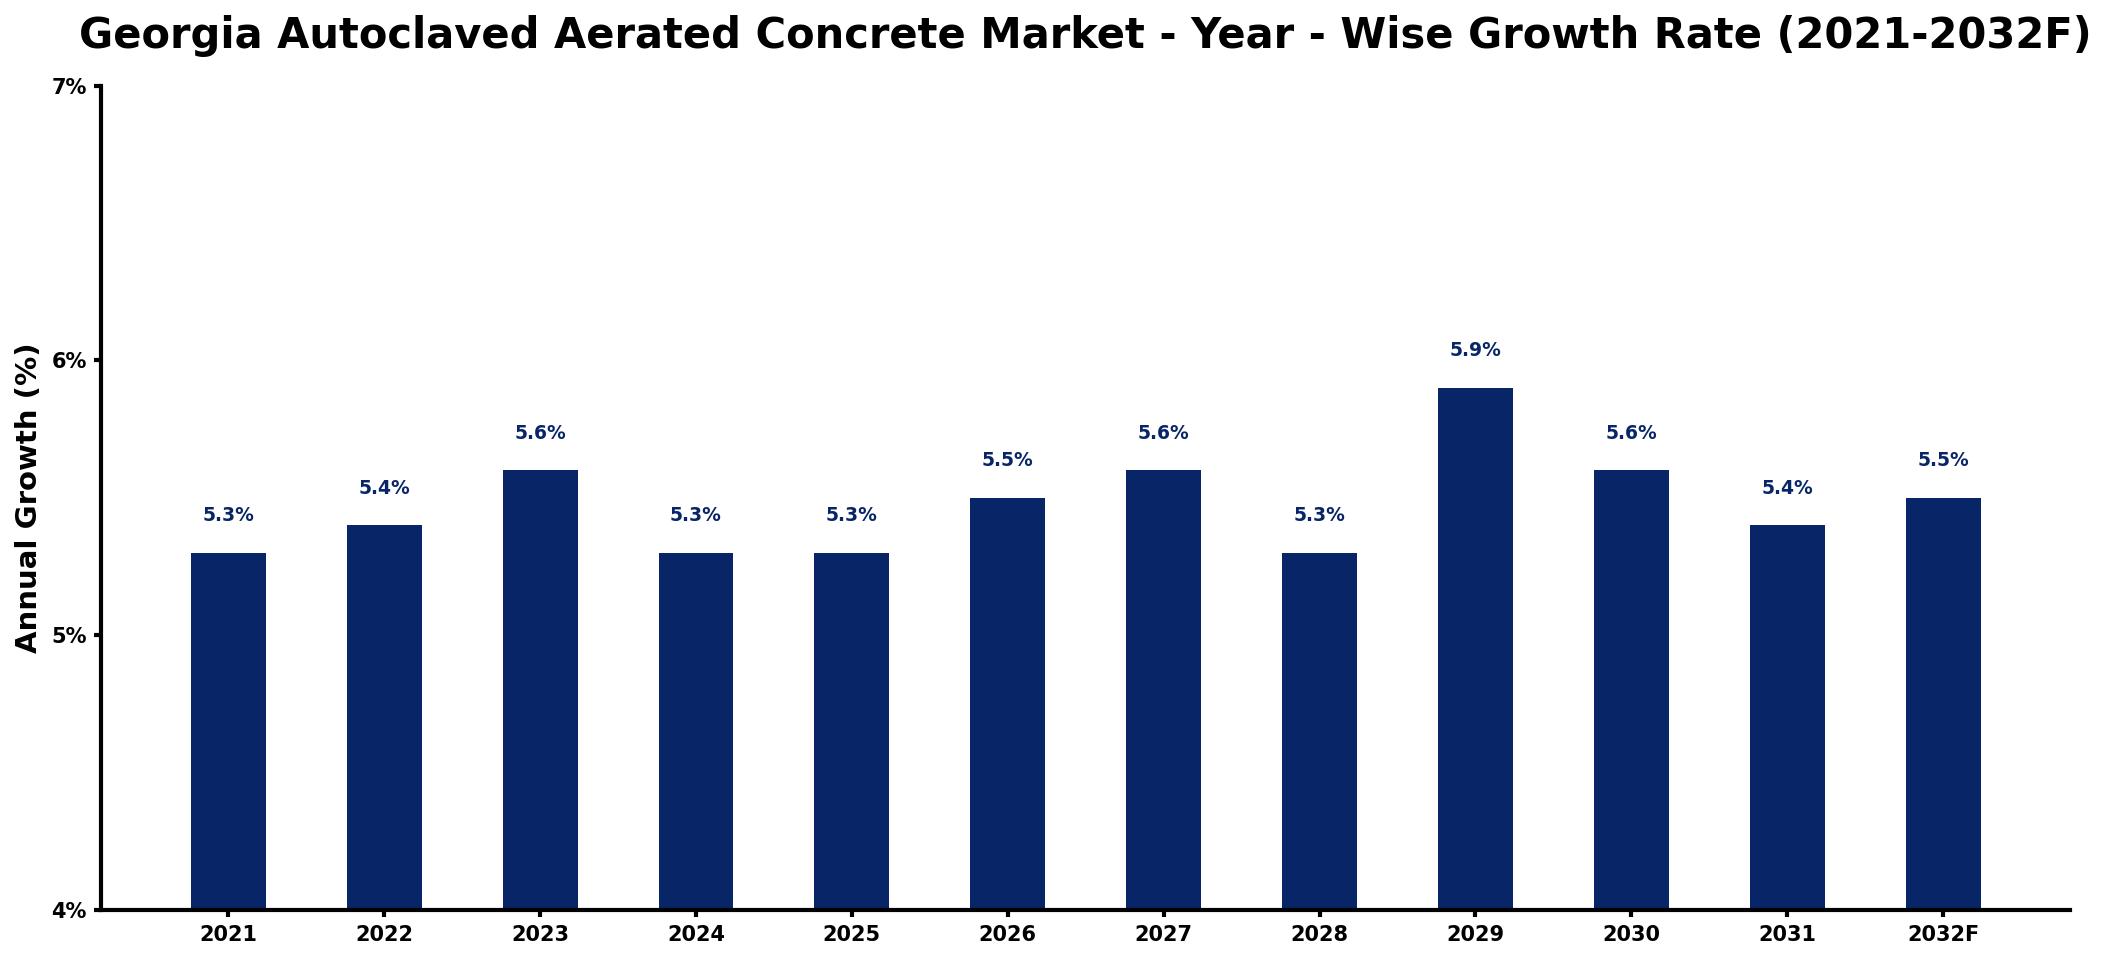
The table below presents the year‑wise growth rates along with the key drivers influencing the market
| Year | Growth Rate | Major Drivers |
| 2021 | 5.3% | Rising construction activity levels |
| 2022 | 5.4% | Growing demand for sustainable materials |
| 2023 | 5.6% | Increased investment in infrastructure projects |
| 2024 | 5.3% | Surge in residential building permits |
| 2025 | 5.3% | Expansion of commercial construction projects |
| 2026 | 5.5% | Heightened awareness of energy efficiency |
| 2027 | 5.6% | Growing popularity of prefabricated solutions |
| 2028 | 5.3% | Increase in government construction initiatives |
| 2029 | 5.9% | Rising urbanization and population growth |
| 2030 | 5.6% | growing regional consumption patterns |
| 2031 | 5.4% | rising demand from electronics |
| 2032 | 5.5% | increased capital investment inflows |
Note: Market size estimations and growth projections presented in this report are based on 6Wresearch's proprietary forecasting methodology, utilizing the latest available industry data, government publications, and primary research inputs.
Georgia Autoclaved Aerated Concrete Market Synopsis
The Georgia Autoclaved Aerated Concrete (AAC) market has recently gained momentum, bolstered by an increasing preference for lightweight and energy-efficient construction materials. Looking ahead, this trend is expected to evolve further, with the AAC market poised for significant growth as consumers and builders seek alternatives to traditional materials.
As the demand for sustainable construction solutions escalates, AAC is emerging as a front-runner. Its advantageous properties, such as excellent thermal insulation and fire resistance, are enticing developers and homeowners alike, setting the stage for continued market expansion in Georgia.
Georgia Autoclaved Aerated Concrete Market Key Takeaways
- The market is witnessing a shift towards sustainable construction solutions.
- Government regulations are increasingly promoting the use of AAC in building practices.
- Growing awareness regarding energy conservation is driving demand.
- Despite challenges, expanding distribution channels are essential for market growth.
- Investors can find promising opportunities in AAC production and distribution.
Evaluation of Restraints in Georgia Autoclaved Aerated Concrete Market
Despite its potential, the Georgia AAC market faces several restraints that may hinder growth. Limited awareness and understanding of AAC among builders and consumers can lead to slower adoption rates compared to more conventional building materials. Additionally, the upfront costs associated with AAC products, combined with the requirement for specialized installation equipment, may deter some potential users. These challenges are compounded by competition from established materials such as traditional concrete and bricks, and inconsistent availability can further complicate market penetration. To navigate these barriers, effective education and outreach efforts are vital in communicating AAC's long-term cost benefits and superior performance.
Georgia Autoclaved Aerated Concrete Market Trends
Current trends in the Georgia AAC market underscore a growing preference for environmentally friendly building materials. Builders are increasingly adopting AAC for its lightweight properties and exceptional thermal insulation, both of which contribute to enhanced energy efficiency. Moreover, the market is seeing a surge in innovative product offerings aimed at meeting specific customer needs. The focus on green building certifications and compliance with energy-efficient guidelines further reinforces the position of AAC as a material of choice in contemporary construction projects.
Georgia Autoclaved Aerated Concrete Market Opportunities
The Georgia AAC market is ripe with investment opportunities, especially as the demand for eco-friendly construction materials continues to rise. Investors can capitalize on the establishment of AAC production facilities to meet local needs, enhancing supply chains and distribution networks. Furthermore, advancements in technology related to AAC manufacturing present avenues for innovation that could further stimulate market growth. Government-backed initiatives aimed at reducing carbon footprints will only bolster the relevance of AAC in future construction practices.
Government Initiatives in the Georgia Autoclaved Aerated Concrete Market
The government of Georgia has implemented various initiatives to bolster the Autoclaved Aerated Concrete (AAC) market. Policies are focused on encouraging the use of sustainable building materials by offering financial incentives, tax breaks, and subsidies for projects utilizing AAC. Additionally, regulations ensure compliance with quality standards while promoting the integration of energy-efficient solutions in the construction sector. These measures aim to lower carbon emissions and enhance the overall sustainability of building practices across the state.
Future Insights of the Georgia Autoclaved Aerated Concrete Market
Looking towards 2026-2032, the Georgia AAC market is expected to flourish as awareness of sustainability increases among both consumers and builders. The focus on reducing carbon footprints, coupled with government support for green initiatives, will further cement AAC's role in construction. The growing need for affordable housing solutions, alongside the push for energy-efficient buildings, positions AAC favorably in the competitive landscape, promising a robust future for this innovative material.
Georgia Autoclaved Aerated Concrete Market Latest Developments (2025 - 2026)
In recent months, the Georgia AAC market has seen a notable shift towards enhanced production technologies and improved product offerings. Manufacturers are increasingly investing in R&D to optimize AAC formulations, which can lead to better performance metrics, such as enhanced insulation properties and lower environmental impact. Moreover, strategic partnerships are being forged to broaden distribution channels, ensuring that AAC products become more accessible to a wider audience. These developments signal a promising direction for the market as it aligns with broader construction industry trends.
Georgia Autoclaved Aerated Concrete Market - Key Attractiveness of the Report
- 10 Years of Market Numbers
- Historical Data Starting from 2022 to 2025
- Base Year: 2025
- Forecast Data until 2032
- Key Performance Indicators Impacting the Market
- Major Upcoming Developments and Projects
Key Highlights of the Report:
- Georgia Autoclaved Aerated Concrete Market Outlook
- Market Size of Georgia Autoclaved Aerated Concrete Market, 2025
- Forecast of Georgia Autoclaved Aerated Concrete Market, 2032
- Historical Data and Forecast of Georgia Autoclaved Aerated Concrete Revenues & Volume for the Period 2022-2032F
- Georgia Autoclaved Aerated Concrete Market Trend Evolution
- Georgia Autoclaved Aerated Concrete Market Drivers and Challenges
- Georgia Autoclaved Aerated Concrete Price Trends
- Georgia Autoclaved Aerated Concrete Porter's Five Forces
- Georgia Autoclaved Aerated Concrete Industry Life Cycle
- Historical Data and Forecast of Georgia Autoclaved Aerated Concrete Market Revenues & Volume By Product Type for the Period 2022-2032F
- Historical Data and Forecast of Georgia Autoclaved Aerated Concrete Market Revenues & Volume By Blocks for the Period 2022-2032F
- Historical Data and Forecast of Georgia Autoclaved Aerated Concrete Market Revenues & Volume By Others for the Period 2022-2032F
- Historical Data and Forecast of Georgia Autoclaved Aerated Concrete Market Revenues & Volume By End User for the Period 2022-2032F
- Historical Data and Forecast of Georgia Autoclaved Aerated Concrete Market Revenues & Volume By Residential for the Period 2022-2032F
- Historical Data and Forecast of Georgia Autoclaved Aerated Concrete Market Revenues & Volume By Non-residential for the Period 2022-2032F
- Historical Data and Forecast of Georgia Autoclaved Aerated Concrete Market Revenues & Volume By Application for the Period 2022-2032F
- Historical Data and Forecast of Georgia Autoclaved Aerated Concrete Market Revenues & Volume By Walls for the Period 2022-2032F
- Historical Data and Forecast of Georgia Autoclaved Aerated Concrete Market Revenues & Volume By Floors & Roofs for the Period 2022-2032F
- Historical Data and Forecast of Georgia Autoclaved Aerated Concrete Market Revenues & Volume By Others for the Period 2022-2032F
- Georgia Autoclaved Aerated Concrete Import Export Trade Statistics
- Market Opportunity Assessment By Product Type
- Market Opportunity Assessment By End User
- Market Opportunity Assessment By Application
- Georgia Autoclaved Aerated Concrete Top Companies Market Share
- Georgia Autoclaved Aerated Concrete Competitive Benchmarking By Technical and Operational Parameters
- Georgia Autoclaved Aerated Concrete Company Profiles
- Georgia Autoclaved Aerated Concrete Key Strategic Recommendations
Frequently Asked Questions About the Market Study (FAQs):
The growth of the AAC market in Georgia is largely propelled by increasing demand for sustainable building materials, government incentives for green construction practices, and a rising focus on energy efficiency among builders and homeowners.
The Georgia Autoclaved Aerated Concrete Market is projected to reach USD 373 Million by 2032, growing at a CAGR of 4.7% from an estimated USD 271 Million in 2025.
Key challenges include limited awareness among consumers and builders, higher initial costs compared to traditional materials, and competition from more established construction materials like concrete and bricks.
The government has introduced policies that incentivize the use of AAC in construction projects through financial aid, tax breaks, and regulatory support aimed at enhancing energy efficiency and sustainability.
Innovations include advancements in production technology that improve performance metrics such as thermal insulation and fire resistance, as well as new product developments tailored to meet specific market needs.
6Wresearch actively monitors the Georgia Autoclaved Aerated Concrete Market and publishes its comprehensive annual report, highlighting emerging trends, growth drivers, revenue analysis, and forecast outlook. Our insights help businesses to make data-backed strategic decisions with ongoing market dynamics. Our analysts track relevent industries related to the Georgia Autoclaved Aerated Concrete Market, allowing our clients with actionable intelligence and reliable forecasts tailored to emerging regional needs.
Yes, we provide customisation as per your requirements. To learn more, feel free to contact us on sales@6wresearch.com
1 Executive Summary |
2 Introduction |
2.1 Key Highlights of the Report |
2.2 Report Description |
2.3 Market Scope & Segmentation |
2.4 Research Methodology |
2.5 Assumptions |
3 Georgia Autoclaved Aerated Concrete Market Overview |
3.1 Georgia Country Macro Economic Indicators |
3.2 Georgia Autoclaved Aerated Concrete Market Revenues & Volume, 2022 & 2032F |
3.3 Georgia Autoclaved Aerated Concrete Market - Industry Life Cycle |
3.4 Georgia Autoclaved Aerated Concrete Market - Porter's Five Forces |
3.5 Georgia Autoclaved Aerated Concrete Market Revenues & Volume Share, By Product Type, 2022 & 2032F |
3.6 Georgia Autoclaved Aerated Concrete Market Revenues & Volume Share, By End User, 2022 & 2032F |
3.7 Georgia Autoclaved Aerated Concrete Market Revenues & Volume Share, By Application, 2022 & 2032F |
4 Georgia Autoclaved Aerated Concrete Market Dynamics |
4.1 Impact Analysis |
4.2 Market Drivers |
4.2.1 Increasing demand for sustainable and energy-efficient construction materials |
4.2.2 Growing construction activities in Georgia |
4.2.3 Favorable government regulations promoting the use of eco-friendly building materials |
4.3 Market Restraints |
4.3.1 High initial investment cost for setting up autoclaved aerated concrete production facilities |
4.3.2 Limited awareness and adoption of autoclaved aerated concrete among consumers and builders in Georgia |
5 Georgia Autoclaved Aerated Concrete Market Trends |
6 Georgia Autoclaved Aerated Concrete Market, By Types |
6.1 Georgia Autoclaved Aerated Concrete Market, By Product Type |
6.1.1 Overview and Analysis |
6.1.2 Georgia Autoclaved Aerated Concrete Market Revenues & Volume, By Product Type, 2022-2032F |
6.1.3 Georgia Autoclaved Aerated Concrete Market Revenues & Volume, By Blocks, 2022-2032F |
6.1.4 Georgia Autoclaved Aerated Concrete Market Revenues & Volume, By Others, 2022-2032F |
6.2 Georgia Autoclaved Aerated Concrete Market, By End User |
6.2.1 Overview and Analysis |
6.2.2 Georgia Autoclaved Aerated Concrete Market Revenues & Volume, By Residential, 2022-2032F |
6.2.3 Georgia Autoclaved Aerated Concrete Market Revenues & Volume, By Non-residential, 2022-2032F |
6.3 Georgia Autoclaved Aerated Concrete Market, By Application |
6.3.1 Overview and Analysis |
6.3.2 Georgia Autoclaved Aerated Concrete Market Revenues & Volume, By Walls, 2022-2032F |
6.3.3 Georgia Autoclaved Aerated Concrete Market Revenues & Volume, By Floors & Roofs, 2022-2032F |
6.3.4 Georgia Autoclaved Aerated Concrete Market Revenues & Volume, By Others, 2022-2032F |
7 Georgia Autoclaved Aerated Concrete Market Import-Export Trade Statistics |
7.1 Georgia Autoclaved Aerated Concrete Market Export to Major Countries |
7.2 Georgia Autoclaved Aerated Concrete Market Imports from Major Countries |
8 Georgia Autoclaved Aerated Concrete Market Key Performance Indicators |
8.1 Energy efficiency rating of autoclaved aerated concrete compared to traditional building materials |
8.2 Number of construction projects incorporating autoclaved aerated concrete in Georgia |
8.3 Percentage increase in autoclaved aerated concrete production capacity in the region |
8.4 Average cost savings achieved by using autoclaved aerated concrete in construction projects |
8.5 Environmental impact assessment of autoclaved aerated concrete production and usage in Georgia |
9 Georgia Autoclaved Aerated Concrete Market - Opportunity Assessment |
9.1 Georgia Autoclaved Aerated Concrete Market Opportunity Assessment, By Product Type, 2022 & 2032F |
9.2 Georgia Autoclaved Aerated Concrete Market Opportunity Assessment, By End User, 2022 & 2032F |
9.3 Georgia Autoclaved Aerated Concrete Market Opportunity Assessment, By Application, 2022 & 2032F |
10 Georgia Autoclaved Aerated Concrete Market - Competitive Landscape |
10.1 Georgia Autoclaved Aerated Concrete Market Revenue Share, By Companies, 2025 |
10.2 Georgia Autoclaved Aerated Concrete Market Competitive Benchmarking, By Operating and Technical Parameters |
11 Company Profiles |
12 Recommendations |
13 Disclaimer |
Global Go To Market Strategy - 2030
Export potential enables firms to identify high-growth global markets with greater confidence by combining advanced trade intelligence with a structured quantitative methodology. The framework analyzes emerging demand trends and country-level import patterns while integrating macroeconomic and trade datasets such as GDP and population forecasts, bilateral import–export flows, tariff structures, elasticity differentials between developed and developing economies, geographic distance, and import demand projections. Using weighted trade values from 2020–2024 as the base period to project country-to-country export potential for 2030, these inputs are operationalized through calculated drivers such as gravity model parameters, tariff impact factors, and projected GDP per-capita growth. Through an analysis of hidden potentials, demand hotspots, and market conditions that are most favorable to success, this method enables firms to focus on target countries, maximize returns, and global expansion with data, backed by accuracy.
By factoring in the projected importer demand gap that is currently unmet and could be potential opportunity, it identifies the potential for the Exporter (Country) among 190 countries, against the general trade analysis, which identifies the biggest importer or exporter.
To discover high-growth global markets and optimize your business strategy:
Click Here
Pricing
- Single User License$ 1,995
- Department License$ 2,400
- Site License$ 3,120
- Global License$ 3,795

Leadership Perspectives from Industry Events
Search
Thought Leadership and Analyst Meet


Our Clients
6WResearch In News
- India Air Conditioner Market Set for Strong Rebound in 2026 After Weather-Led Correction and GST-Driven Recovery: 6Wresearch
- ADAS in India: How Automatic Emergency Braking, Blind Spot Detection & Driver Monitoring are Transforming Road Safety
- Doha a strategic location for EV manufacturing hub: IPA Qatar
- Demand for luxury TVs surging in the GCC, says Samsung
- Empowering Growth: The Thriving Journey of Bangladesh’s Cable Industry
- Demand for luxury TVs surging in the GCC, says Samsung
Latest Reports
- Nicaragua RPG Gaming Market (2026-2032)
- New Zealand RPG Gaming Market (2026-2032)
- Netherlands RPG Gaming Market (2026-2032)
- Nauru RPG Gaming Market (2026-2032)
- Namibia RPG Gaming Market (2026-2032)
- Mozambique RPG Gaming Market (2026-2032)
- Montenegro RPG Gaming Market (2026-2032)
- Mongolia RPG Gaming Market (2026-2032)
- Monaco RPG Gaming Market (2026-2032)
- Micronesia RPG Gaming Market (2026-2032)
Industry Events and Analyst Meet

EV India Expo 2026

HIMTEX 2026

India Refining Summit 2026

India EV Show 2026

EV tech India Expo 2026
Whitepaper
- Middle East & Africa Commercial Security Market Click here to view more.
- Middle East & Africa Fire Safety Systems & Equipment Market Click here to view more.
- GCC Drone Market Click here to view more.
- Middle East Lighting Fixture Market Click here to view more.
- GCC Physical & Perimeter Security Market Click here to view more.