Georgia Chemical Packaging Market (2026-2032) | Share, Outlook, Revenue, Forecast, Growth, Companies, Trends, Value, Industry, Analysis & Size
Market Forecast By Product Types (Sacks, Drums, FIBC, Other), By Applications (Pharmaceutical Factory, Laboratory, Chemical Plant, Others) And Competitive Landscape
| Product Code: ETC006920 | Publication Date: Sep 2020 | Updated Date: Jun 2026 | Product Type: Report | |
| Publisher: 6Wresearch | Author: Ravi Bhandari | No. of Pages: 70 | No. of Figures: 35 | No. of Tables: 5 |
Georgia Chemical Packaging Market Summary
The georgia chemical packaging market was estimated at USD 157 Million in 2025 and is projected to reach USD 209 Million by 2032, growing at a CAGR of 4.6% from 2026 to 2032.
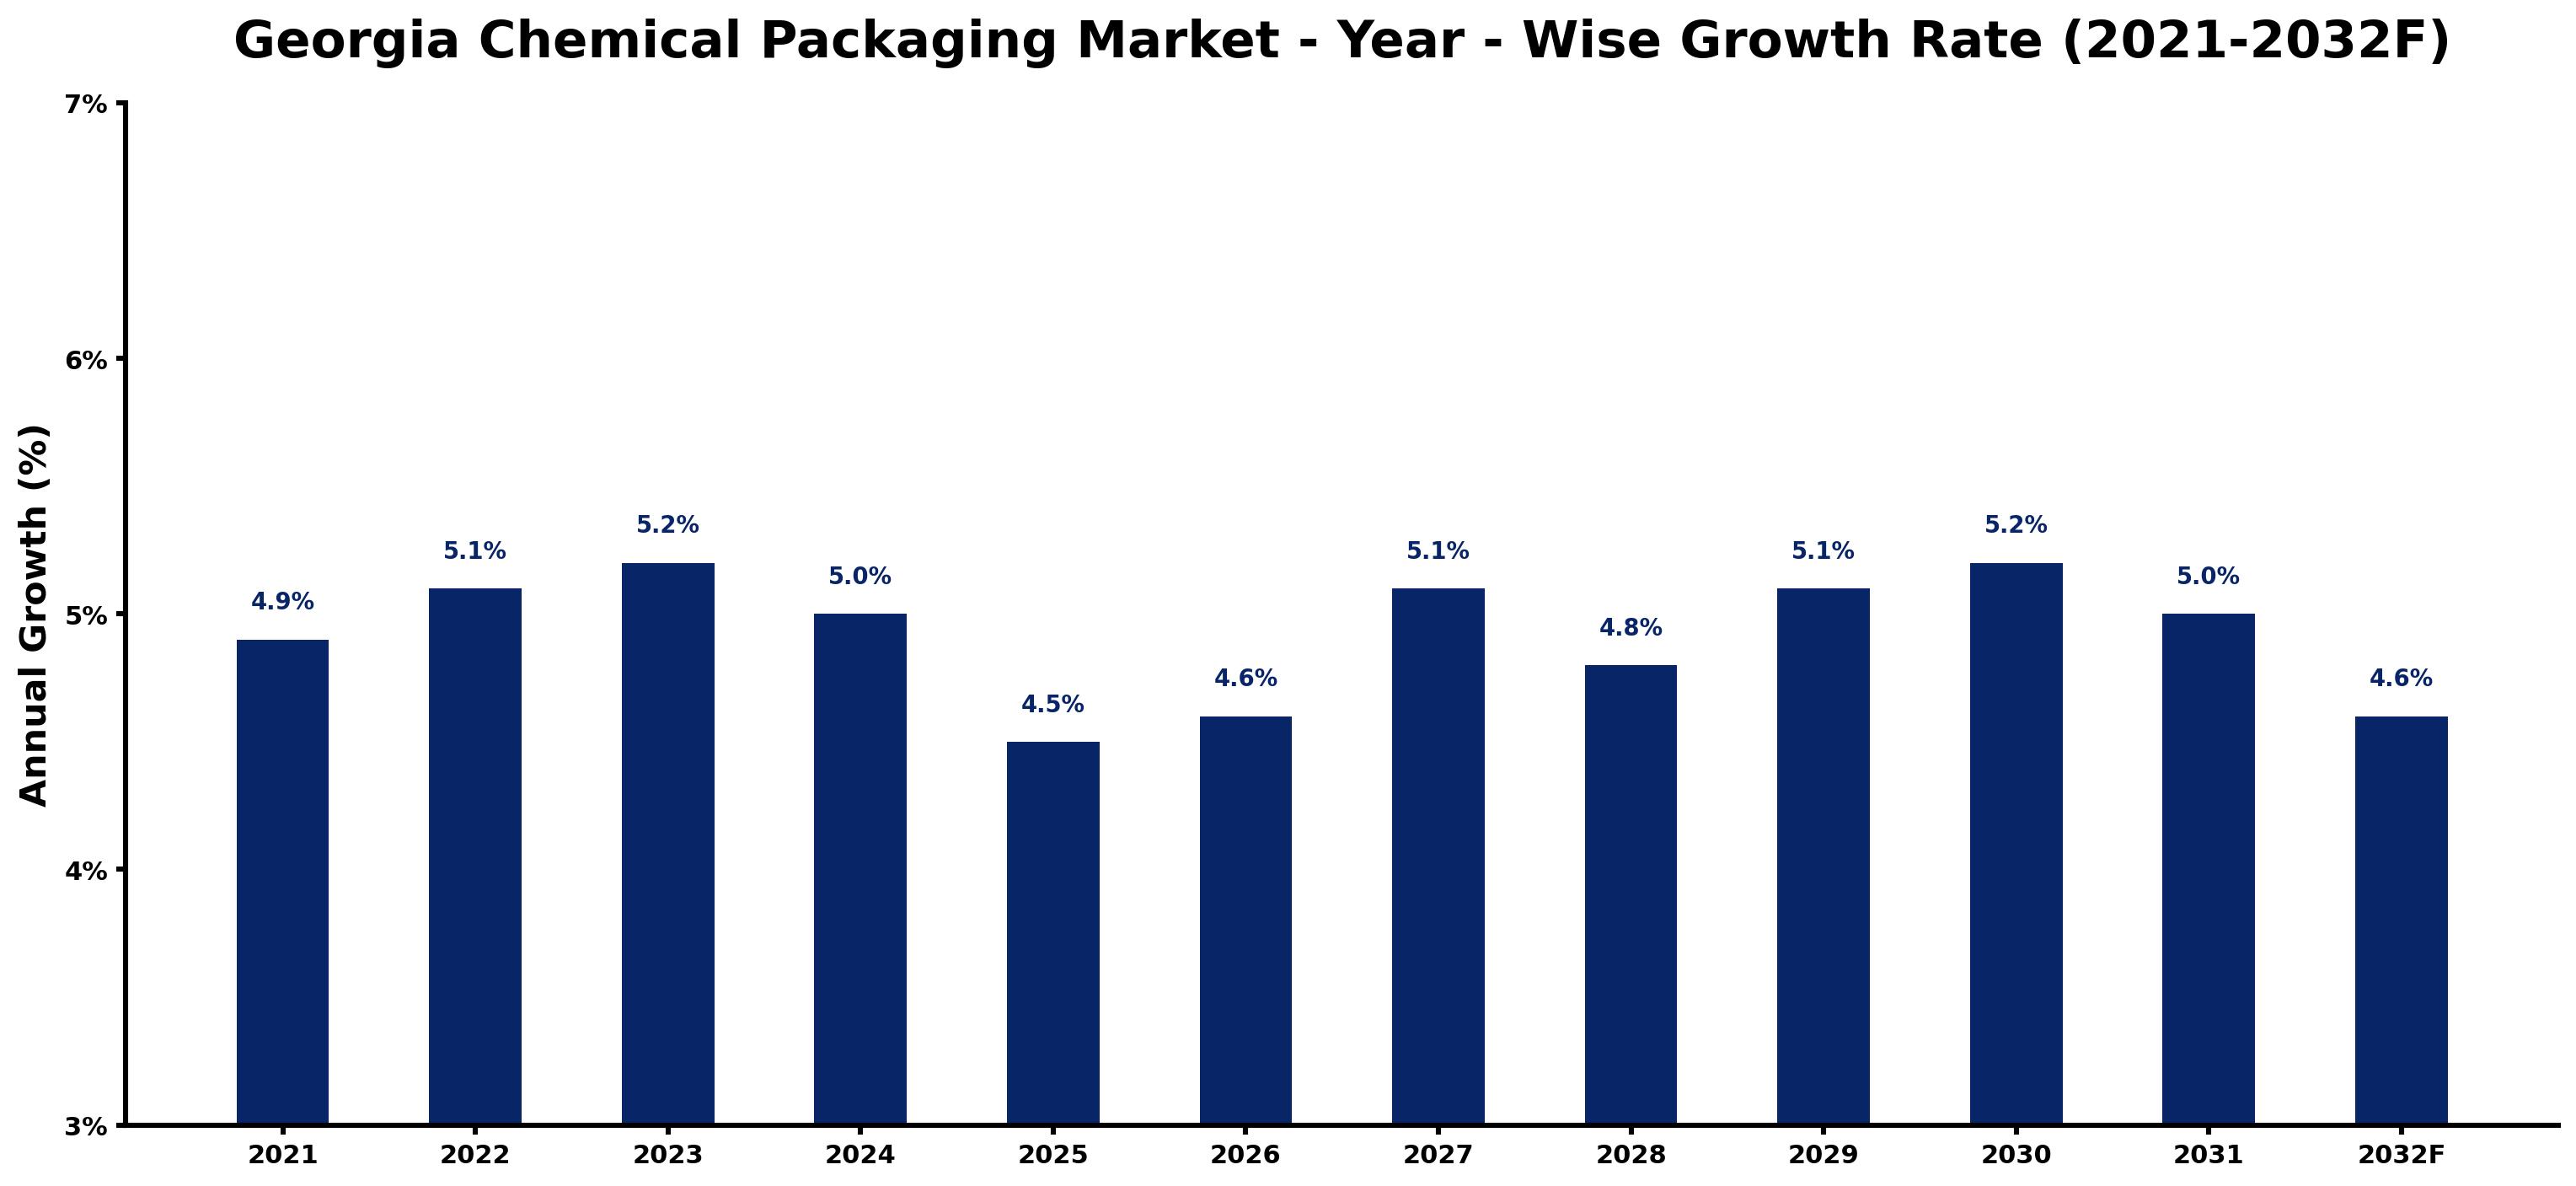
Georgia Chemical Packaging Market Growth Rate Analysis (2021-2032)
The Georgia Chemical Packaging market has exhibited stable growth, with a notable increase of 4.9% in 2021, rising to 5.1% in 2022 and further to 5.2% in 2023. This gradual upward trend can be attributed to rising consumer demand, innovation in packaging technology, and ongoing investments in infrastructure. Despite a slight dip forecasted for 2024 at 5.0%, the market is expected to rebound to 4.6% by 2025, reflecting a resilient adaptation to evolving environmental regulations and the energy transition. By 2030, growth is projected to stabilize again around 5.2%, driven by digitalization efforts and enhanced supply chain efficiencies. This trajectory underscores the sector's robustness amidst shifting market dynamics.
Georgia Chemical Packaging Market Year-wise Growth Rate and Key Drivers
This graph highlights how the Georgia Chemical Packaging Market has steadily grown over the past five years, supported by major growth factors.
The table below presents the year wise growth rates along with the key drivers influencing the market
| Year | Growth Rate | Major Drivers |
| 2021 | 4.9% | Post-lockdown retail projects significantly boosted packaging needs in Georgia's chemical sector. |
| 2022 | 5.1% | Emerging e-commerce platforms demanded innovative packaging solutions tailored for chemicals. |
| 2023 | 5.2% | Sustainability trends prompted a shift towards eco-friendly packaging materials in Georgia. |
| 2024 | 5.0% | Local manufacturers began integrating smart packaging technologies for real-time monitoring. |
| 2025 | 4.5% | Increased demand for specialty chemicals spurred diverse packaging requirements across industries. |
| 2026 | 4.6% | Georgia's logistics infrastructure improvements enhanced distribution efficiency for chemical packaging. |
| 2027 | 5.1% | Collaboration with tech firms led to advanced designs optimizing chemical product safety. |
| 2028 | 4.8% | Rising export activities required compliance with international packaging standards for chemicals. |
| 2029 | 5.1% | Consumer preferences shifted towards recyclable materials, affecting packaging supplier strategies. |
| 2030 | 5.2% | Investment in automation technologies transformed packaging processes, reducing labor costs significantly. |
| 2031 | 5.0% | Market consolidation among packaging suppliers increased competition and innovation in solutions. |
| 2032 | 4.6% | Focus on regional sustainability initiatives stimulated the growth of green packaging practices. |
Note - Market size estimations and growth projections presented in this report are based on 6Wresearch's advanced forecasting approach, validated with industry datasets as of June 2026.
Georgia Chemical Packaging Market Synopsis
The Georgia Chemical Packaging Market is projected to reach 4.6% and witness significant growth during the forecast period (2026-2032). This growth is primarily driven by the increasing demand for both secure and efficient packaging solutions across various sectors of the chemical industry. As companies strive to ensure product integrity, safety, and compliance with regulatory requirements, the importance of specialized packaging continues to rise. Georgia's strategic position as a hub for chemical manufacturing positions its packaging sector for considerable expansion, reflecting the broader trends in the chemical industry.
Georgia Chemical Packaging Market Growth Drivers
The Georgia Chemical Packaging Market is witnessing growth driven by several key factors:
- The increasing production of chemicals, including hazardous materials, necessitates highly regulated packaging solutions that ensure safe storage and transport.
- Georgia's robust manufacturing sector provides fertile ground for the demand for specialized packaging, catering to the unique needs of chemical manufacturers and distributors.
- Innovations in packaging technology, including advanced materials and designs, are enhancing the safety and effectiveness of chemical packaging.
- The growing emphasis on sustainability is prompting manufacturers to invest in eco-friendly packaging solutions, contributing to market growth.
- Collaboration among stakeholders in the chemical supply chain is strengthening the provision of comprehensive packaging solutions that adhere to industry standards and regulatory compliance.
Georgia Chemical Packaging Market Challenges and Restraints
Despite its growth potential, the Georgia Chemical Packaging Market faces significant challenges:
- Stringent safety and environmental regulations demand compliance from manufacturers, which can complicate production processes and increase costs.
- Maintaining product integrity during transportation and storage is critical; any failures in packaging can lead to serious safety and financial repercussions.
- Price volatility in raw materials poses a challenge for manufacturers striving to control production costs while maintaining quality.
- Supply chain disruptions can lead to delays in obtaining materials necessary for packaging, affecting production timelines and market competitiveness.
- The need for consistent quality and reliability in packaging solutions requires investment in advanced quality control measures and technology, placing additional pressure on manufacturers.
Georgia Chemical Packaging Market Trends and Opportunities
The future of the Georgia Chemical Packaging Market is marked by several emerging trends and opportunities:
- There is a notable shift towards sustainable packaging practices, aligning with global initiatives to reduce environmental impact and enhance recyclability.
- Increased adoption of smart packaging technologies, including IoT solutions that monitor conditions during transit, presents significant opportunities for enhancing product safety and compliance.
- Expansion into e-commerce and online distribution channels is generating demand for versatile packaging solutions that accommodate various shipping methods.
- The integration of regulatory compliance into packaging design and production processes is fostering innovation and improving market resilience.
- Focus on customization in packaging solutions allows companies to tailor offerings to specific market needs, enhancing competitiveness in the Georgia market.
Georgia Chemical Packaging Market Government Investment and Initiatives
Government policies and initiatives play a crucial role in shaping the Georgia Chemical Packaging Market:
- Regulatory frameworks governing the handling and packaging of hazardous materials ensure that safety and environmental standards are upheld throughout the supply chain.
- Public investment in infrastructure improvements and waste management initiatives supports the development of sustainable chemical packaging solutions.
- Incentives for companies adopting eco-friendly practices encourage innovation in packaging design and materials.
- Government-sponsored research and development initiatives are fostering advancements in packaging technology, enabling manufacturers to meet evolving market demands.
- Collaboration between governmental agencies and industry stakeholders promotes a shared understanding of best practices in chemical packaging, further solidifying the market's foundation.
Georgia Chemical Packaging Market Latest Developments (May 2025 - June 2026)
In the latest developments concerning the Georgia Chemical Packaging Market, there has been a prominent focus on advancing sustainable packaging solutions. Manufacturers are increasingly prioritizing eco-friendly materials and innovative designs to align with environmental regulations and consumer preferences. Additionally, technological integration is gaining traction, with smart packaging systems enhancing traceability and safety during the transportation of chemicals. Collaborative efforts between industry stakeholders have also intensified, aimed at addressing shared challenges and leveraging collective expertise to foster market growth. These trends indicate a robust evolution within the market as it adapts to the changing landscape and regulatory requirements.
Georgia Chemical Packaging Market - Key Attractiveness of the Report
- 10 Years of Market Numbers
- Historical Data Starting from 2022 to 2025
- Base Year: 2025
- Forecast Data until 2032
- Key Performance Indicators Impacting the Market
- Major Upcoming Developments and Projects
Key Highlights of the Report:
- Georgia Chemical Packaging Market Outlook
- Market Size of Georgia Chemical Packaging Market, 2025
- Forecast of Georgia Chemical Packaging Market, 2032
- Historical Data and Forecast of Georgia Chemical Packaging Revenues & Volume for the Period 2022-2032F
- Georgia Chemical Packaging Market Trend Evolution
- Georgia Chemical Packaging Market Drivers and Challenges
- Georgia Chemical Packaging Price Trends
- Georgia Chemical Packaging Porter's Five Forces
- Georgia Chemical Packaging Industry Life Cycle
- Historical Data and Forecast of Georgia Chemical Packaging Market Revenues & Volume By Product Types for the Period 2022-2032F
- Historical Data and Forecast of Georgia Chemical Packaging Market Revenues & Volume By Sacks for the Period 2022-2032F
- Historical Data and Forecast of Georgia Chemical Packaging Market Revenues & Volume By Drums for the Period 2022-2032F
- Historical Data and Forecast of Georgia Chemical Packaging Market Revenues & Volume By FIBC for the Period 2022-2032F
- Historical Data and Forecast of Georgia Chemical Packaging Market Revenues & Volume By Other for the Period 2022-2032F
- Historical Data and Forecast of Georgia Chemical Packaging Market Revenues & Volume By Applications for the Period 2022-2032F
- Historical Data and Forecast of Georgia Chemical Packaging Market Revenues & Volume By Pharmaceutical Factory? for the Period 2022-2032F
- Historical Data and Forecast of Georgia Chemical Packaging Market Revenues & Volume By Laboratory for the Period 2022-2032F
- Historical Data and Forecast of Georgia Chemical Packaging Market Revenues & Volume By Chemical Plant? for the Period 2022-2032F
- Historical Data and Forecast of Georgia Chemical Packaging Market Revenues & Volume By Others for the Period 2022-2032F
- Georgia Chemical Packaging Import Export Trade Statistics
- Market Opportunity Assessment By Product Types
- Market Opportunity Assessment By Applications
- Georgia Chemical Packaging Top Companies Market Share
- Georgia Chemical Packaging Competitive Benchmarking By Technical and Operational Parameters
- Georgia Chemical Packaging Company Profiles
- Georgia Chemical Packaging Key Strategic Recommendations
Frequently Asked Questions About the Market Study (FAQs):
The growth is primarily driven by the increasing demand for secure and efficient packaging solutions, the expansion of the chemical manufacturing sector, and advancements in sustainability and technology.
Key challenges include stringent regulatory compliance, maintaining product integrity, fluctuating raw material prices, and supply chain disruptions.
Government policies focused on safety, environmental standards, and incentives for sustainable practices are shaping the design and production of chemical packaging solutions.
Recent trends include a shift towards sustainable packaging, increased use of smart technologies, and a growing emphasis on customization in packaging solutions.
6Wresearch actively monitors the Georgia Chemical Packaging Market and publishes its comprehensive annual report, highlighting emerging trends, growth drivers, revenue analysis, and forecast outlook. Our insights help businesses to make data-backed strategic decisions with ongoing market dynamics. Our analysts track relevent industries related to the Georgia Chemical Packaging Market, allowing our clients with actionable intelligence and reliable forecasts tailored to emerging regional needs.
Yes, we provide customisation as per your requirements. To learn more, feel free to contact us on sales@6wresearch.com
1 Executive Summary |
2 Introduction |
2.1 Key Highlights of the Report |
2.2 Report Description |
2.3 Market Scope & Segmentation |
2.4 Research Methodology |
2.5 Assumptions |
3 Georgia Chemical Packaging Market Overview |
3.1 Georgia Country Macro Economic Indicators |
3.2 Georgia Chemical Packaging Market Revenues & Volume, 2022 & 2032F |
3.3 Georgia Chemical Packaging Market - Industry Life Cycle |
3.4 Georgia Chemical Packaging Market - Porter's Five Forces |
3.5 Georgia Chemical Packaging Market Revenues & Volume Share, By Product Types, 2022 & 2032F |
3.6 Georgia Chemical Packaging Market Revenues & Volume Share, By Applications, 2022 & 2032F |
4 Georgia Chemical Packaging Market Dynamics |
4.1 Impact Analysis |
4.2 Market Drivers |
4.3 Market Restraints |
5 Georgia Chemical Packaging Market Trends |
6 Georgia Chemical Packaging Market, By Types |
6.1 Georgia Chemical Packaging Market, By Product Types |
6.1.1 Overview and Analysis |
6.1.2 Georgia Chemical Packaging Market Revenues & Volume, By Product Types, 2022-2032F |
6.1.3 Georgia Chemical Packaging Market Revenues & Volume, By Sacks, 2022-2032F |
6.1.4 Georgia Chemical Packaging Market Revenues & Volume, By Drums, 2022-2032F |
6.1.5 Georgia Chemical Packaging Market Revenues & Volume, By FIBC, 2022-2032F |
6.1.6 Georgia Chemical Packaging Market Revenues & Volume, By Other, 2022-2032F |
6.2 Georgia Chemical Packaging Market, By Applications |
6.2.1 Overview and Analysis |
6.2.2 Georgia Chemical Packaging Market Revenues & Volume, By Pharmaceutical Factory , 2022-2032F |
6.2.3 Georgia Chemical Packaging Market Revenues & Volume, By Laboratory, 2022-2032F |
6.2.4 Georgia Chemical Packaging Market Revenues & Volume, By Chemical Plant , 2022-2032F |
6.2.5 Georgia Chemical Packaging Market Revenues & Volume, By Others, 2022-2032F |
7 Georgia Chemical Packaging Market Import-Export Trade Statistics |
7.1 Georgia Chemical Packaging Market Export to Major Countries |
7.2 Georgia Chemical Packaging Market Imports from Major Countries |
8 Georgia Chemical Packaging Market Key Performance Indicators |
9 Georgia Chemical Packaging Market - Opportunity Assessment |
9.1 Georgia Chemical Packaging Market Opportunity Assessment, By Product Types, 2022 & 2032F |
9.2 Georgia Chemical Packaging Market Opportunity Assessment, By Applications, 2022 & 2032F |
10 Georgia Chemical Packaging Market - Competitive Landscape |
10.1 Georgia Chemical Packaging Market Revenue Share, By Companies, 2025 |
10.2 Georgia Chemical Packaging Market Competitive Benchmarking, By Operating and Technical Parameters |
11 Company Profiles |
12 Recommendations |
13 Disclaimer |
Global Go To Market Strategy - 2030
Export potential enables firms to identify high-growth global markets with greater confidence by combining advanced trade intelligence with a structured quantitative methodology. The framework analyzes emerging demand trends and country-level import patterns while integrating macroeconomic and trade datasets such as GDP and population forecasts, bilateral import–export flows, tariff structures, elasticity differentials between developed and developing economies, geographic distance, and import demand projections. Using weighted trade values from 2020–2024 as the base period to project country-to-country export potential for 2030, these inputs are operationalized through calculated drivers such as gravity model parameters, tariff impact factors, and projected GDP per-capita growth. Through an analysis of hidden potentials, demand hotspots, and market conditions that are most favorable to success, this method enables firms to focus on target countries, maximize returns, and global expansion with data, backed by accuracy.
By factoring in the projected importer demand gap that is currently unmet and could be potential opportunity, it identifies the potential for the Exporter (Country) among 190 countries, against the general trade analysis, which identifies the biggest importer or exporter.
To discover high-growth global markets and optimize your business strategy:
Click Here
Pricing
- Single User License$ 1,995
- Department License$ 2,400
- Site License$ 3,120
- Global License$ 3,795

Leadership Perspectives from Industry Events
Search
Thought Leadership and Analyst Meet


Our Clients
6WResearch In News
- India Air Conditioner Market Set for Strong Rebound in 2026 After Weather-Led Correction and GST-Driven Recovery: 6Wresearch
- ADAS in India: How Automatic Emergency Braking, Blind Spot Detection & Driver Monitoring are Transforming Road Safety
- Doha a strategic location for EV manufacturing hub: IPA Qatar
- Demand for luxury TVs surging in the GCC, says Samsung
- Empowering Growth: The Thriving Journey of Bangladesh’s Cable Industry
- Demand for luxury TVs surging in the GCC, says Samsung
Latest Reports
- Nicaragua RPG Gaming Market (2026-2032)
- New Zealand RPG Gaming Market (2026-2032)
- Netherlands RPG Gaming Market (2026-2032)
- Nauru RPG Gaming Market (2026-2032)
- Namibia RPG Gaming Market (2026-2032)
- Mozambique RPG Gaming Market (2026-2032)
- Montenegro RPG Gaming Market (2026-2032)
- Mongolia RPG Gaming Market (2026-2032)
- Monaco RPG Gaming Market (2026-2032)
- Micronesia RPG Gaming Market (2026-2032)
Industry Events and Analyst Meet

HIMTEX 2026

India Refining Summit 2026

India EV Show 2026

EV tech India Expo 2026

Auto Tech Asia 2026
Whitepaper
- Middle East & Africa Commercial Security Market Click here to view more.
- Middle East & Africa Fire Safety Systems & Equipment Market Click here to view more.
- GCC Drone Market Click here to view more.
- Middle East Lighting Fixture Market Click here to view more.
- GCC Physical & Perimeter Security Market Click here to view more.