Georgia Chlor Alkali Market (2026-2032) Outlook | Revenue, Share, Companies, Size, Forecast, Analysis, Growth, Trends, Value & Industry
Market Forecast By Product (Caustic Soda, Chlorine, Soda Ash), By Production Process (Membrane Cell, Diaphragm Cell, Other Production Processes), By Application (Pulp and Paper, Organic Chemical, Inorganic Chemical, Soap and Detergent, Alumina, Textile, Other ) And Competitive Landscape
| Product Code: ETC193032 | Publication Date: May 2022 | Updated Date: Jun 2026 | Product Type: Market Research Report | |
| Publisher: 6Wresearch | Author: Ravi Bhandari | No. of Pages: 60 | No. of Figures: 40 | No. of Tables: 7 |
Georgia Chlor Alkali Market Size, Share & Growth Rate
The Georgia Chlor Alkali Market was estimated at USD 433 Million in 2025 and is projected to reach USD 611 Million by 2032, growing at a CAGR of 5.0% from 2026 to 2032. This growth trajectory is largely fueled by the rising demand for essential chlor alkali products such as caustic soda and chlorine, integral to numerous sectors like textiles, pulp and paper, and water treatment. The state’s strategic geographic positioning and well-developed infrastructure further enhance its attractiveness for investment, promoting the expansion of production facilities across the region.
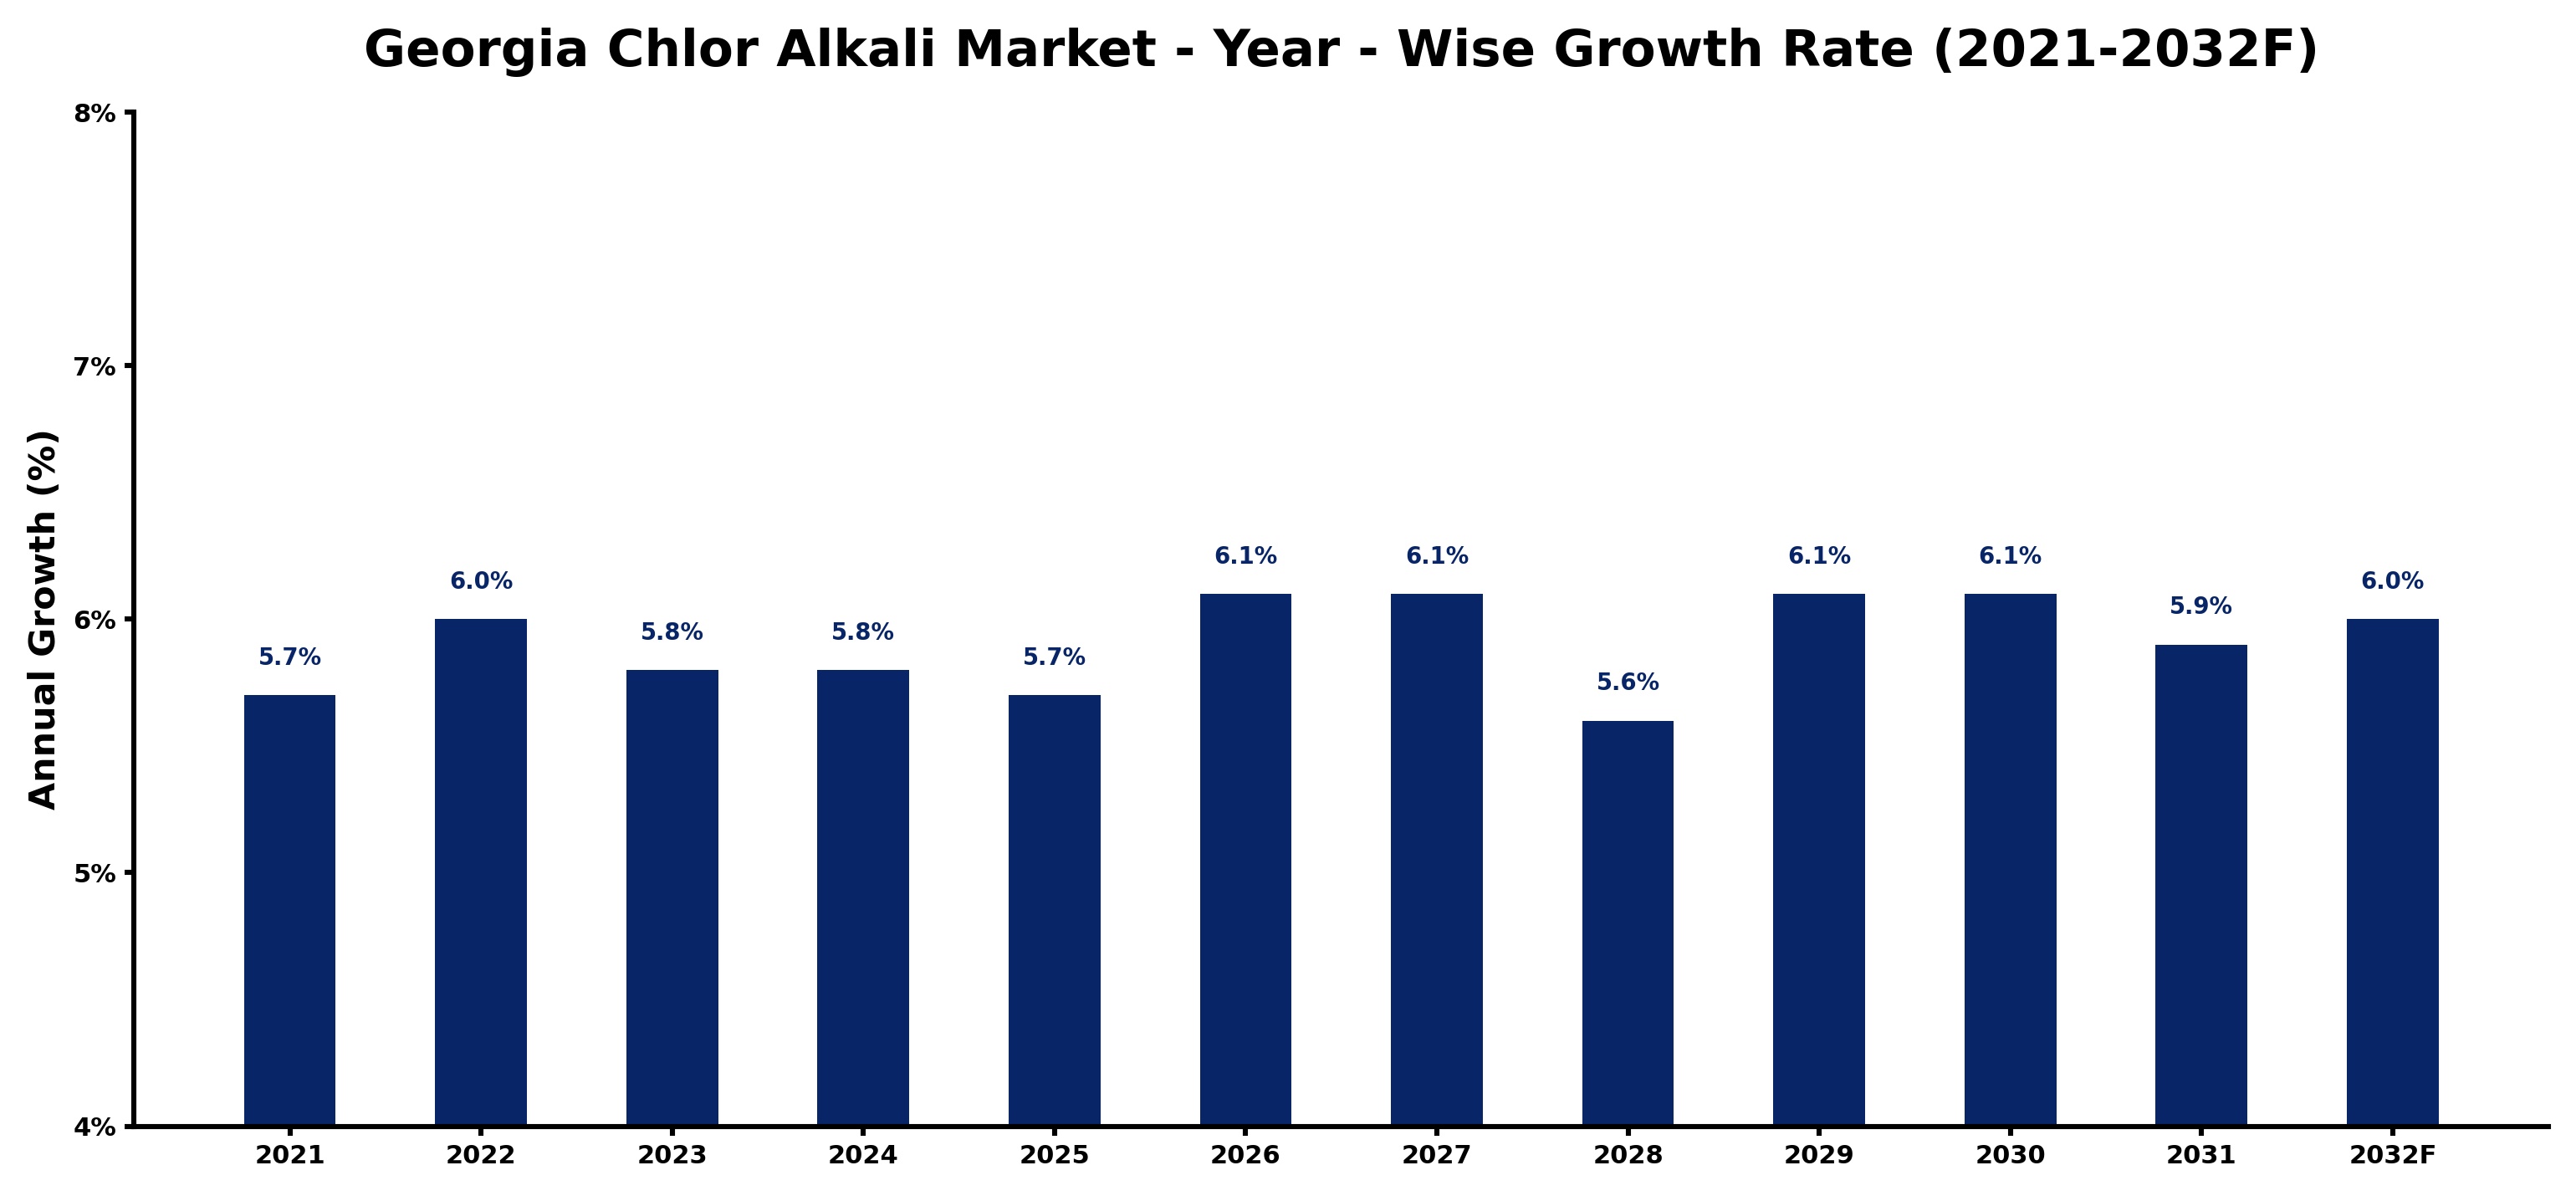
Georgia Chlor Alkali Market Growth Rate Analysis (2021-2032)
The Georgia Chlor Alkali market has shown promising growth with a steady rate of 5.7% in 2021, increasing to 6.0% in 2022, before stabilizing around 5.8% through 2024. This stability can be attributed to a growing consumer demand for chlorine-based products, driven by advancements in water treatment technologies and the expanding chemical manufacturing sector. Looking ahead, the market is expected to experience a slight uptick to 6.1% in 2026 and 2027, reflecting ongoing investments in sustainable production methods and infrastructure enhancements. However, by 2028 and 2029, growth is anticipated to moderate as market saturation and fluctuating energy costs come into play, but overall, the trend remains positively aligned with energy transition initiatives.
Georgia Chlor Alkali Market Year-wise Growth Rate and Key Drivers
This graph highlights how the Georgia Chlor Alkali Market has steadily grown over the past five years, supported by major growth factors.
The table below presents the year‑wise growth rates along with the key drivers influencing the market
| Year | Growth Rate | Major Drivers |
| 2021 | 5.7% | Increased demand for chlorine products |
| 2022 | 6.0% | Expansion of chemical manufacturing facilities |
| 2023 | 5.8% | Rising industrial applications of caustic |
| 2024 | 5.8% | Growth in water treatment initiatives |
| 2025 | 5.7% | Surge in demand for PVC |
| 2026 | 6.1% | Technological advancements in production |
| 2027 | 6.1% | Increased exports of chlor alkali |
| 2028 | 5.6% | Rising environmental regulations driving innovation |
| 2029 | 6.1% | Industrial activity supported growth |
| 2030 | 6.1% | Market expansion drove consumption |
| 2031 | 5.9% | Increased usage in pharmaceuticals sector |
| 2032 | 6.0% | Rising demand for eco-friendly products |
Note - Market size estimations and growth projections presented in this report are based on 6Wresearch’s advanced forecasting approach, validated with industry datasets as of June 2026.
Georgia Chlor Alkali Market Synopsis
The chlor alkali sector in Georgia plays a crucial role in supplying caustic soda, a key ingredient in the manufacturing processes of various industries. Specifically, the demand for caustic soda in water treatment applications is on the rise, driven by growing concerns over water quality and sustainability.
Additionally, the increasing production capacities of local manufacturers reflect the market's growth potential, as businesses strive to meet the burgeoning needs of the textile and chemicals industries. This dynamic interplay between supply and demand is shaping a robust market environment in Georgia.
Georgia Chlor Alkali Market Key Takeaways
- The market is benefiting from increased industrial activity, particularly in pulp and paper and water treatment.
- Environmental regulations are prompting producers to adopt sustainable practices while maintaining production efficiency.
- Georgia’s strategic location enhances logistical advantages, facilitating the transport of chlor alkali products.
- The competitive landscape is intensifying as local manufacturers face pressure from imported alternatives.
- Government policies are geared towards promoting growth and ensuring safety in chlor alkali production.
Evaluation of Restraints in Georgia Chlor Alkali Market
Despite the promising growth of the chlor alkali market in Georgia, several restraints pose challenges. Strict environmental regulations are at the forefront, requiring producers to invest significantly in compliance measures to meet increasingly stringent emission and waste management standards. These regulations can impact operational costs and affect pricing strategies. Moreover, the presence of competitive imported products often forces local manufacturers to enhance their efficiencies and maintain cost-effectiveness, adding further pressure on profit margins. Navigating these challenges while innovating and adhering to regulatory requirements will be pivotal for sustained growth.
Georgia Chlor Alkali Market Trends
Current trends within the Georgia chlor alkali market indicate a rising focus on sustainable production technologies and practices. Companies are increasingly investing in energy-efficient processes and waste minimization techniques to align with environmental standards and improve their market positioning. Moreover, digital transformation is becoming more prevalent, with manufacturers adopting data analytics and automation to enhance productivity and operational efficiency.
Furthermore, the heightened awareness surrounding water quality and chemical safety is pushing industries to rely more heavily on caustic soda and chlorine for effective water treatment solutions. This alignment of market demand with technological advancement and sustainability efforts is poised to redefine the landscape of the Georgia chlor alkali market.
Georgia Chlor Alkali Market Opportunities
The growth potential in the Georgia chlor alkali market is substantial, particularly through expanding production capabilities to cater to the textile and chemical sectors. Investment opportunities lie in developing environmentally friendly production methods that not only adhere to regulations but also appeal to a growing customer base demanding sustainability. There is also a significant opportunity for innovation in product offerings, especially in the context of specialty chemicals derived from chlor alkali processes.
Moreover, partnerships and collaborations among local manufacturers can help enhance market penetration and distribution efficiencies. Leveraging state incentives and government programs aimed at fostering sustainable industrial growth further positions investors favorably within this evolving market landscape.
Government Initiatives in the Georgia Chlor Alkali Market
The state government of Georgia has actively supported the chlor alkali market through initiatives designed to promote sustainable production practices. Policies encouraging investment in clean technologies and energy-efficient manufacturing are pivotal in shaping the operational landscape. Moreover, financial incentives for companies investing in sustainable practices reflect a commitment to balancing industrial growth with environmental stewardship. These efforts not only ensure the safety of production facilities but also enhance the overall competitiveness of the Georgia chlor alkali market.
Future Insights of the Georgia Chlor Alkali Market
Looking ahead to 2026-2032, the Georgia chlor alkali market is expected to experience significant advancements driven by continuous industrial expansion and technological innovations. With a projected increase in demand for caustic soda and chlorine, companies are likely to enhance production capabilities and improve their product offerings. The emphasis on sustainability will remain at the forefront, influencing operational practices and investments. As market dynamics evolve, stakeholders should remain agile to capitalize on emerging opportunities while adhering to evolving regulatory standards.
Georgia Chlor Alkali Market Latest Developments (May 2025 - June 2026)
Recent developments in the Georgia chlor alkali market indicate a focused shift towards adopting advanced manufacturing technologies. Industry players are beginning to implement more rigorous sustainability protocols to align with growing regulatory expectations. Additionally, there is a notable trend in companies seeking collaborations with research institutions to innovate product applications, particularly in water treatment and industrial processes. This evolution underscores a proactive approach to not only meet current demand but also anticipate future market needs.
Georgia Chlor Alkali Market - Key Attractiveness of the Report
- 10 Years of Market Numbers
- Historical Data Starting from 2022 to 2025
- Base Year: 2025
- Forecast Data until 2032
- Key Performance Indicators Impacting the Market
- Major Upcoming Developments and Projects
Key Highlights of the Report:
- Georgia Chlor Alkali Market Outlook
- Market Size of Georgia Chlor Alkali Market, 2025
- Forecast of Georgia Chlor Alkali Market, 2032
- Historical Data and Forecast of Georgia Chlor Alkali Revenues & Volume for the Period 2022-2032F
- Georgia Chlor Alkali Market Trend Evolution
- Georgia Chlor Alkali Market Drivers and Challenges
- Georgia Chlor Alkali Price Trends
- Georgia Chlor Alkali Porter's Five Forces
- Georgia Chlor Alkali Industry Life Cycle
- Historical Data and Forecast of Georgia Chlor Alkali Market Revenues & Volume By Product for the Period 2022-2032F
- Historical Data and Forecast of Georgia Chlor Alkali Market Revenues & Volume By Caustic Soda for the Period 2022-2032F
- Historical Data and Forecast of Georgia Chlor Alkali Market Revenues & Volume By Chlorine for the Period 2022-2032F
- Historical Data and Forecast of Georgia Chlor Alkali Market Revenues & Volume By Soda Ash for the Period 2022-2032F
- Historical Data and Forecast of Georgia Chlor Alkali Market Revenues & Volume By Production Process for the Period 2022-2032F
- Historical Data and Forecast of Georgia Chlor Alkali Market Revenues & Volume By Membrane Cell for the Period 2022-2032F
- Historical Data and Forecast of Georgia Chlor Alkali Market Revenues & Volume By Diaphragm Cell for the Period 2022-2032F
- Historical Data and Forecast of Georgia Chlor Alkali Market Revenues & Volume By Other Production Processes for the Period 2022-2032F
- Historical Data and Forecast of Georgia Chlor Alkali Market Revenues & Volume By Application for the Period 2022-2032F
- Historical Data and Forecast of Georgia Chlor Alkali Market Revenues & Volume By Pulp and Paper for the Period 2022-2032F
- Historical Data and Forecast of Georgia Chlor Alkali Market Revenues & Volume By Organic Chemical for the Period 2022-2032F
- Historical Data and Forecast of Georgia Chlor Alkali Market Revenues & Volume By Inorganic Chemical for the Period 2022-2032F
- Historical Data and Forecast of Georgia Chlor Alkali Market Revenues & Volume By Soap and Detergent for the Period 2022-2032F
- Historical Data and Forecast of Georgia Chlor Alkali Market Revenues & Volume By Alumina for the Period 2022-2032F
- Historical Data and Forecast of Georgia Chlor Alkali Market Revenues & Volume By Textile for the Period 2022-2032F
- Historical Data and Forecast of Georgia Chlor Alkali Market Revenues & Volume By Other for the Period 2022-2032F
- Georgia Chlor Alkali Import Export Trade Statistics
- Market Opportunity Assessment By Product
- Market Opportunity Assessment By Production Process
- Market Opportunity Assessment By Application
- Georgia Chlor Alkali Top Companies Market Share
- Georgia Chlor Alkali Competitive Benchmarking By Technical and Operational Parameters
- Georgia Chlor Alkali Company Profiles
- Georgia Chlor Alkali Key Strategic Recommendations
Georgia Chlor Alkali Market - Frequently Asked Questions
The primary drivers include increasing demand from key industries such as textiles and water treatment, as well as economic growth fostering greater industrial activities.
Georgia’s strategic location offers logistical advantages that enhance transportation efficiencies for chlor alkali products, facilitating broader market reach for manufacturers.
The market is estimated at USD 433 Million in 2025, with expectations to grow to USD 611 Million by 2032, reflecting a CAGR of 5.0% from 2026 to 2032.
Local producers contend with stringent environmental regulations and competition from imported products, necessitating advancements in operational efficiency and compliance measures.
The government has implemented policies to encourage sustainable production practices, providing incentives for investments in clean technologies while ensuring operational safety.
6Wresearch actively monitors the Georgia Chlor Alkali Market and publishes its comprehensive annual report, highlighting emerging trends, growth drivers, revenue analysis, and forecast outlook. Our insights help businesses to make data-backed strategic decisions with ongoing market dynamics. Our analysts track relevent industries related to the Georgia Chlor Alkali Market, allowing our clients with actionable intelligence and reliable forecasts tailored to emerging regional needs.
Yes, we provide customisation as per your requirements. To learn more, feel free to contact us on sales@6wresearch.com
1 Executive Summary |
2 Introduction |
2.1 Key Highlights of the Report |
2.2 Report Description |
2.3 Market Scope & Segmentation |
2.4 Research Methodology |
2.5 Assumptions |
3 Georgia Chlor Alkali Market Overview |
3.1 Georgia Country Macro Economic Indicators |
3.2 Georgia Chlor Alkali Market Revenues & Volume, 2022 & 2032F |
3.3 Georgia Chlor Alkali Market - Industry Life Cycle |
3.4 Georgia Chlor Alkali Market - Porter's Five Forces |
3.5 Georgia Chlor Alkali Market Revenues & Volume Share, By Product, 2022 & 2032F |
3.6 Georgia Chlor Alkali Market Revenues & Volume Share, By Production Process, 2022 & 2032F |
3.7 Georgia Chlor Alkali Market Revenues & Volume Share, By Application, 2022 & 2032F |
4 Georgia Chlor Alkali Market Dynamics |
4.1 Impact Analysis |
4.2 Market Drivers |
4.2.1 Increasing demand for chlor alkali products in various industries such as water treatment, pulp and paper, and chemical manufacturing. |
4.2.2 Growing investments in infrastructure development and urbanization in Georgia, leading to higher consumption of chlor alkali products. |
4.2.3 Rising awareness about the benefits of using chlor alkali products over traditional alternatives in different applications. |
4.3 Market Restraints |
4.3.1 Fluctuating prices of raw materials used in chlor alkali production, such as salt and electricity, impacting the overall production costs. |
4.3.2 Stringent environmental regulations related to the disposal of chlor alkali byproducts, leading to additional compliance costs for manufacturers. |
4.3.3 Competition from alternative chemicals and technologies that offer similar functionalities as chlor alkali products. |
5 Georgia Chlor Alkali Market Trends |
6 Georgia Chlor Alkali Market, By Types |
6.1 Georgia Chlor Alkali Market, By Product |
6.1.1 Overview and Analysis |
6.1.2 Georgia Chlor Alkali Market Revenues & Volume, By Product, 2022-2032F |
6.1.3 Georgia Chlor Alkali Market Revenues & Volume, By Caustic Soda, 2022-2032F |
6.1.4 Georgia Chlor Alkali Market Revenues & Volume, By Chlorine, 2022-2032F |
6.1.5 Georgia Chlor Alkali Market Revenues & Volume, By Soda Ash, 2022-2032F |
6.2 Georgia Chlor Alkali Market, By Production Process |
6.2.1 Overview and Analysis |
6.2.2 Georgia Chlor Alkali Market Revenues & Volume, By Membrane Cell, 2022-2032F |
6.2.3 Georgia Chlor Alkali Market Revenues & Volume, By Diaphragm Cell, 2022-2032F |
6.2.4 Georgia Chlor Alkali Market Revenues & Volume, By Other Production Processes, 2022-2032F |
6.3 Georgia Chlor Alkali Market, By Application |
6.3.1 Overview and Analysis |
6.3.2 Georgia Chlor Alkali Market Revenues & Volume, By Pulp and Paper, 2022-2032F |
6.3.3 Georgia Chlor Alkali Market Revenues & Volume, By Organic Chemical, 2022-2032F |
6.3.4 Georgia Chlor Alkali Market Revenues & Volume, By Inorganic Chemical, 2022-2032F |
6.3.5 Georgia Chlor Alkali Market Revenues & Volume, By Soap and Detergent, 2022-2032F |
6.3.6 Georgia Chlor Alkali Market Revenues & Volume, By Alumina, 2022-2032F |
6.3.7 Georgia Chlor Alkali Market Revenues & Volume, By Textile, 2022-2032F |
7 Georgia Chlor Alkali Market Import-Export Trade Statistics |
7.1 Georgia Chlor Alkali Market Export to Major Countries |
7.2 Georgia Chlor Alkali Market Imports from Major Countries |
8 Georgia Chlor Alkali Market Key Performance Indicators |
8.1 Energy efficiency ratio in chlor alkali production processes. |
8.2 Percentage of recycled or reused byproducts from chlor alkali manufacturing. |
8.3 Number of new product developments or innovations in the chlor alkali market. |
9 Georgia Chlor Alkali Market - Opportunity Assessment |
9.1 Georgia Chlor Alkali Market Opportunity Assessment, By Product, 2022 & 2032F |
9.2 Georgia Chlor Alkali Market Opportunity Assessment, By Production Process, 2022 & 2032F |
9.3 Georgia Chlor Alkali Market Opportunity Assessment, By Application, 2022 & 2032F |
10 Georgia Chlor Alkali Market - Competitive Landscape |
10.1 Georgia Chlor Alkali Market Revenue Share, By Companies, 2025 |
10.2 Georgia Chlor Alkali Market Competitive Benchmarking, By Operating and Technical Parameters |
11 Company Profiles |
12 Recommendations |
13 Disclaimer |
Global Go To Market Strategy - 2030
Export potential enables firms to identify high-growth global markets with greater confidence by combining advanced trade intelligence with a structured quantitative methodology. The framework analyzes emerging demand trends and country-level import patterns while integrating macroeconomic and trade datasets such as GDP and population forecasts, bilateral import–export flows, tariff structures, elasticity differentials between developed and developing economies, geographic distance, and import demand projections. Using weighted trade values from 2020–2024 as the base period to project country-to-country export potential for 2030, these inputs are operationalized through calculated drivers such as gravity model parameters, tariff impact factors, and projected GDP per-capita growth. Through an analysis of hidden potentials, demand hotspots, and market conditions that are most favorable to success, this method enables firms to focus on target countries, maximize returns, and global expansion with data, backed by accuracy.
By factoring in the projected importer demand gap that is currently unmet and could be potential opportunity, it identifies the potential for the Exporter (Country) among 190 countries, against the general trade analysis, which identifies the biggest importer or exporter.
To discover high-growth global markets and optimize your business strategy:
Click Here
Pricing
- Single User License$ 1,995
- Department License$ 2,400
- Site License$ 3,120
- Global License$ 3,795

Leadership Perspectives from Industry Events
Search
Thought Leadership and Analyst Meet


Our Clients
6WResearch In News
- India Air Conditioner Market Set for Strong Rebound in 2026 After Weather-Led Correction and GST-Driven Recovery: 6Wresearch
- ADAS in India: How Automatic Emergency Braking, Blind Spot Detection & Driver Monitoring are Transforming Road Safety
- Doha a strategic location for EV manufacturing hub: IPA Qatar
- Demand for luxury TVs surging in the GCC, says Samsung
- Empowering Growth: The Thriving Journey of Bangladesh’s Cable Industry
- Demand for luxury TVs surging in the GCC, says Samsung
Latest Reports
- Poland Fire Protection Systems Market (2026-2032)
- Cape Verde Portable Hand-Thrown Extinguisher Market (2026-2032)
- Canada Portable Hand-Thrown Extinguisher Market (2026-2032)
- Cameroon Portable Hand-Thrown Extinguisher Market (2026-2032)
- Burundi Portable Hand-Thrown Extinguisher Market (2026-2032)
- Burkina Faso Portable Hand-Thrown Extinguisher Market (2026-2032)
- Bulgaria Portable Hand-Thrown Extinguisher Market (2026-2032)
- Brunei Portable Hand-Thrown Extinguisher Market (2026-2032)
- Botswana Portable Hand-Thrown Extinguisher Market (2026-2032)
- Bosnia and Herzegovina Portable Hand-Thrown Extinguisher Market (2026-2032)
Industry Events and Analyst Meet

HIMTEX 2026

India Refining Summit 2026

India EV Show 2026

EV tech India Expo 2026

Auto Tech Asia 2026
Whitepaper
- Middle East & Africa Commercial Security Market Click here to view more.
- Middle East & Africa Fire Safety Systems & Equipment Market Click here to view more.
- GCC Drone Market Click here to view more.
- Middle East Lighting Fixture Market Click here to view more.
- GCC Physical & Perimeter Security Market Click here to view more.