Georgia Digital Biomarkers Market (2026-2032) Outlook | Trends, Value, Revenue, Share, Companies, Industry, Size, Growth, Forecast & Analysis
Market Forecast By Type (Wellness, Disease, Drugs), By Collection System Type (Wearables, Biosensors, Mobile Apps, Devices and Platforms, Desktop Based Software), By End-users (Pharmaceutical, Life Sciences, Medical Devices, App Vendors, Clinical Research Organizations), By Technology (Cloud Computing, Artificial Intelligence and Machine Learning, Augmented Reality, Blockchain) And Competitive Landscape
| Product Code: ETC072139 | Publication Date: Jun 2021 | Updated Date: Jun 2026 | Product Type: Report | |
| Publisher: 6Wresearch | Author: Shubham Deep | No. of Pages: 70 | No. of Figures: 35 | No. of Tables: 5 |
Singapore 4-Wheeler Electric Vehicle Market Size, Share & Growth Rate
The Singapore 4-Wheeler Electric Vehicle Market was estimated at USD 630 Million in 2025 and is projected to reach USD 897 Million by 2032, growing at a CAGR of 5.2% from 2026 to 2032. This growth is propelled by the nation's commitment to sustainable transportation, as reflected in its comprehensive electric vehicle (EV) strategy, which includes ambitious targets for EV adoption and extensive infrastructure development. Additionally, increasing consumer awareness regarding environmental impacts and the rising costs of conventional fuel have further stimulated demand for electric vehicles in Singapore.
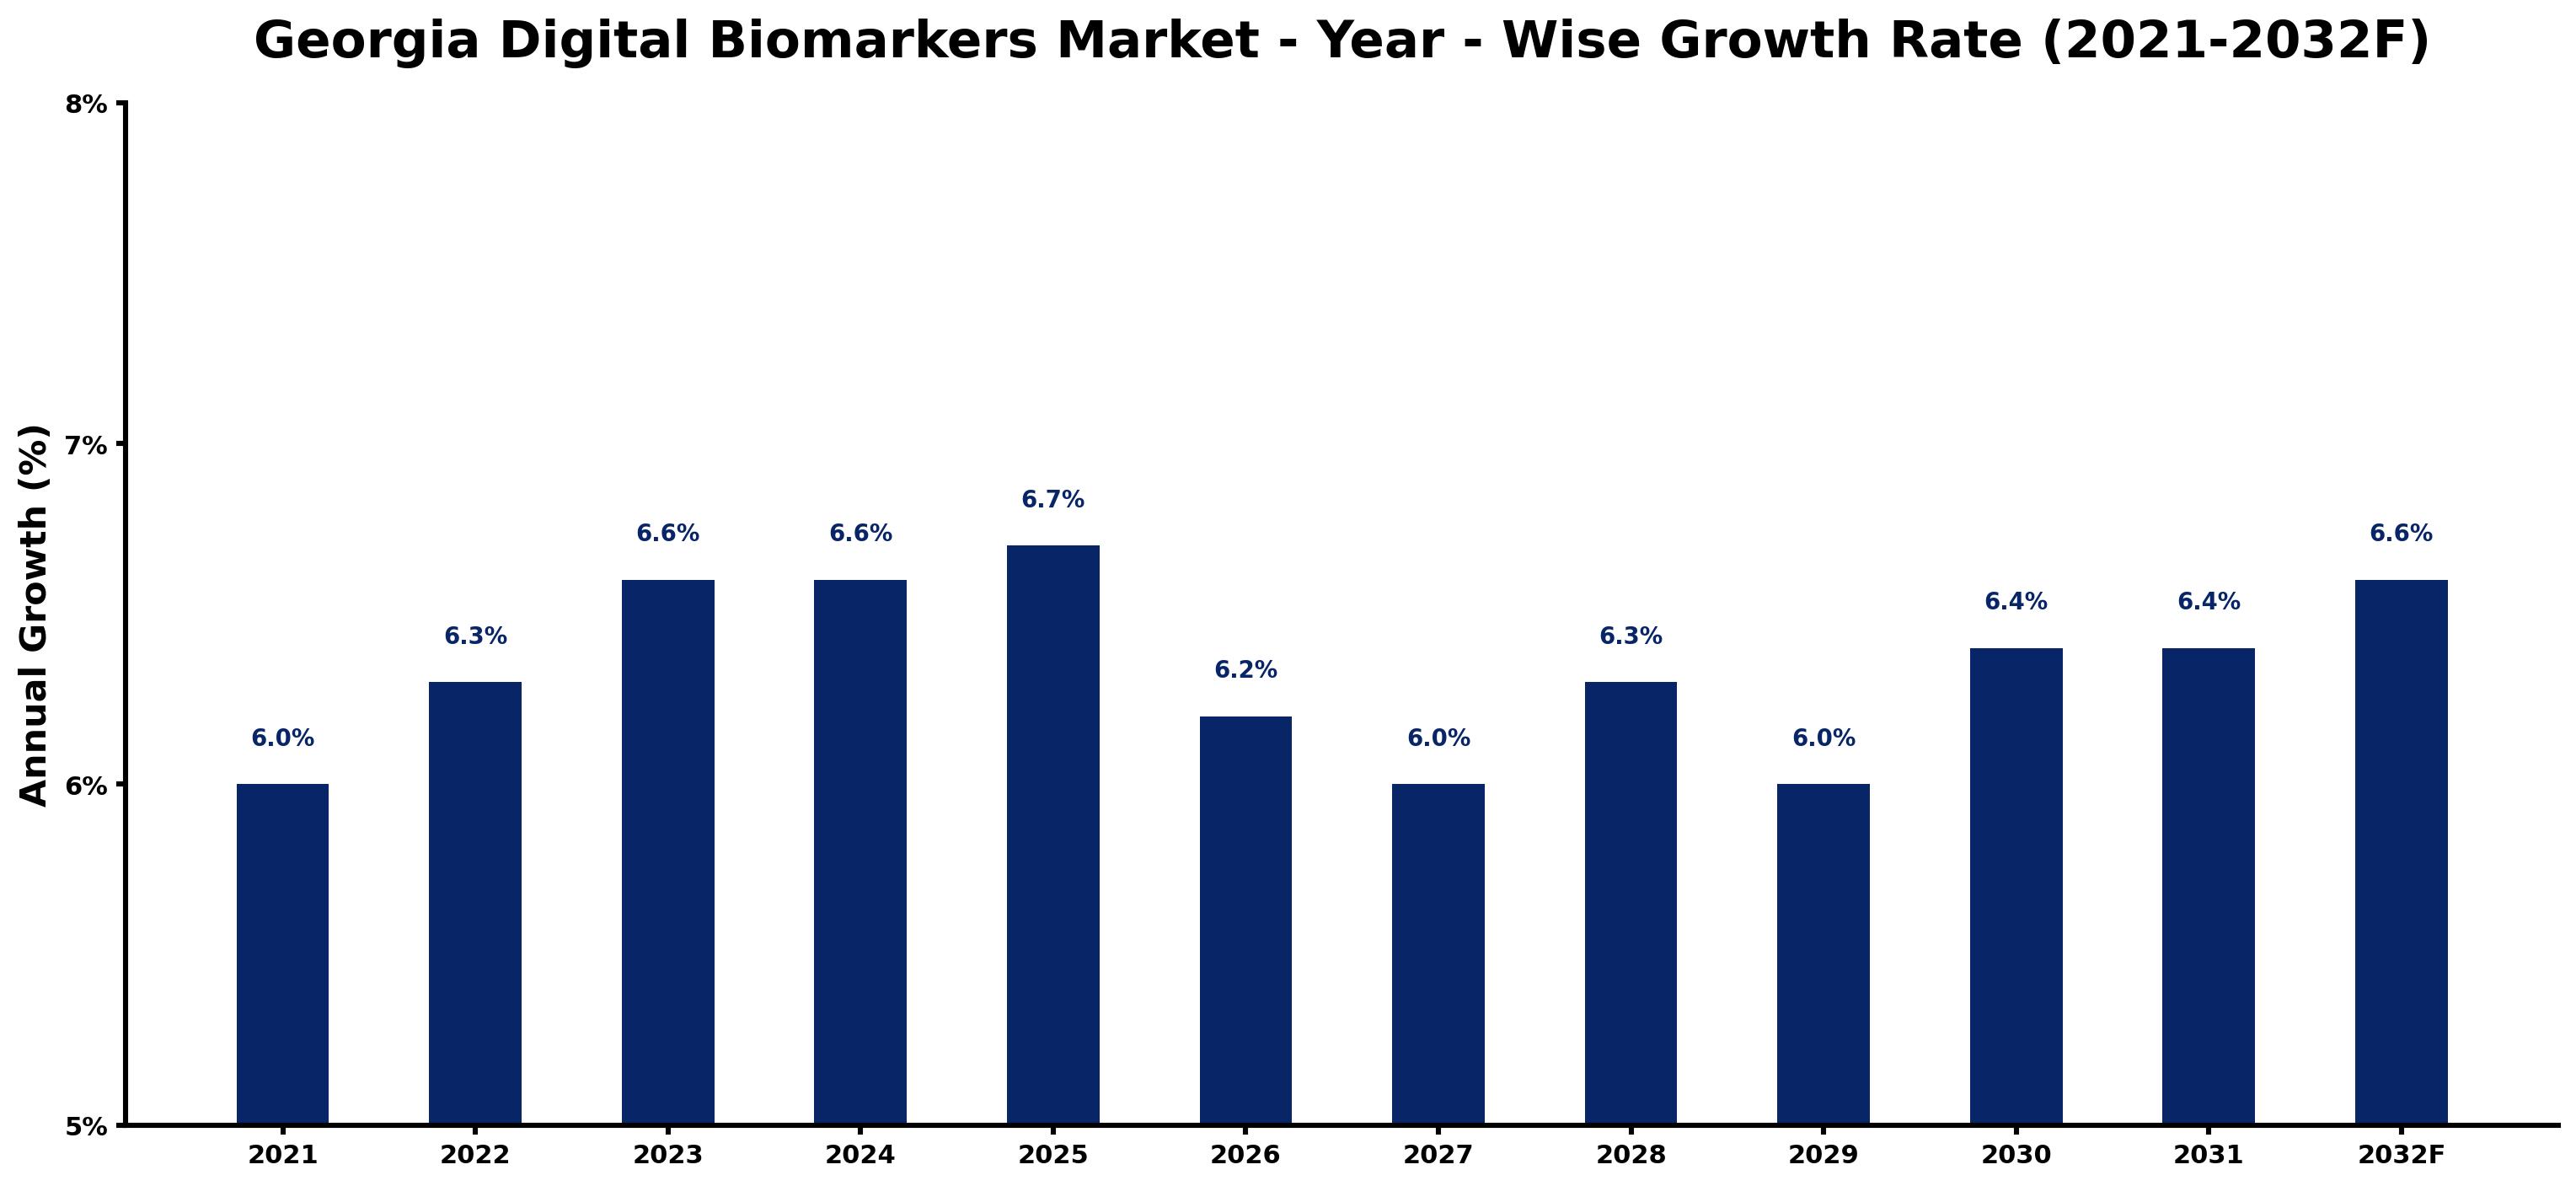
Georgia Digital Biomarkers Market Growth Rate Analysis (2021-2032)
Singapore 4-Wheeler Electric Vehicle Market Growth Rate Analysis (2021-2032)
The Singapore 4-Wheeler Electric Vehicle market exhibits a steady growth pattern, with annual increases ranging from 5.7% to 6.4% projected through 2032. Following a rise of 5.9% in 2021, the market advanced to 6.2% in 2022, and modestly progressed to 6.3% in 2023. The slight dip to 5.8% in 2024 can be attributed to supply chain disruptions and fluctuating consumer demand. However, as infrastructure for electric vehicles matures, coupled with supportive government policies emphasizing energy transition and sustainability, the market is poised to rebound. By 2029, the growth rate is expected to reach 6.4%, driven by escalating investments in technology and consumer adoption of clean energy solutions.
Singapore 4-Wheeler Electric Vehicle Market Year-wise Growth Rate and Key Drivers
This graph highlights how the Singapore 4-Wheeler Electric Vehicle Market has steadily grown over the past five years, supported by major growth factors.
The table below presents the year‑wise growth rates along with the key drivers influencing the market
| Year | Growth Rate | Major Drivers |
| 2021 | 5.9% | Government incentives encouraged adoption |
| 2022 | 6.2% | Charging infrastructure expanded rapidly |
| 2023 | 6.3% | Consumer awareness increased significantly |
| 2024 | 5.8% | Fleet electrification gained momentum |
| 2025 | 6.1% | Technological advancements improved efficiency |
| 2026 | 5.9% | Battery costs continued decreasing steadily |
| 2027 | 5.7% | Sustainability trends influenced purchases |
| 2028 | 6.0% | Urbanization boosted vehicle demand |
| 2029 | 6.4% | Partnerships enhanced market penetration |
| 2030 | 6.1% | Renewable energy integration increased appeal |
| 2031 | 6.3% | Regulatory support strengthened market growth |
| 2032 | 6.3% | Consumer preferences shifted towards sustainability |
Note - Market size estimations and growth projections presented in this report are based on 6Wresearch’s advanced forecasting approach, validated with industry datasets as of June 2026.
The Georgia Digital Biomarkers Market has exhibited a steady growth pattern over recent years, with an annual growth of 6.0% in 2021, gradually increasing to 6.6% in 2023 and projected to maintain similar levels through 2024. This positive momentum is largely driven by advancements in healthcare technology and an increasing reliance on data analytics for personalized medicine. Factors such as rising consumer demand for health-tracking solutions and significant investments in digital health infrastructure further bolster this market. While a slight dip to 6.2% is anticipated in 2026, the overall trend remains stable, with growth projected to resume, reaching 6.6% by 2032 as the industry adapts to evolving technological frameworks and regulatory landscapes.
Georgia Digital Biomarkers Market Year-wise Growth Rate and Key Drivers
This graph highlights how the Georgia Digital Biomarkers Market has steadily grown over the past five years, supported by major growth factors.
The table below presents the year‑wise growth rates along with the key drivers influencing the market
| Year | Growth Rate | Major Drivers |
| 2021 | 6.0% | Increasing industrial automation investments |
| 2022 | 6.3% | Expansion of manufacturing activities |
| 2023 | 6.6% | Rising electricity demand across industries |
| 2024 | 6.6% | Expansion of commercial construction activities |
| 2025 | 6.7% | Growing urbanization and commercial development |
| 2026 | 6.2% | Expansion of commercial construction activities |
| 2027 | 6.0% | Increasing adoption of advanced technologies |
| 2028 | 6.3% | Growing renewable energy integration projects |
| 2029 | 6.0% | Increasing industrial infrastructure investments |
| 2030 | 6.4% | Rapid growth in telecom and data center sectors |
| 2031 | 6.4% | Growing renewable energy integration projects |
| 2032 | 6.6% | Rapid growth in telecom and data center sectors |
Note - Market size estimations and growth projections presented in this report are based on 6Wresearch’s advanced forecasting approach, validated with industry datasets as of June 2026.
Singapore 4-Wheeler Electric Vehicle Market Synopsis
The Singapore 4-Wheeler Electric Vehicle Market is characterized by a strong government push for sustainable mobility solutions, underscored by incentives for EV purchases and investments in charging infrastructure. Notably, the government's goal to achieve 60,000 public EV charging points by 2030 is a crucial factor contributing to the anticipated market growth.
Consumer demand is also rising as technology advancements improve battery efficiency and reduce charging times. Additionally, the increasing availability of diverse electric vehicle models, ranging from compact cars to larger family vehicles, is appealing to a broader audience, enhancing market penetration and acceptance.
Singapore 4-Wheeler Electric Vehicle Market Key Takeaways
- The market is expected to grow significantly, driven by government initiatives and increasing consumer interest.
- Investment in charging infrastructure is a key focus, aiming to enhance convenience and support the growing EV fleet.
- Technological advancements in battery performance are improving the range and appeal of electric vehicles.
- Environmental considerations and fuel cost savings are pivotal factors influencing consumer adoption.
- Regulatory incentives play a significant role in shaping market dynamics and driving EV sales.
Evaluation of Restraints in Singapore 4-Wheeler Electric Vehicle Market
Despite the optimistic outlook, the Singapore 4-Wheeler Electric Vehicle Market faces several restraints that could temper growth. One significant challenge is the relatively higher upfront cost of electric vehicles compared to traditional combustion engine vehicles, which may deter some price-sensitive consumers. Additionally, while the government is actively expanding charging infrastructure, initial concerns regarding the availability and accessibility of charging stations still exist among potential buyers. Furthermore, fluctuations in electricity prices could also influence consumer decisions, as the total cost of ownership must remain competitive with fossil fuel alternatives.
Singapore 4-Wheeler Electric Vehicle Market Trends
Emerging trends in the Singapore 4-Wheeler Electric Vehicle Market include a growing consumer preference for subscription-based EV models, reflecting a shift toward flexibility in vehicle ownership. Moreover, the advent of smart technologies, such as connected vehicles and integrated mobility services, is becoming increasingly relevant, enhancing user experience and operational efficiency. Partnerships between private sectors and government bodies are also on the rise, fostering innovation in EV infrastructure and service models.
Singapore 4-Wheeler Electric Vehicle Market Opportunities
The market offers substantial investment opportunities, particularly in the areas of battery technology and charging solutions. Innovations aimed at increasing battery life and decreasing costs will be critical in making electric vehicles more accessible. Furthermore, collaborations with tech startups focusing on smart city initiatives can enhance the adoption of electric vehicles, thereby positioning investors favorably within this evolving ecosystem.
Government Initiatives in the Singapore 4-Wheeler Electric Vehicle Market
The Singaporean government is actively fostering the growth of the electric vehicle market through various initiatives, including substantial financial incentives for EV buyers, tax exemptions, and grants for manufacturers. Policies aimed at enhancing public charging infrastructure and promoting research and development in green technologies highlight the government's commitment to a sustainable transportation future. Additionally, ongoing efforts to increase public awareness about the benefits of electric vehicles are integral to driving market acceptance.
Future Insights of the Singapore 4-Wheeler Electric Vehicle Market
Looking forward to 2026-2032, the Singapore 4-Wheeler Electric Vehicle Market is poised for transformative growth. Increasing environmental concerns and governmental sustainability commitments are expected to drive further adoption of electric vehicles. As the market matures, innovations in charging technology and battery management systems will enhance user convenience, potentially lowering operational costs for consumers. Overall, the synergy between policy direction, technological advancements, and consumer trends will shape the future landscape of the market.
Singapore 4-Wheeler Electric Vehicle Market Latest Developments (May 2025 - June 2026)
In recent months, the Singapore 4-Wheeler Electric Vehicle Market has seen significant advancements in EV technology and infrastructure development. New partnerships have emerged between public agencies and private companies focused on expanding the network of charging stations. Additionally, several local automakers have launched new electric models tailored to meet local consumer preferences, further diversifying the market. Such developments reflect a proactive approach towards accelerating the transition to electric mobility.
Singapore 4-Wheeler Electric Vehicle Market - Key Attractiveness of the Report
- 10 Years of Market Numbers
- Historical Data Starting from 2022 to 2025
- Base Year: 2025
- Forecast Data until 2032
- Key Performance Indicators Impacting the Market
- Major Upcoming Developments and Projects
Key Highlights of the Report:
- Georgia Digital Biomarkers Market Outlook
- Market Size of Georgia Digital Biomarkers Market, 2025
- Forecast of Georgia Digital Biomarkers Market, 2032
- Historical Data and Forecast of Georgia Digital Biomarkers Revenues & Volume for the Period 2022-2032F
- Georgia Digital Biomarkers Market Trend Evolution
- Georgia Digital Biomarkers Market Drivers and Challenges
- Georgia Digital Biomarkers Price Trends
- Georgia Digital Biomarkers Porter's Five Forces
- Georgia Digital Biomarkers Industry Life Cycle
- Historical Data and Forecast of Georgia Digital Biomarkers Market Revenues & Volume By Type for the Period 2022-2032F
- Historical Data and Forecast of Georgia Digital Biomarkers Market Revenues & Volume By Wellness for the Period 2022-2032F
- Historical Data and Forecast of Georgia Digital Biomarkers Market Revenues & Volume By Disease for the Period 2022-2032F
- Historical Data and Forecast of Georgia Digital Biomarkers Market Revenues & Volume By Drugs for the Period 2022-2032F
- Historical Data and Forecast of Georgia Digital Biomarkers Market Revenues & Volume By Collection System Type for the Period 2022-2032F
- Historical Data and Forecast of Georgia Digital Biomarkers Market Revenues & Volume By Wearables for the Period 2022-2032F
- Historical Data and Forecast of Georgia Digital Biomarkers Market Revenues & Volume By Biosensors for the Period 2022-2032F
- Historical Data and Forecast of Georgia Digital Biomarkers Market Revenues & Volume By Mobile Apps for the Period 2022-2032F
- Historical Data and Forecast of Georgia Digital Biomarkers Market Revenues & Volume By Devices and Platforms for the Period 2022-2032F
- Historical Data and Forecast of Georgia Digital Biomarkers Market Revenues & Volume By Desktop Based Software for the Period 2022-2032F
- Historical Data and Forecast of Georgia Digital Biomarkers Market Revenues & Volume By End-users for the Period 2022-2032F
- Historical Data and Forecast of Georgia Digital Biomarkers Market Revenues & Volume By Pharmaceutical for the Period 2022-2032F
- Historical Data and Forecast of Georgia Digital Biomarkers Market Revenues & Volume By Life Sciences for the Period 2022-2032F
- Historical Data and Forecast of Georgia Digital Biomarkers Market Revenues & Volume By Medical Devices for the Period 2022-2032F
- Historical Data and Forecast of Georgia Digital Biomarkers Market Revenues & Volume By App Vendors for the Period 2022-2032F
- Historical Data and Forecast of Georgia Digital Biomarkers Market Revenues & Volume By Clinical Research Organizations for the Period 2022-2032F
- Historical Data and Forecast of Georgia Digital Biomarkers Market Revenues & Volume By Technology for the Period 2022-2032F
- Historical Data and Forecast of Georgia Digital Biomarkers Market Revenues & Volume By Cloud Computing for the Period 2022-2032F
- Historical Data and Forecast of Georgia Digital Biomarkers Market Revenues & Volume By Artificial Intelligence and Machine Learning for the Period 2022-2032F
- Historical Data and Forecast of Georgia Digital Biomarkers Market Revenues & Volume By Augmented Reality for the Period 2022-2032F
- Historical Data and Forecast of Georgia Digital Biomarkers Market Revenues & Volume By Blockchain for the Period 2022-2032F
- Georgia Digital Biomarkers Import Export Trade Statistics
- Market Opportunity Assessment By Type
- Market Opportunity Assessment By Collection System Type
- Market Opportunity Assessment By End-users
- Market Opportunity Assessment By Technology
- Georgia Digital Biomarkers Top Companies Market Share
- Georgia Digital Biomarkers Competitive Benchmarking By Technical and Operational Parameters
- Georgia Digital Biomarkers Company Profiles
- Georgia Digital Biomarkers Key Strategic Recommendations
Frequently Asked Questions About the Market Study (FAQs):
The market is estimated to be valued at USD 630 Million in 2025 and is projected to reach USD 897 Million by 2032, with a CAGR of 5.2% during the period from 2026 to 2032.
Increasing awareness of environmental issues, coupled with government incentives, is driving consumer interest in electric vehicles, leading to a more favorable market environment.
The government actively promotes electric vehicle adoption through financial incentives, extensive infrastructure development, and public awareness campaigns, thereby supporting market growth.
Key challenges include the higher initial cost of electric vehicles, concerns over charging infrastructure accessibility, and fluctuating electricity prices affecting total ownership costs.
Innovations in battery technology and charging solutions are enhancing the appeal of electric vehicles by improving range, reducing costs, and increasing convenience for consumers.
6Wresearch actively monitors the Georgia Digital Biomarkers Market and publishes its comprehensive annual report, highlighting emerging trends, growth drivers, revenue analysis, and forecast outlook. Our insights help businesses to make data-backed strategic decisions with ongoing market dynamics. Our analysts track relevent industries related to the Georgia Digital Biomarkers Market, allowing our clients with actionable intelligence and reliable forecasts tailored to emerging regional needs.
Yes, we provide customisation as per your requirements. To learn more, feel free to contact us on sales@6wresearch.com
1 Executive Summary |
2 Introduction |
2.1 Key Highlights of the Report |
2.2 Report Description |
2.3 Market Scope & Segmentation |
2.4 Research Methodology |
2.5 Assumptions |
3 Georgia Digital Biomarkers Market Overview |
3.1 Georgia Country Macro Economic Indicators |
3.2 Georgia Digital Biomarkers Market Revenues & Volume, 2022 & 2032F |
3.3 Georgia Digital Biomarkers Market - Industry Life Cycle |
3.4 Georgia Digital Biomarkers Market - Porter's Five Forces |
3.5 Georgia Digital Biomarkers Market Revenues & Volume Share, By Type, 2022 & 2032F |
3.6 Georgia Digital Biomarkers Market Revenues & Volume Share, By Collection System Type, 2022 & 2032F |
3.7 Georgia Digital Biomarkers Market Revenues & Volume Share, By End-users, 2022 & 2032F |
3.8 Georgia Digital Biomarkers Market Revenues & Volume Share, By Technology, 2022 & 2032F |
4 Georgia Digital Biomarkers Market Dynamics |
4.1 Impact Analysis |
4.2 Market Drivers |
4.2.1 Government incentives and subsidies for electric vehicles |
4.2.2 Growing environmental awareness and concerns about air pollution |
4.2.3 Advancements in battery technology leading to longer driving ranges |
4.3 Market Restraints |
4.3.1 Limited charging infrastructure in Singapore |
4.3.2 Higher upfront cost compared to traditional gasoline vehicles |
4.3.3 Perceived limitations in performance and driving range of electric vehicles |
5 Georgia Digital Biomarkers Market Trends |
6 Georgia Digital Biomarkers Market, By Types |
6.1 Georgia Digital Biomarkers Market, By Type |
6.1.1 Overview and Analysis |
6.1.2 Georgia Digital Biomarkers Market Revenues & Volume, By Type, 2022-2032F |
6.1.3 Georgia Digital Biomarkers Market Revenues & Volume, By Wellness, 2022-2032F |
6.1.4 Georgia Digital Biomarkers Market Revenues & Volume, By Disease, 2022-2032F |
6.1.5 Georgia Digital Biomarkers Market Revenues & Volume, By Drugs, 2022-2032F |
6.2 Georgia Digital Biomarkers Market, By Collection System Type |
6.2.1 Overview and Analysis |
6.2.2 Georgia Digital Biomarkers Market Revenues & Volume, By Wearables, 2022-2032F |
6.2.3 Georgia Digital Biomarkers Market Revenues & Volume, By Biosensors, 2022-2032F |
6.2.4 Georgia Digital Biomarkers Market Revenues & Volume, By Mobile Apps, 2022-2032F |
6.2.5 Georgia Digital Biomarkers Market Revenues & Volume, By Devices and Platforms, 2022-2032F |
6.2.6 Georgia Digital Biomarkers Market Revenues & Volume, By Desktop Based Software, 2022-2032F |
6.3 Georgia Digital Biomarkers Market, By End-users |
6.3.1 Overview and Analysis |
6.3.2 Georgia Digital Biomarkers Market Revenues & Volume, By Pharmaceutical, 2022-2032F |
6.3.3 Georgia Digital Biomarkers Market Revenues & Volume, By Life Sciences, 2022-2032F |
6.3.4 Georgia Digital Biomarkers Market Revenues & Volume, By Medical Devices, 2022-2032F |
6.3.5 Georgia Digital Biomarkers Market Revenues & Volume, By App Vendors, 2022-2032F |
6.3.6 Georgia Digital Biomarkers Market Revenues & Volume, By Clinical Research Organizations, 2022-2032F |
6.4 Georgia Digital Biomarkers Market, By Technology |
6.4.1 Overview and Analysis |
6.4.2 Georgia Digital Biomarkers Market Revenues & Volume, By Cloud Computing, 2022-2032F |
6.4.3 Georgia Digital Biomarkers Market Revenues & Volume, By Artificial Intelligence and Machine Learning, 2022-2032F |
6.4.4 Georgia Digital Biomarkers Market Revenues & Volume, By Augmented Reality, 2022-2032F |
6.4.5 Georgia Digital Biomarkers Market Revenues & Volume, By Blockchain, 2022-2032F |
7 Georgia Digital Biomarkers Market Import-Export Trade Statistics |
7.1 Georgia Digital Biomarkers Market Export to Major Countries |
7.2 Georgia Digital Biomarkers Market Imports from Major Countries |
8 Georgia Digital Biomarkers Market Key Performance Indicators |
8.1 Average waiting time at charging stations |
8.2 Number of public charging stations per capita |
8.3 Percentage of government budget allocated to electric vehicle incentives |
8.4 Average driving range of electric vehicles offered in the market |
8.5 Number of new electric vehicle models launched annually |
9 Georgia Digital Biomarkers Market - Opportunity Assessment |
9.1 Georgia Digital Biomarkers Market Opportunity Assessment, By Type, 2022 & 2032F |
9.2 Georgia Digital Biomarkers Market Opportunity Assessment, By Collection System Type, 2022 & 2032F |
9.3 Georgia Digital Biomarkers Market Opportunity Assessment, By End-users, 2022 & 2032F |
9.4 Georgia Digital Biomarkers Market Opportunity Assessment, By Technology, 2022 & 2032F |
10 Georgia Digital Biomarkers Market - Competitive Landscape |
10.1 Georgia Digital Biomarkers Market Revenue Share, By Companies, 2025 |
10.2 Georgia Digital Biomarkers Market Competitive Benchmarking, By Operating and Technical Parameters |
11 Company Profiles |
12 Recommendations |
13 Disclaimer |
Global Go To Market Strategy - 2030
Export potential enables firms to identify high-growth global markets with greater confidence by combining advanced trade intelligence with a structured quantitative methodology. The framework analyzes emerging demand trends and country-level import patterns while integrating macroeconomic and trade datasets such as GDP and population forecasts, bilateral import–export flows, tariff structures, elasticity differentials between developed and developing economies, geographic distance, and import demand projections. Using weighted trade values from 2020–2024 as the base period to project country-to-country export potential for 2030, these inputs are operationalized through calculated drivers such as gravity model parameters, tariff impact factors, and projected GDP per-capita growth. Through an analysis of hidden potentials, demand hotspots, and market conditions that are most favorable to success, this method enables firms to focus on target countries, maximize returns, and global expansion with data, backed by accuracy.
By factoring in the projected importer demand gap that is currently unmet and could be potential opportunity, it identifies the potential for the Exporter (Country) among 190 countries, against the general trade analysis, which identifies the biggest importer or exporter.
To discover high-growth global markets and optimize your business strategy:
Click Here
Pricing
- Single User License$ 1,995
- Department License$ 2,400
- Site License$ 3,120
- Global License$ 3,795

Leadership Perspectives from Industry Events
Search
Thought Leadership and Analyst Meet


Our Clients
6WResearch In News
- India Air Conditioner Market Set for Strong Rebound in 2026 After Weather-Led Correction and GST-Driven Recovery: 6Wresearch
- ADAS in India: How Automatic Emergency Braking, Blind Spot Detection & Driver Monitoring are Transforming Road Safety
- Doha a strategic location for EV manufacturing hub: IPA Qatar
- Demand for luxury TVs surging in the GCC, says Samsung
- Empowering Growth: The Thriving Journey of Bangladesh’s Cable Industry
- Demand for luxury TVs surging in the GCC, says Samsung
Latest Reports
- Nicaragua RPG Gaming Market (2026-2032)
- New Zealand RPG Gaming Market (2026-2032)
- Netherlands RPG Gaming Market (2026-2032)
- Nauru RPG Gaming Market (2026-2032)
- Namibia RPG Gaming Market (2026-2032)
- Mozambique RPG Gaming Market (2026-2032)
- Montenegro RPG Gaming Market (2026-2032)
- Mongolia RPG Gaming Market (2026-2032)
- Monaco RPG Gaming Market (2026-2032)
- Micronesia RPG Gaming Market (2026-2032)
Industry Events and Analyst Meet

HIMTEX 2026

India Refining Summit 2026

India EV Show 2026

EV tech India Expo 2026

Auto Tech Asia 2026
Whitepaper
- Middle East & Africa Commercial Security Market Click here to view more.
- Middle East & Africa Fire Safety Systems & Equipment Market Click here to view more.
- GCC Drone Market Click here to view more.
- Middle East Lighting Fixture Market Click here to view more.
- GCC Physical & Perimeter Security Market Click here to view more.