Georgia Electric Connectors Market (2026-2032) | Size, Revenue, Analysis, Share, Companies, Growth, Outlook, Industry, Trends, Value & Forecast
Market Forecast By Type (Aluminum Electrical Connectors, Copper Electrical Connectors, Others), By Application (Electrical Device, Airplanes, National Defense, Industrial Equipments, Others) And Competitive Landscape
| Product Code: ETC019820 | Publication Date: Oct 2020 | Updated Date: Jun 2026 | Product Type: Report | |
| Publisher: 6Wresearch | Author: Ravi Bhandari | No. of Pages: 70 | No. of Figures: 35 | No. of Tables: 5 |
Georgia Electric Connectors Market Summary
The georgia electric connectors market was estimated at USD 151 Million in 2025 and is projected to reach USD 202 Million by 2032, growing at a CAGR of 5.0% from 2026 to 2032.
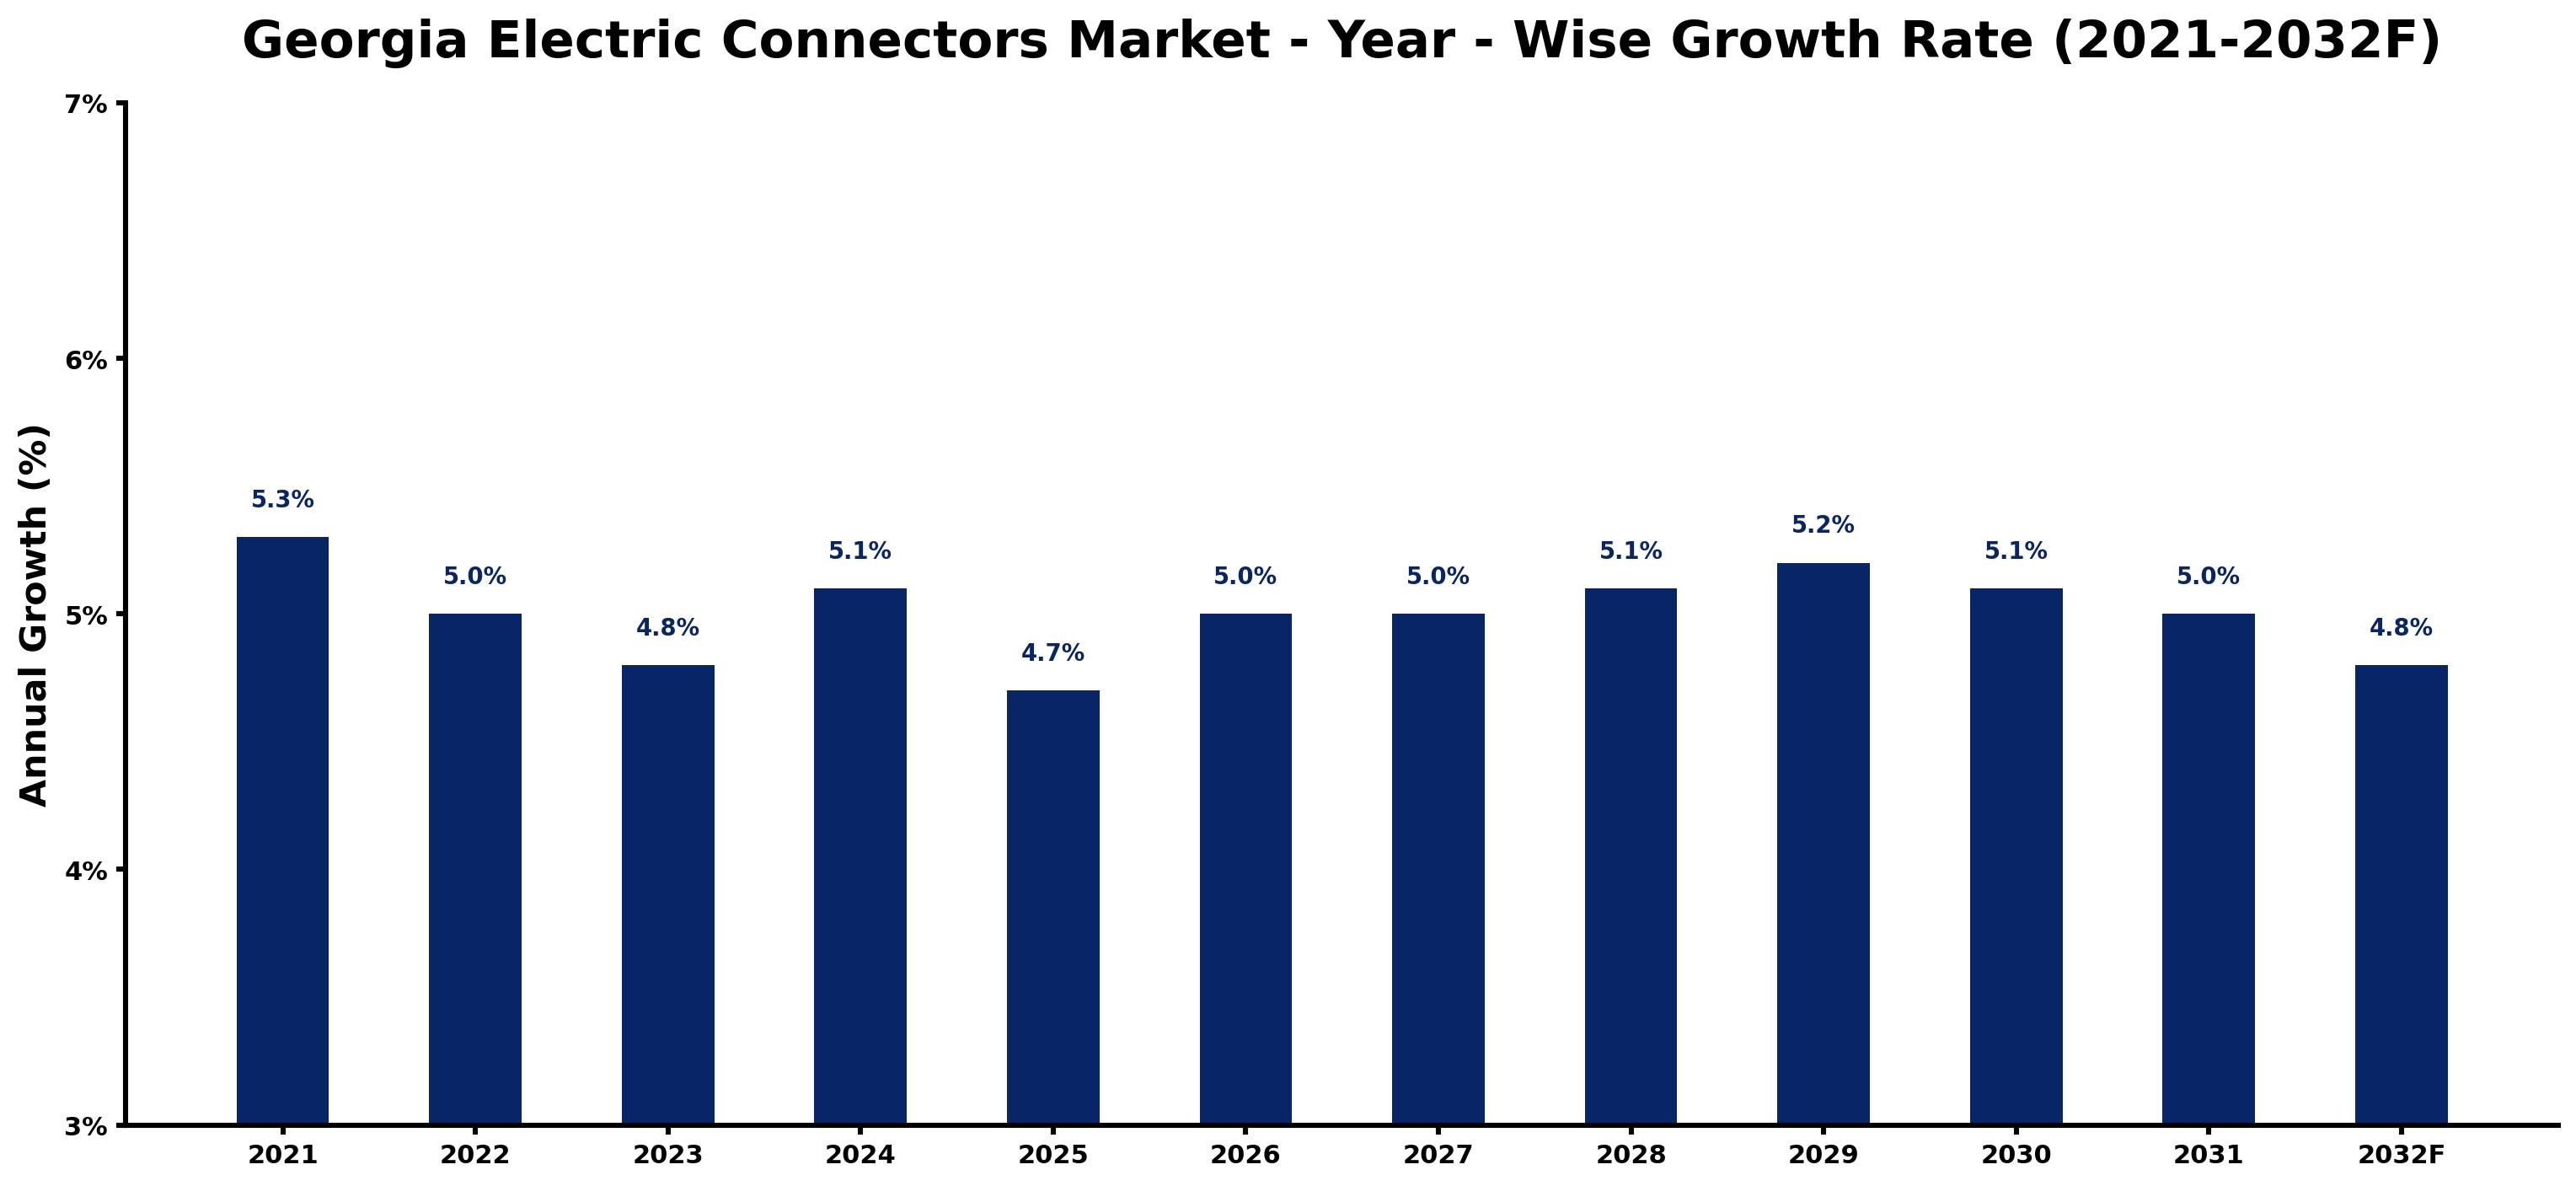
Georgia Electric Connectors Market Growth Rate Analysis (2021-2032)
The Georgia Electric Connectors Market has experienced a dynamic yet stable growth pattern, marked by a 5.3% increase in 2021 and a slight decline to 4.8% in 2023, reflecting fluctuations in consumer demand and technological advancements. The year 2024 saw a rebound to 5.1%, fueled by rising investments in renewable energy infrastructure and robust industrial growth. This momentum was sustained through 2028, with growth rates hovering around 5%. However, a slight dip to 4.8% is anticipated in 2032, potentially influenced by ongoing policy adjustments and shifts in energy transition strategies. Overall, the market remains resilient amid evolving technological landscapes and increased emphasis on sustainability.
Georgia Electric Connectors Market Year-wise Growth Rate and Key Drivers
This graph highlights how the Georgia Electric Connectors Market has steadily grown over the past five years, supported by major growth factors.
The table below presents the year wise growth rates along with the key drivers influencing the market
| Year | Growth Rate | Major Drivers |
| 2021 | 5.3% | Infrastructure projects in Georgia are gaining momentum, creating new opportunities for connectors. |
| 2022 | 5.0% | Local manufacturers pivot to produce connectors suited for hot climate applications. |
| 2023 | 4.8% | Increased focus on renewable energy demands innovative connector solutions for solar installations. |
| 2024 | 5.1% | Smart grid integration necessitates advanced electric connectors for improved efficiency. |
| 2025 | 4.7% | Partnerships between tech firms and manufacturers reshape connector design and functionality. |
| 2026 | 5.0% | Electrification of transportation rises, enhancing market need for specialized connectors. |
| 2027 | 5.0% | Emerging industries in Georgia push for customized connectors tailored to specific sectors. |
| 2028 | 5.1% | A shift towards sustainable materials influences the evolution of connector production methods. |
| 2029 | 5.2% | Construction trends favor modular designs, increasing connector requirements in architecture. |
| 2030 | 5.1% | Urban redevelopment projects create a spike in demand for high-performance connectors. |
| 2031 | 5.0% | Innovations in connector technology allow for smaller, more efficient electrical systems. |
| 2032 | 4.8% | Global supply chain adjustments streamline connector availability and reduce costs significantly. |
Note - Market size estimations and growth projections presented in this report are based on 6Wresearch's advanced forecasting approach, validated with industry datasets as of June 2026.
Georgia Electric Connectors Market Synopsis
The Georgia Electric Connectors Market is projected to reach 5.0% and witness significant growth during the forecast period (2026-2032). Electric connectors play a vital role in the transmission of power and signals across various electronic devices and systems. The increasing industrial activities in Georgia, particularly in the automotive, electronics, and telecommunications sectors, are driving this market's expansion. With a diverse range of connector types available in the market, there is a clear alignment between product offerings and the specific requirements of high-speed data transmission and operation in rugged environments.
Georgia Electric Connectors Market Growth Drivers
The growth of the Georgia Electric Connectors market is underpinned by several key factors:
- The rapid expansion of the electronics and electrical equipment manufacturing sector continues to boost demand for electric connectors. The increasing complexity of electronic systems necessitates more advanced and diverse connector solutions.
- The rise in automation across industries is creating a greater need for reliable electric connectors. Manufacturers are seeking to implement more sophisticated systems that require efficient power and signal connections.
- High-speed data transmission is becoming a standard requirement as digital communication and internet connectivity expand. Connectors that facilitate faster and more efficient data flow are in high demand.
- The telecommunication sector's growth, driven by advancements in 5G technology, further propels the need for specialized connectors that can support high-performance connectivity solutions.
- The growing trend of IoT (Internet of Things) applications necessitates a wide variety of connectors to enable seamless connectivity between devices, driving innovation in the electric connectors market.
Georgia Electric Connectors Market Challenges and Restraints
Despite its growth potential, the Georgia Electric Connectors Market faces several challenges:
- Ensuring compatibility with a wide range of devices presents a significant challenge for manufacturers. The diversity of connector types required for various applications complicates product development.
- Adhering to stringent safety and performance standards is imperative, yet can hinder innovation and speed to market for new connector technologies.
- The rapid pace of technological advancements creates an environment of intense competition, requiring companies to continuously innovate to remain relevant.
- Navigating international trade regulations and intellectual property issues can be complex, especially for manufacturers aiming to scale their operations globally.
- Managing the environmental impact and sustainability of manufacturing processes is becoming an increasing concern, pushing companies to adopt greener practices and materials.
Georgia Electric Connectors Market Government Investment and Initiatives
In recognition of the importance of the electric connectors market, the Georgia government is implementing several initiatives to foster growth:
- The state is creating a business-friendly environment that encourages investment in the electric connectors sector, facilitating smoother regulatory processes and reducing operational costs for manufacturers.
- Infrastructure support is being enhanced to ensure that manufacturing facilities have the necessary resources for efficient operations, including improved transportation networks for logistics.
- The Department of Labor is actively overseeing workplace safety regulations, ensuring that manufacturing environments prioritize the health and safety of workers involved in the production of electric connectors.
- State trade policies aim to ease the export of Georgia-made electric connectors, enhancing the global competitiveness of local manufacturers.
- Public spending initiatives are directed towards research and development in connector technology, aiming to promote innovation and technological advancement within the state.
Georgia Electric Connectors Market Latest Developments (May 2025 - June 2026)
During the period from May 2025 to June 2026, the Georgia Electric Connectors Market has reflected a dynamic evolution:
- Industry leaders have been focusing on enhancing connector designs to cater to the growing demand for high-speed data transmission, emphasizing miniaturization and durability.
- Ongoing investments in automation technologies have resulted in the introduction of smarter connectors that incorporate advanced features to support IoT applications.
- There has been a notable shift towards sustainable materials in connector manufacturing, driven by both regulatory pressures and consumer demand for environmentally friendly products.
- Collaborations between technology companies and educational institutions have emerged to foster innovation in connector technologies, ensuring the workforce is well-equipped for future challenges.
- Trade agreements aimed at easing export processes have been a focus, boosting the presence of Georgia-made electric connectors in international markets.
Georgia Electric Connectors Market - Key Attractiveness of the Report
- 10 Years of Market Numbers
- Historical Data Starting from 2022 to 2025
- Base Year: 2025
- Forecast Data until 2032
- Key Performance Indicators Impacting the Market
- Major Upcoming Developments and Projects
Key Highlights of the Report:
- Georgia Electric Connectors Market Outlook
- Market Size of Georgia Electric Connectors Market, 2025
- Forecast of Georgia Electric Connectors Market, 2032
- Historical Data and Forecast of Georgia Electric Connectors Revenues & Volume for the Period 2022-2032F
- Georgia Electric Connectors Market Trend Evolution
- Georgia Electric Connectors Market Drivers and Challenges
- Georgia Electric Connectors Price Trends
- Georgia Electric Connectors Porter's Five Forces
- Georgia Electric Connectors Industry Life Cycle
- Historical Data and Forecast of Georgia Electric Connectors Market Revenues & Volume By Type for the Period 2022-2032F
- Historical Data and Forecast of Georgia Electric Connectors Market Revenues & Volume By Aluminum Electrical Connectors for the Period 2022-2032F
- Historical Data and Forecast of Georgia Electric Connectors Market Revenues & Volume By Copper Electrical Connectors for the Period 2022-2032F
- Historical Data and Forecast of Georgia Electric Connectors Market Revenues & Volume By Others for the Period 2022-2032F
- Historical Data and Forecast of Georgia Electric Connectors Market Revenues & Volume By ?Application for the Period 2022-2032F
- Historical Data and Forecast of Georgia Electric Connectors Market Revenues & Volume By Electrical Device for the Period 2022-2032F
- Historical Data and Forecast of Georgia Electric Connectors Market Revenues & Volume By Airplanes for the Period 2022-2032F
- Historical Data and Forecast of Georgia Electric Connectors Market Revenues & Volume By National Defense for the Period 2022-2032F
- Historical Data and Forecast of Georgia Electric Connectors Market Revenues & Volume By Industrial Equipments for the Period 2022-2032F
- Historical Data and Forecast of Georgia Electric Connectors Market Revenues & Volume By Others for the Period 2022-2032F
- Georgia Electric Connectors Import Export Trade Statistics
- Market Opportunity Assessment By Type
- Market Opportunity Assessment By ?Application
- Georgia Electric Connectors Top Companies Market Share
- Georgia Electric Connectors Competitive Benchmarking By Technical and Operational Parameters
- Georgia Electric Connectors Company Profiles
- Georgia Electric Connectors Key Strategic Recommendations
Frequently Asked Questions About the Market Study (FAQs):
Key drivers include the expansion of the electronics manufacturing sector, increasing automation, and the demand for high-speed data transmission in various industries.
The government is fostering a business-friendly environment, enhancing infrastructure, and supporting research and development initiatives to stimulate market growth.
Manufacturers must navigate issues related to device compatibility, maintain stringent safety standards, and adapt to rapid technological changes.
Recent trends include a shift towards sustainable materials, the incorporation of smart technology in connectors, and increased collaboration for innovation within the sector.
6Wresearch actively monitors the Georgia Electric Connectors Market and publishes its comprehensive annual report, highlighting emerging trends, growth drivers, revenue analysis, and forecast outlook. Our insights help businesses to make data-backed strategic decisions with ongoing market dynamics. Our analysts track relevent industries related to the Georgia Electric Connectors Market, allowing our clients with actionable intelligence and reliable forecasts tailored to emerging regional needs.
Yes, we provide customisation as per your requirements. To learn more, feel free to contact us on sales@6wresearch.com
1 Executive Summary |
2 Introduction |
2.1 Key Highlights of the Report |
2.2 Report Description |
2.3 Market Scope & Segmentation |
2.4 Research Methodology |
2.5 Assumptions |
3 Georgia Electric Connectors Market Overview |
3.1 Georgia Country Macro Economic Indicators |
3.2 Georgia Electric Connectors Market Revenues & Volume, 2022 & 2032F |
3.3 Georgia Electric Connectors Market - Industry Life Cycle |
3.4 Georgia Electric Connectors Market - Porter's Five Forces |
3.5 Georgia Electric Connectors Market Revenues & Volume Share, By Type, 2022 & 2032F |
3.6 Georgia Electric Connectors Market Revenues & Volume Share, By Application, 2022 & 2032F |
4 Georgia Electric Connectors Market Dynamics |
4.1 Impact Analysis |
4.2 Market Drivers |
4.3 Market Restraints |
5 Georgia Electric Connectors Market Trends |
6 Georgia Electric Connectors Market, By Types |
6.1 Georgia Electric Connectors Market, By Type |
6.1.1 Overview and Analysis |
6.1.2 Georgia Electric Connectors Market Revenues & Volume, By Type, 2022-2032F |
6.1.3 Georgia Electric Connectors Market Revenues & Volume, By Aluminum Electrical Connectors, 2022-2032F |
6.1.4 Georgia Electric Connectors Market Revenues & Volume, By Copper Electrical Connectors, 2022-2032F |
6.1.5 Georgia Electric Connectors Market Revenues & Volume, By Others, 2022-2032F |
6.2 Georgia Electric Connectors Market, By Application |
6.2.1 Overview and Analysis |
6.2.2 Georgia Electric Connectors Market Revenues & Volume, By Electrical Device, 2022-2032F |
6.2.3 Georgia Electric Connectors Market Revenues & Volume, By Airplanes, 2022-2032F |
6.2.4 Georgia Electric Connectors Market Revenues & Volume, By National Defense, 2022-2032F |
6.2.5 Georgia Electric Connectors Market Revenues & Volume, By Industrial Equipments, 2022-2032F |
6.2.6 Georgia Electric Connectors Market Revenues & Volume, By Others, 2022-2032F |
7 Georgia Electric Connectors Market Import-Export Trade Statistics |
7.1 Georgia Electric Connectors Market Export to Major Countries |
7.2 Georgia Electric Connectors Market Imports from Major Countries |
8 Georgia Electric Connectors Market Key Performance Indicators |
9 Georgia Electric Connectors Market - Opportunity Assessment |
9.1 Georgia Electric Connectors Market Opportunity Assessment, By Type, 2022 & 2032F |
9.2 Georgia Electric Connectors Market Opportunity Assessment, By Application, 2022 & 2032F |
10 Georgia Electric Connectors Market - Competitive Landscape |
10.1 Georgia Electric Connectors Market Revenue Share, By Companies, 2025 |
10.2 Georgia Electric Connectors Market Competitive Benchmarking, By Operating and Technical Parameters |
11 Company Profiles |
12 Recommendations |
13 Disclaimer |
Global Go To Market Strategy - 2030
Export potential enables firms to identify high-growth global markets with greater confidence by combining advanced trade intelligence with a structured quantitative methodology. The framework analyzes emerging demand trends and country-level import patterns while integrating macroeconomic and trade datasets such as GDP and population forecasts, bilateral import–export flows, tariff structures, elasticity differentials between developed and developing economies, geographic distance, and import demand projections. Using weighted trade values from 2020–2024 as the base period to project country-to-country export potential for 2030, these inputs are operationalized through calculated drivers such as gravity model parameters, tariff impact factors, and projected GDP per-capita growth. Through an analysis of hidden potentials, demand hotspots, and market conditions that are most favorable to success, this method enables firms to focus on target countries, maximize returns, and global expansion with data, backed by accuracy.
By factoring in the projected importer demand gap that is currently unmet and could be potential opportunity, it identifies the potential for the Exporter (Country) among 190 countries, against the general trade analysis, which identifies the biggest importer or exporter.
To discover high-growth global markets and optimize your business strategy:
Click Here
Pricing
- Single User License$ 1,995
- Department License$ 2,400
- Site License$ 3,120
- Global License$ 3,795

Leadership Perspectives from Industry Events
Search
Thought Leadership and Analyst Meet


Our Clients
6WResearch In News
- India Air Conditioner Market Set for Strong Rebound in 2026 After Weather-Led Correction and GST-Driven Recovery: 6Wresearch
- ADAS in India: How Automatic Emergency Braking, Blind Spot Detection & Driver Monitoring are Transforming Road Safety
- Doha a strategic location for EV manufacturing hub: IPA Qatar
- Demand for luxury TVs surging in the GCC, says Samsung
- Empowering Growth: The Thriving Journey of Bangladesh’s Cable Industry
- Demand for luxury TVs surging in the GCC, says Samsung
Latest Reports
- Nicaragua RPG Gaming Market (2026-2032)
- New Zealand RPG Gaming Market (2026-2032)
- Netherlands RPG Gaming Market (2026-2032)
- Nauru RPG Gaming Market (2026-2032)
- Namibia RPG Gaming Market (2026-2032)
- Mozambique RPG Gaming Market (2026-2032)
- Montenegro RPG Gaming Market (2026-2032)
- Mongolia RPG Gaming Market (2026-2032)
- Monaco RPG Gaming Market (2026-2032)
- Micronesia RPG Gaming Market (2026-2032)
Industry Events and Analyst Meet

HIMTEX 2026

India Refining Summit 2026

India EV Show 2026

EV tech India Expo 2026

Auto Tech Asia 2026
Whitepaper
- Middle East & Africa Commercial Security Market Click here to view more.
- Middle East & Africa Fire Safety Systems & Equipment Market Click here to view more.
- GCC Drone Market Click here to view more.
- Middle East Lighting Fixture Market Click here to view more.
- GCC Physical & Perimeter Security Market Click here to view more.