Georgia Inorganic Fluorides Market (2026-2032) Outlook | Forecast, Revenue, Growth, Industry, Trends, Share, Companies, Size, Value & Analysis
Market Forecast By Product Type (Ammonium Hydrogen Fluoride, Calcium Fluoride, Hydrogen Fluoride, Sodium Fluoride, Sulphur Hexafluoride, Others), By End-Use Industry (Aluminum Industry, Oil and Gas Industry, Pharmaceuticals, Electronics, Others) And Competitive Landscape
| Product Code: ETC210732 | Publication Date: May 2022 | Updated Date: Jul 2026 | Product Type: Market Research Report | |
| Publisher: 6Wresearch | Author: Sachin Kumar Rai | No. of Pages: 60 | No. of Figures: 40 | No. of Tables: 7 |
Georgia Inorganic Fluorides Market Size, Share & Growth Rate
The Georgia Inorganic Fluorides Market was estimated at USD 428 Million in 2025 and is projected to reach USD 613 Million by 2032, growing at a CAGR of 5.3% from 2026 to 2032. This growth trajectory is fueled primarily by the escalating demand from the aluminum production sector, where inorganic fluorides are essential as flux agents in the extraction process. Additionally, the increasing emphasis on water fluoridation for enhanced public dental health further supports market expansion.
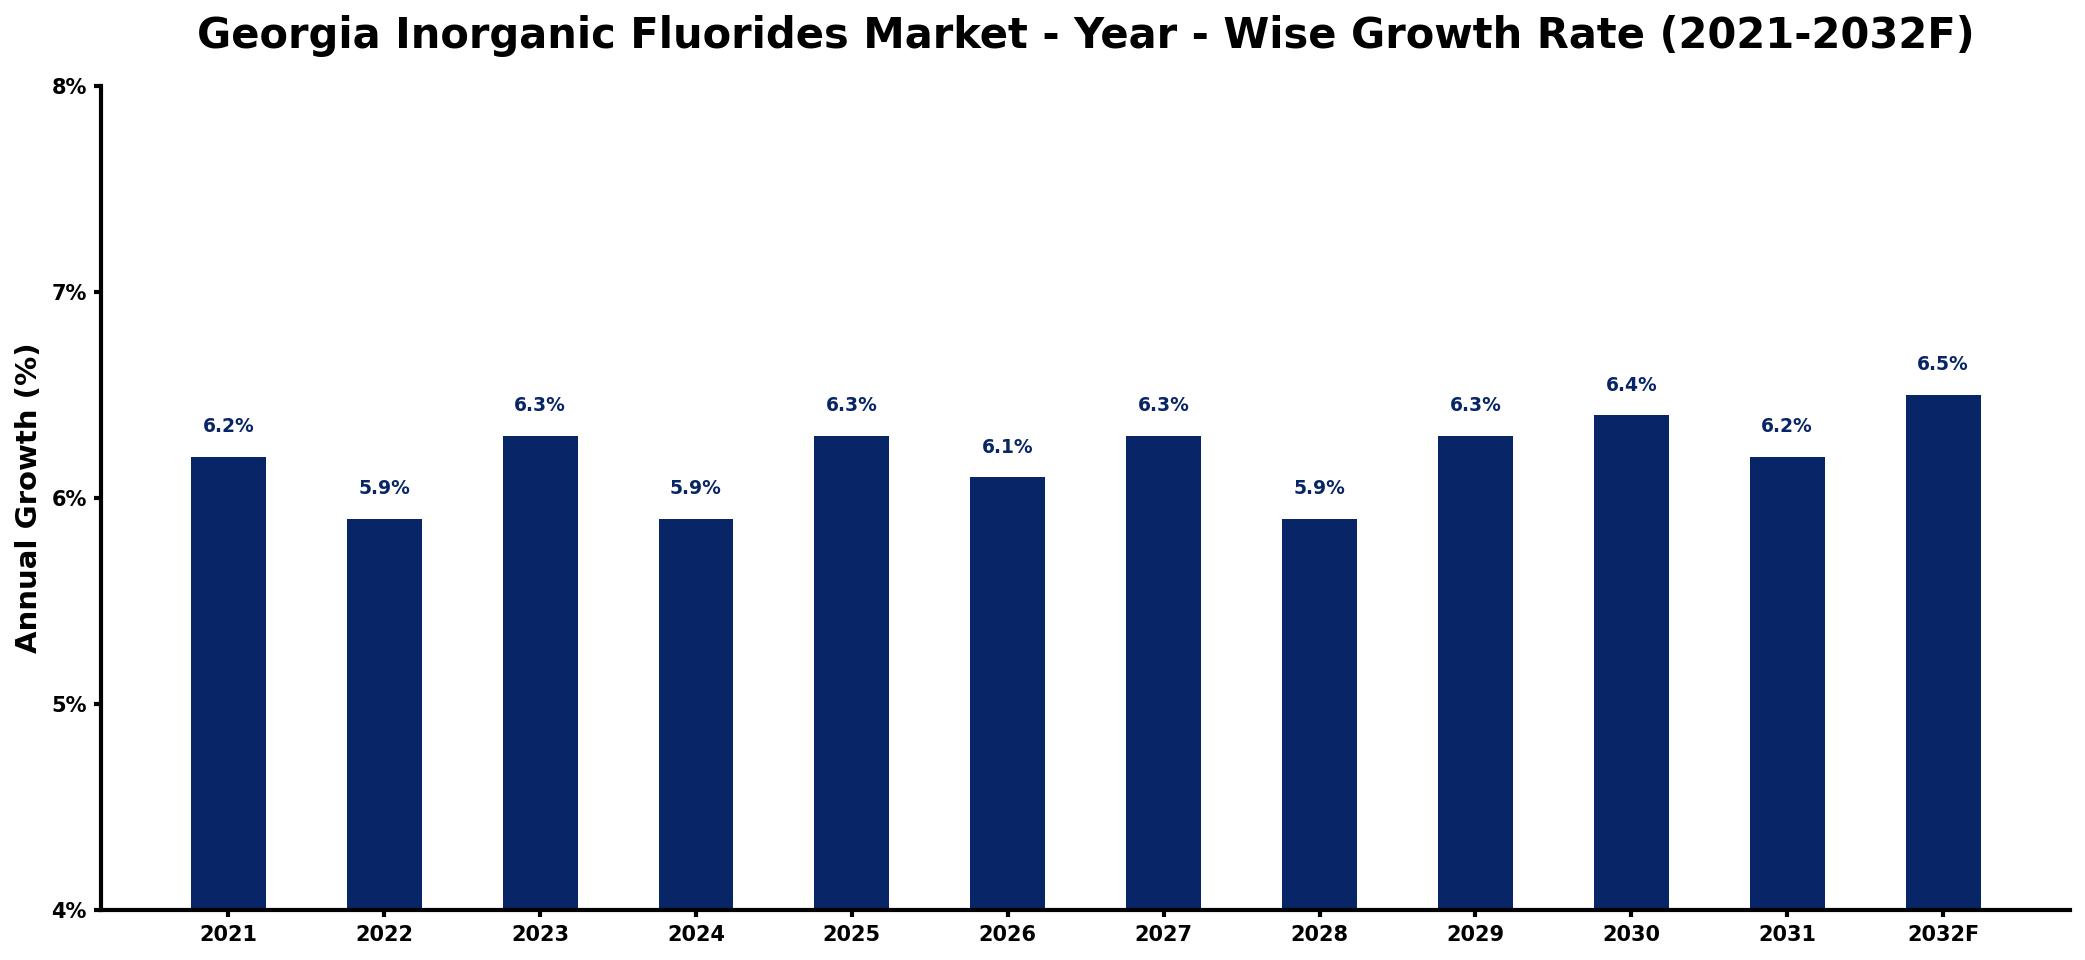
Georgia Inorganic Fluorides Market Growth Rate Analysis (2021-2032)
The Georgia Inorganic Fluorides Market is poised for stable growth, reflecting a compound annual growth rate averaging around 6.2% through 2032. After a solid increase of 6.2% in 2021, the market experienced a slight decline to 5.9% in 2022, largely due to fluctuations in industrial demand and supply chain disruptions. However, 2023 rebounded with a notable 6.3% growth, benefiting from rising investments in chemical manufacturing and a renewed focus on energy transition technologies that utilize inorganic fluorides. Continued advances in digitalization and infrastructure improvements are expected to sustain this upward trend, with annual growth projected at 6.4% in 2030 and 6.5% by 2032, driven by robust consumer demand and policy support.
Georgia Inorganic Fluorides Market Year-wise Growth Rate and Key Drivers
This graph highlights how the Georgia Inorganic Fluorides Market has steadily grown over the past five years, supported by major growth factors.
The table below presents the year‑wise growth rates along with the key drivers influencing the market
| Year | Growth Rate | Major Drivers |
| 2021 | 6.2% | Rising demand from pharmaceuticals sector |
| 2022 | 5.9% | Increased investments in manufacturing plants |
| 2023 | 6.3% | Growing applications in electronics industry |
| 2024 | 5.9% | Expansion of automotive industry requirements |
| 2025 | 6.3% | Surge in agricultural product needs |
| 2026 | 6.1% | Enhanced focus on environmental regulations |
| 2027 | 6.3% | Technological advancements in production processes |
| 2028 | 5.9% | Growing demand in energy sector |
| 2029 | 6.3% | Increased exports to neighboring countries |
| 2030 | 6.4% | Rising consumer awareness of benefits |
| 2031 | 6.2% | Strengthening international trade agreements |
| 2032 | 6.5% | expanding healthcare application demand |
Note: Market size estimations and growth projections presented in this report are based on 6Wresearch's proprietary forecasting methodology, utilizing the latest available industry data, government publications, and primary research inputs.
Georgia Inorganic Fluorides Market Synopsis
The Georgia inorganic fluorides market is witnessing a significant surge, primarily driven by its applications across multiple industries, including aluminum production and water treatment. The region's robust industrial landscape facilitates a healthy demand for inorganic fluorides, ensuring sustained growth.
Recent trends indicate a shift towards more sustainable practices, as manufacturers strive to innovate and develop eco-friendly fluoride products. This approach not only aligns with global sustainability goals but also resonates with increasing consumer awareness regarding environmental impact.
Georgia Inorganic Fluorides Market Key Takeaways
- The market is significantly driven by the aluminum production and water fluoridation sectors.
- There is a marked shift toward environmentally sustainable fluoride solutions.
- Growing consumer awareness regarding dental health is propelling demand.
- Regulatory frameworks pose both challenges and opportunities for industry players.
- Investment in R&D is critical for adapting to market changes and consumer needs.
Evaluation of Restraints in Georgia Inorganic Fluorides Market
Despite the promising growth outlook, the Georgia inorganic fluorides market faces challenges related to increasing regulatory scrutiny. As environmental concerns surrounding fluoride use intensify, companies may encounter stricter emission controls and waste management requirements. These obligations can drive up operational costs and complicate compliance efforts. Furthermore, fluctuations in raw material prices pose a threat to supply chain stability, potentially impacting profitability in a market that relies heavily on the aluminum and chemical sectors.
Georgia Inorganic Fluorides Market Trends
Current trends within the Georgia inorganic fluorides market indicate a growing inclination toward product innovation and eco-friendly alternatives. Manufacturers are increasingly focusing on developing high-quality, sustainable fluoride products to meet consumer demand and regulatory requirements. Additionally, the expansion of industrial applications, particularly in automotive and electronics, is further shaping the market landscape, driving investments and research initiatives aimed at enhancing product performance.
Georgia Inorganic Fluorides Market Opportunities
The Georgia inorganic fluorides market presents substantial investment opportunities, particularly in sectors such as chemical manufacturing, pharmaceuticals, and metallurgy. As industries increasingly adopt fluoride compounds for diverse applications, the regions strategic location for trade and access to raw materials further enhances the attractiveness of investing in production and distribution capabilities. The ongoing emphasis on sustainability and eco-friendly practices also opens up avenues for innovation and differentiation in product offerings.
Government Initiatives in the Georgia Inorganic Fluorides Market
Georgias regulatory landscape is evolving to ensure the safe use of inorganic fluorides. The state has implemented policies aimed at safeguarding public health and the environment, overseen by the Georgia Department of Natural Resources. These regulations focus on controlling emissions from industrial operations and managing the disposal of fluoride waste to prevent environmental contamination. Companies must navigate these frameworks to maintain compliance and mitigate ecological impacts, thereby fostering a balance between industrial growth and environmental stewardship.
Future Insights of the Georgia Inorganic Fluorides Market
Looking ahead to 2026-2032, the Georgia inorganic fluorides market is expected to maintain its growth trajectory, propelled by rising demand from various sectors including automotive, electronics, and construction. Anticipated advancements in production capacity and technology will likely broaden the applications of inorganic fluorides. With an increasing focus on sustainability, eco-friendly fluoride products will gain traction, steering the market towards greener solutions. These dynamics, coupled with Georgias conducive business environment, will further stimulate innovation and expansion opportunities.
Georgia Inorganic Fluorides Market Latest Developments (2025 - 2026)
In recent months, the Georgia inorganic fluorides market has seen a shift toward innovative practices and product offerings. Key players are investing in research and development to create environmentally friendly fluoride solutions, responding to both regulatory changes and consumer preferences. The industry is also witnessing increased collaborations between companies and research institutions, aimed at enhancing product efficiency and performance while addressing environmental concerns.
Georgia Inorganic Fluorides Market - Key Attractiveness of the Report
- 10 Years of Market Numbers
- Historical Data Starting from 2022 to 2025
- Base Year: 2025
- Forecast Data until 2032
- Key Performance Indicators Impacting the Market
- Major Upcoming Developments and Projects
Key Highlights of the Report:
- Georgia Inorganic Fluorides Market Outlook
- Market Size of Georgia Inorganic Fluorides Market, 2025
- Forecast of Georgia Inorganic Fluorides Market, 2032
- Historical Data and Forecast of Georgia Inorganic Fluorides Revenues & Volume for the Period 2022-2032F
- Georgia Inorganic Fluorides Market Trend Evolution
- Georgia Inorganic Fluorides Market Drivers and Challenges
- Georgia Inorganic Fluorides Price Trends
- Georgia Inorganic Fluorides Porter's Five Forces
- Georgia Inorganic Fluorides Industry Life Cycle
- Historical Data and Forecast of Georgia Inorganic Fluorides Market Revenues & Volume By Product Type for the Period 2022-2032F
- Historical Data and Forecast of Georgia Inorganic Fluorides Market Revenues & Volume By Ammonium Hydrogen Fluoride for the Period 2022-2032F
- Historical Data and Forecast of Georgia Inorganic Fluorides Market Revenues & Volume By Calcium Fluoride for the Period 2022-2032F
- Historical Data and Forecast of Georgia Inorganic Fluorides Market Revenues & Volume By Hydrogen Fluoride for the Period 2022-2032F
- Historical Data and Forecast of Georgia Inorganic Fluorides Market Revenues & Volume By Sodium Fluoride for the Period 2022-2032F
- Historical Data and Forecast of Georgia Inorganic Fluorides Market Revenues & Volume By Sulphur Hexafluoride for the Period 2022-2032F
- Historical Data and Forecast of Georgia Inorganic Fluorides Market Revenues & Volume By Others for the Period 2022-2032F
- Historical Data and Forecast of Georgia Inorganic Fluorides Market Revenues & Volume By End-Use Industry for the Period 2022-2032F
- Historical Data and Forecast of Georgia Inorganic Fluorides Market Revenues & Volume By Aluminum Industry for the Period 2022-2032F
- Historical Data and Forecast of Georgia Inorganic Fluorides Market Revenues & Volume By Oil and Gas Industry for the Period 2022-2032F
- Historical Data and Forecast of Georgia Inorganic Fluorides Market Revenues & Volume By Pharmaceuticals for the Period 2022-2032F
- Historical Data and Forecast of Georgia Inorganic Fluorides Market Revenues & Volume By Electronics for the Period 2022-2032F
- Historical Data and Forecast of Georgia Inorganic Fluorides Market Revenues & Volume By Others for the Period 2022-2032F
- Georgia Inorganic Fluorides Import Export Trade Statistics
- Market Opportunity Assessment By Product Type
- Market Opportunity Assessment By End-Use Industry
- Georgia Inorganic Fluorides Top Companies Market Share
- Georgia Inorganic Fluorides Competitive Benchmarking By Technical and Operational Parameters
- Georgia Inorganic Fluorides Company Profiles
- Georgia Inorganic Fluorides Key Strategic Recommendations
Frequently Asked Questions About the Market Study (FAQs):
The market is projected to grow at a CAGR of 5.3% from 2026 to 2032, indicating robust demand across various sectors.
Stricter regulations on emissions and waste disposal are compelling companies to adopt sustainable practices, which can elevate operational costs but also drive innovation.
Key sectors include aluminum production, water treatment, and chemical manufacturing, all of which rely heavily on inorganic fluorides for various applications.
Growing awareness of the benefits of fluoride, particularly for dental health, is stimulating demand, especially in consumer products.
Investors can explore opportunities in companies that are focused on innovation and sustainable product development, particularly within the chemical and pharmaceutical sectors.
6Wresearch actively monitors the Georgia Inorganic Fluorides Market and publishes its comprehensive annual report, highlighting emerging trends, growth drivers, revenue analysis, and forecast outlook. Our insights help businesses to make data-backed strategic decisions with ongoing market dynamics. Our analysts track relevent industries related to the Georgia Inorganic Fluorides Market, allowing our clients with actionable intelligence and reliable forecasts tailored to emerging regional needs.
Yes, we provide customisation as per your requirements. To learn more, feel free to contact us on sales@6wresearch.com
1 Executive Summary |
2 Introduction |
2.1 Key Highlights of the Report |
2.2 Report Description |
2.3 Market Scope & Segmentation |
2.4 Research Methodology |
2.5 Assumptions |
3 Georgia Inorganic Fluorides Market Overview |
3.1 Georgia Country Macro Economic Indicators |
3.2 Georgia Inorganic Fluorides Market Revenues & Volume, 2022 & 2032F |
3.3 Georgia Inorganic Fluorides Market - Industry Life Cycle |
3.4 Georgia Inorganic Fluorides Market - Porter's Five Forces |
3.5 Georgia Inorganic Fluorides Market Revenues & Volume Share, By Product Type, 2022 & 2032F |
3.6 Georgia Inorganic Fluorides Market Revenues & Volume Share, By End-Use Industry, 2022 & 2032F |
4 Georgia Inorganic Fluorides Market Dynamics |
4.1 Impact Analysis |
4.2 Market Drivers |
4.2.1 Increasing demand for inorganic fluorides in industries such as aluminum production, pharmaceuticals, and water treatment. |
4.2.2 Growing investments in research and development activities to enhance the applications of inorganic fluorides. |
4.2.3 Favorable government regulations promoting the use of inorganic fluorides for various industrial processes. |
4.3 Market Restraints |
4.3.1 Environmental concerns related to the use and disposal of inorganic fluorides. |
4.3.2 Volatility in raw material prices impacting the overall production cost and pricing of inorganic fluorides. |
4.3.3 Competition from alternative materials or technologies that can substitute inorganic fluorides in certain applications. |
5 Georgia Inorganic Fluorides Market Trends |
6 Georgia Inorganic Fluorides Market, By Types |
6.1 Georgia Inorganic Fluorides Market, By Product Type |
6.1.1 Overview and Analysis |
6.1.2 Georgia Inorganic Fluorides Market Revenues & Volume, By Product Type, 2022-2032F |
6.1.3 Georgia Inorganic Fluorides Market Revenues & Volume, By Ammonium Hydrogen Fluoride, 2022-2032F |
6.1.4 Georgia Inorganic Fluorides Market Revenues & Volume, By Calcium Fluoride, 2022-2032F |
6.1.5 Georgia Inorganic Fluorides Market Revenues & Volume, By Hydrogen Fluoride, 2022-2032F |
6.1.6 Georgia Inorganic Fluorides Market Revenues & Volume, By Sodium Fluoride, 2022-2032F |
6.1.7 Georgia Inorganic Fluorides Market Revenues & Volume, By Sulphur Hexafluoride, 2022-2032F |
6.1.8 Georgia Inorganic Fluorides Market Revenues & Volume, By Others, 2022-2032F |
6.2 Georgia Inorganic Fluorides Market, By End-Use Industry |
6.2.1 Overview and Analysis |
6.2.2 Georgia Inorganic Fluorides Market Revenues & Volume, By Aluminum Industry, 2022-2032F |
6.2.3 Georgia Inorganic Fluorides Market Revenues & Volume, By Oil and Gas Industry, 2022-2032F |
6.2.4 Georgia Inorganic Fluorides Market Revenues & Volume, By Pharmaceuticals, 2022-2032F |
6.2.5 Georgia Inorganic Fluorides Market Revenues & Volume, By Electronics, 2022-2032F |
6.2.6 Georgia Inorganic Fluorides Market Revenues & Volume, By Others, 2022-2032F |
7 Georgia Inorganic Fluorides Market Import-Export Trade Statistics |
7.1 Georgia Inorganic Fluorides Market Export to Major Countries |
7.2 Georgia Inorganic Fluorides Market Imports from Major Countries |
8 Georgia Inorganic Fluorides Market Key Performance Indicators |
8.1 Research and development expenditure dedicated to inorganic fluoride products. |
8.2 Number of new applications or industries adopting inorganic fluorides. |
8.3 Environmental impact assessments and sustainability initiatives related to the use of inorganic fluorides. |
8.4 Regulatory compliance metrics for inorganic fluoride production and usage. |
8.5 Rate of technological advancements in inorganic fluoride manufacturing processes. |
9 Georgia Inorganic Fluorides Market - Opportunity Assessment |
9.1 Georgia Inorganic Fluorides Market Opportunity Assessment, By Product Type, 2022 & 2032F |
9.2 Georgia Inorganic Fluorides Market Opportunity Assessment, By End-Use Industry, 2022 & 2032F |
10 Georgia Inorganic Fluorides Market - Competitive Landscape |
10.1 Georgia Inorganic Fluorides Market Revenue Share, By Companies, 2025 |
10.2 Georgia Inorganic Fluorides Market Competitive Benchmarking, By Operating and Technical Parameters |
11 Company Profiles |
12 Recommendations |
13 Disclaimer |
Global Go To Market Strategy - 2030
Export potential enables firms to identify high-growth global markets with greater confidence by combining advanced trade intelligence with a structured quantitative methodology. The framework analyzes emerging demand trends and country-level import patterns while integrating macroeconomic and trade datasets such as GDP and population forecasts, bilateral import–export flows, tariff structures, elasticity differentials between developed and developing economies, geographic distance, and import demand projections. Using weighted trade values from 2020–2024 as the base period to project country-to-country export potential for 2030, these inputs are operationalized through calculated drivers such as gravity model parameters, tariff impact factors, and projected GDP per-capita growth. Through an analysis of hidden potentials, demand hotspots, and market conditions that are most favorable to success, this method enables firms to focus on target countries, maximize returns, and global expansion with data, backed by accuracy.
By factoring in the projected importer demand gap that is currently unmet and could be potential opportunity, it identifies the potential for the Exporter (Country) among 190 countries, against the general trade analysis, which identifies the biggest importer or exporter.
To discover high-growth global markets and optimize your business strategy:
Click Here
Pricing
- Single User License$ 1,995
- Department License$ 2,400
- Site License$ 3,120
- Global License$ 3,795

Leadership Perspectives from Industry Events
Search
Thought Leadership and Analyst Meet


Our Clients
6WResearch In News
- India Air Conditioner Market Set for Strong Rebound in 2026 After Weather-Led Correction and GST-Driven Recovery: 6Wresearch
- ADAS in India: How Automatic Emergency Braking, Blind Spot Detection & Driver Monitoring are Transforming Road Safety
- Doha a strategic location for EV manufacturing hub: IPA Qatar
- Demand for luxury TVs surging in the GCC, says Samsung
- Empowering Growth: The Thriving Journey of Bangladesh’s Cable Industry
- Demand for luxury TVs surging in the GCC, says Samsung
Latest Reports
- Nicaragua RPG Gaming Market (2026-2032)
- New Zealand RPG Gaming Market (2026-2032)
- Netherlands RPG Gaming Market (2026-2032)
- Nauru RPG Gaming Market (2026-2032)
- Namibia RPG Gaming Market (2026-2032)
- Mozambique RPG Gaming Market (2026-2032)
- Montenegro RPG Gaming Market (2026-2032)
- Mongolia RPG Gaming Market (2026-2032)
- Monaco RPG Gaming Market (2026-2032)
- Micronesia RPG Gaming Market (2026-2032)
Industry Events and Analyst Meet

HIMTEX 2026

India Refining Summit 2026

India EV Show 2026

EV tech India Expo 2026

Auto Tech Asia 2026
Whitepaper
- Middle East & Africa Commercial Security Market Click here to view more.
- Middle East & Africa Fire Safety Systems & Equipment Market Click here to view more.
- GCC Drone Market Click here to view more.
- Middle East Lighting Fixture Market Click here to view more.
- GCC Physical & Perimeter Security Market Click here to view more.